0235 Red Oak Dr · Onalaska, TX
Flood risk 1/10 · Minimal
- FEMA flood zone
- X (unshaded)
- Chance of flooding over 30 yrs
- 0.0%
- Est. flood insurance / yr
- $507 – $1,088
Fire risk 4/10 · Minor
- Est. fire insurance / yr
- $1,222 – $2,270
Heat risk 8/10 · Major
- Hot days now (above 111°F)
- 7 days/yr
- Hot days in 30 yrs
- 23 days/yr
Wind risk 8/10 · Major
- Chance of severe wind over 30 yrs
- 98.0%
Air-quality risk 1/10 · Minimal
- Unhealthy air days now
- 0 days/yr
- Unhealthy air days in 30 yrs
- 0 days/yr
Risk factors via First Street. Map © Google.
Why this score? — see what drove the F grade
The composite is a weighted blend of 9 inputs, each scored 0–100. Each bar is that input's sub-score; the figure is the points it added to the 100-point composite (weight × sub-score).
- ARV discount +7.5/15.0
- Cash flow +6.9/30.0
- Appreciation +4.7/10.0
- Schools +4.1/10.0
- Livability +3.0/5.0
- Rent growth +2.5/5.0
- Condition / age +2.5/5.0
- 1% rule +2.1/10.0
- DSCR +1.2/10.0
$150,000
🖨 Deal sheet (PDF) 📄 Offer letter ✓ Due diligence
Listing remarks
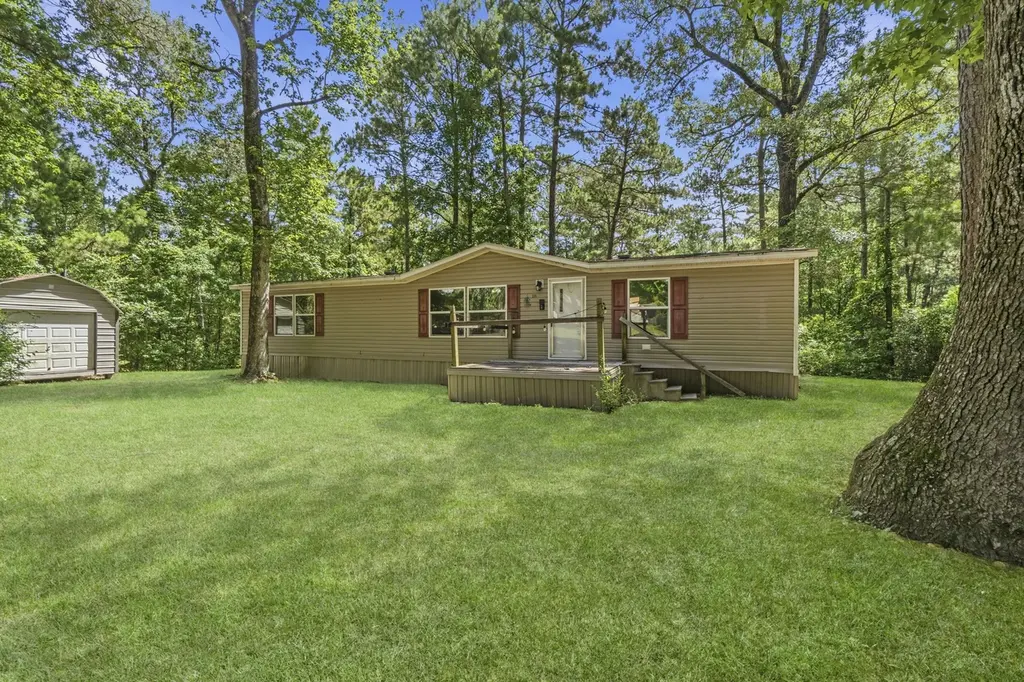
Nestled on more than 1.3 wooded acres in Onalaska, this home boast a spacious open floor plan designed for effortless entertaining. The large primary suite offers a private ensuite bath, a dreamy walk-in closet, and even a TV in the bathroom for next-level relaxation. The island kitchen is ideal for gatherings, opening seamlessly into the main living areas. Outside, the expansive yard provides endless possibilities, whether you envision outdoor entertaining, recreation, or simply enjoying the peaceful wooded setting. Storage building on the property.
Key facts
- Open floor plan
- Walk-in closet
- Island kitchen
Tags
Property features AI
Finance
- Other: Municipal Utility District disclosure and seller disclosure provided
- HOA & community: Canyon Park POA with an annual fee of $384 covering the clubhouse
Exterior
- Utilities: Public water; Public sewer
- Home design: Residential property; Full ownership; Built in 2019
- Construction: Vinyl siding; Composition roof; Built in 2019
- Exterior features: Subdivision setting; Wooded lot; Asphalt road access
Interior
- Kitchen: Dishwasher; Electric oven; Electric range
- Bedrooms: Primary bedroom on the first floor (17 x 13); Bedroom on the first floor (10 x 13); Bedroom on the first floor (10 x 12)
- Bathrooms: 2 full bathrooms
- Heating & cooling: Central heating (electric); Central air (electric)
- Interior features: Washer hookup and electric dryer hookup; Dishwasher; Electric oven; Electric range
- Laundry & utility: Washer hookup; Electric dryer hookup
Neighborhood map
What this means for you Summary
Snapshot
- This is a ?-bed/2.0-bath single-family listed at $150k.
Deal economics
- At list price, monthly cash flow is $-223 ($-3k/yr) — negative.
- To cash-flow at today's rent, offer at most $118k (21.6% below list).
- To meet the 1% rule (rent ≥ 1% of price), the offer needs to be $107k (28.7% below list).
- Recommended offer: $107k (28.7% below list) — sets the bar for 1% rule.
- Cap rate 4.5% vs local median 2.8% in Onalaska — top-decile yield for the area; either an underpriced asset or a hidden risk that comps aren't pricing in. Stress-test before assuming the spread holds.
Location & tenants
- Location reads 60/100 on livability (#1,055 in TX) — a middle-class / working-renter tenant base. Strengths: cost of living A+, housing A+; Watch: employment C-, crime D+, amenities F.
- Onalaska ISD (rural): math 50% / reading 48% proficiency, ranked #213 of 826 in TX (top 26%) — families likely to look elsewhere, expect single-tenant / working-renter base with shorter leases.
- Zoned schools: Onalaska El (math 52% / reading 42%, grade D-, #1,006 of 4,322 statewide, top 25%, 712 students, 70% FRL); Onalaska Jr/Sr High (math 48% / reading 55%, grade D+, #478 of 1,632 statewide, top 29%, 527 students, 58% FRL).
- Market conditions: 353 active listings in the ZIP; 8 comparable units currently listed for rent nearby; rentals lingering (median 46d on market — plan ~5-8 weeks vacancy on turnover, expect pricing pressure); 88% of comp listings sitting > 30 days — soft ceiling on asking rent; 769 units permitted in Polk County in 2024 (0 in 5+ unit buildings).
Forward outlook
- In year one you build about $124 of equity ($1k loan paydown + $-913 appreciation (-0.6% local appreciation)).
- Polk County population projected at +16% by 2050 — long-run rental-demand tailwind backs the buy-and-hold thesis.
Negotiation context
- It's been on market 16 days — a 2% lower offer ($148k) is reasonable based on typical stale-listing flexibility.
Risks & watch-outs
- Climate carrying-cost: severe wind risk, 98% chance of damaging wind over 30y; extreme-heat days projected 7→23/yr by 2055 (HVAC capex compounding) — expect insurance premiums to compound above CPI over the hold.
Questions for the listing agent
- What do current leases actually rent for vs. the listed asking? Can we see a recent rent roll and the last 12 months of T-12 income?
- What does the HOA fee cover, when was the last increase, and are there any pending special assessments or reserve-fund shortfalls?
- Is there a deadline driving the sale (1031 exchange, divorce, estate, relocation)? That informs how much negotiation room exists.
- Schools are D-rated, which usually means shorter tenancies and higher turnover. Who's the typical renter profile here, and what's been the actual vacancy rate?
- Crime grade is D in this area — have there been break-ins, vandalism, or insurance claims at this property in the last 3 years? What carrier currently insures it and at what premium?
- The area grade is low — what's the realistic commute time and amenity access for the typical tenant pool here? Any planned neighborhood developments (good or bad) we should know about?
- What's the average days-on-market for RENTAL listings here right now (not sales)? A rising rental-DOM trend means longer vacancies and softer asking-rent achievability than the comps imply.
- What's the recent tenant-quality profile in this submarket — average credit score on applications, eviction rate, late-payment / NSF rate, and stable-employment percentage? A property-management company in the area should have these aggregated.
- How much new for-sale + rental construction is in the pipeline within 1–3 miles? Heavy new supply typically softens prices + rents 12–24 months out; constrained supply supports both.
Investment metrics
- 1% rule
- 0.71% ✗
- Cap rate
- 4.51%
- Cash-on-cash
- -6.38%
- DSCR
- 0.72
- GRM
- 11.7
CMA / ARV
No comps found within radius.
Projected returns pro-forma
-0.61% appreciation · 3.0% rent growth · sell at horizon
- IRR
- -12.3%
- Equity multiple
- 0.46×
- Total profit
- $-22,824
- Equity at exit
- $39,046
- IRR
- -5.7%
- Equity multiple
- 0.45×
- Total profit
- $-23,036
- Equity at exit
- $43,473
Cash invested: $42,000 (down + closing). Projections, not guarantees.
Landlord ↔ Tenant lean methodology
- Overall (STATE)
- 87 Strongly Landlord-Friendly
- State Texas
- 87 Strongly Landlord-Friendly · R+5
- County
- — inherits STATE
- City
- — inherits STATE
ZIP-level market 77360
- Home prices YoY
- -0.4%
- Active inventory
- 353
- Price-to-rent
- 11.7×
Monthly cashflow live
- Estimated rent
- $1,070 high interval (Pro) →
- Mortgage (P&I)
- −$787
- Tax est. 1.5%
- −$188 /mo · $2,250/yr
- Insurance
- −$62
- HOA
- −$32
- Vacancy / Maint / Mgmt
- −$225
- Net cashflow
- $-223
Break-even live
Sensitivity live
| Price | -10% $-120 | -5% $-172 | +0% $-223 | +5% $-275 | +10% $-327 |
|---|---|---|---|---|---|
| Rent | -10% $-308 | -5% $-266 | +0% $-223 | +5% $-181 | +10% $-139 |
| Rate | -1.0pp $-148 | -0.5pp $-185 | base $-223 | +0.5pp $-262 | +1.0pp $-302 |
UW: 25.0% down · 7.5% · 30yr · 1.5% tax · 5.0% vac · 8.0% maint · 8.0% mgmt
Financing live
Cash to close
- Down payment
- $37,500
- Closing costs
- $4,500
- Reserves months
- —
- Total cash needed
- —
Loan-product check · same deal, 3 products live
Conventional
25% down · 7.5% · 30yr
- Down + closing
- —
- Monthly P&I
- —
- Monthly cashflow
- —
- DSCR
- —
- Eligible?
- —
Personal DTI + credit; lowest rate.
DSCR
20% down · 8.5% · 30yr
- Down + closing
- —
- Monthly P&I
- —
- Monthly cashflow
- —
- DSCR
- —
- Eligible?
- —
No personal income docs; deal must DSCR.
Hard money
10% down · 12.0% · 12mo
- Down + closing
- —
- Monthly P&I
- —
- Monthly cashflow
- —
- DSCR
- —
- Eligible?
- —
Short-term bridge; refi at stabilization.
Rent comps 8 comps
| Address | Beds | Baths | Sqft | Rent | $/sqft | DOM | Units | Dist |
|---|---|---|---|---|---|---|---|---|
| 253 Old Groveton Rd S Onalaska, TX | 2.0 | 1.0 | — | $1,200 | — | 45d | 1 | 0.34mi |
| 132 Broken Arrow Onalaska, TX | 3.0 | 2.0 | 1000 | $1,400 | $1.40 | 45d | 1 | 0.42mi |
| 210 H Pickens Rd Unit 10 Onalaska, TX | 1.0 | 1.0 | — | $975 | — | 45d | 1 | 0.63mi |
| 210 H Pickens Rd Unit 4 Onalaska, TX | 1.0 | 1.0 | 430 | $905 | $2.10 | 45d | 1 | 0.63mi |
| 413 N FM 356 Onalaska, TX | 1.0 | 1.0 | — | $900 | — | 45d | 1 | 0.67mi |
| 120 Farm to Market Road 356 Unit 4 Onalaska, TX | 2.0 | 1.0 | 754 | $875 | $1.16 | 45d | 1 | 0.75mi |
| 380 Mulberry Cv Onalaska, TX | 2.0 | 1.0 | — | $1,200 | — | 15d | 1 | 1.16mi |
| 2001 N Fm Unit Cottage Onalaska, TX | 1.0 | 1.0 | — | $990 | — | 45d | 1 | 1.43mi |
HOA detail
- Monthly dues
- $32 · $384/yr
Listing history 13 events
-
2026-06-21days on market $150,000 Active 16 DOM
-
2026-06-19days on market $150,000 Active 14 DOM
-
2026-06-18days on market $150,000 Active 13 DOM
-
2026-06-17days on market $150,000 Active 12 DOM
-
2026-06-16days on market $150,000 Active 11 DOM
-
2026-06-15days on market $150,000 Active 10 DOM
-
2026-06-14days on market $150,000 Active 8 DOM
-
2026-06-13days on market $150,000 Active 7 DOM
-
2026-06-10days on market $150,000 Active 5 DOM
-
2026-06-09days on market $150,000 Active 4 DOM
-
2026-06-08days on market $150,000 Active 3 DOM
-
2026-06-07remarks 556-char remark
-
2026-06-07$150,000 Active 2 DOM
ⓘ Source: listings_history table (triggers on properties + properties_extension) + one-shot
backfill from property_details.listing_events for pre-trigger history.
Climate risk First Street
- Flood 1/10 Low FEMA zone X (unshaded) · 0% chance over 30 yrs
- Wildfire 4/10 Moderate
- Heat 8/10 Severe 7 d/yr ≥111°F today · 23 d/yr by 30 yrs out
- Wind 8/10 Severe 98% chance of damaging wind over 30 yrs
- Air quality 1/10 Low 0 unhealthy d/yr today · 0 by 30 yrs out
Nearby sold comps map
Loading sold comps map…
Walkable amenities ~0.75 mi
Loading nearby amenities…
Taxation est. · year 1
- Rental income
- $12,838
- − Mortgage interest
- −$8,402
- − Property taxes
- −$2,250
- − Insurance
- −$750
- − Repairs & maintenance
- −$1,027
- − Management
- −$1,027
- − HOA
- −$384
- − Depreciation
- −$4,364
- Taxable loss
- −$5,366
- Est. tax savings @ 24.0%
- +$1,288
- After-tax cash flow
- $-1,394/yr
For passive investors: Depreciation is non-cash, so a rental often shows a tax loss while cash-flowing — sheltering income. Rental losses are passive: they offset passive income freely, and up to $25,000/yr can offset ordinary (W-2) income if you actively participate and your MAGI is under $100k (phasing out to $0 by $150k); unused losses carry forward. On sale, claimed depreciation is recaptured at up to 25%, and gains may owe capital-gains tax (a 1031 exchange can defer both). Figures are a year-1 estimate at your 24.0% rate — not tax advice; consult a CPA.
Schools (NCES district)
- District
- Onalaska ISD
- NCES district ID
- 4833690
- Math proficiency
- 50% ▼ -10.00%
- Reading proficiency
- 48% ▼ -1.00%
- Median HH income
- $38,882
- Composite
- 40.91/100
- National rank
- #3616
- State rank
- #213 of 826 in TX
Livability — Onalaska
- Score
- 60/100
- State rank
- #1055
- US rank
- #18716
Category grades
Schools grade is shown separately in the Schools card above.
Census & demographics
- Census place
- Onalaska, TX
- Population (ZIP)
- 6,130
Population outlook (Polk County) Hauer SSP2
- Today (2025)
- 51,049 people
- By 2030
- 53,243 · +4.3%
- By 2040
- 56,528 · +10.7%
- By 2050
- 59,243 · +16.1%
- By 2075
- 63,528 · +24.4%
- By 2100
- 60,376 · +18.3%
Race, ethnicity, and origin ACS 2023
- Neighborhood character
- Predominantly White (86%)
- Race & ethnicity
- White 86% Two or more races 10% Hispanic / Latino 8%
- Hispanic origin (detail)
- Mexican 7%
- Common ancestry
- Lithuanian 4% Italian 2% Romanian 2%
- Foreign-born
- 1% · Canada
- Languages at home
- 95% English-only · Spanish 5%
Political lean MEDSL · Polk
- 2024 margin
- Solid R (+58.9) · D 20.2% · R 79.1%
- 2008→2024 swing
- -21.7pp toward R · 2008: -37.2pp · 2024: -58.9pp
- All cycles
- 2024: R+58.9 2020: R+54.5 2016: R+56.5 2012: R+48.2 2008: R+37.2
Not yet ingested
- Civics
- —
Market trends
- HPI YoY
- ▼ -0.61%
- Current HPI
- 150.9486
- Rent YoY
- —
- Metro
- —
- State GDP YoY
- ▲ 3.95%
- F500 in state
- 110
Industry mix (Fortune 500 HQ in TX)
| Industry | F500 HQs | Revenue |
|---|---|---|
| Energy | 16 | $1,198B |
|
||
| Technology | 5 | $198B |
|
||
| Engineering / Construction | 4 | $72B |
|
||
| Energy Services | 3 | $60B |
|
||
| Utilities | 3 | $41B |
|
||
| Healthcare | 2 | $330B |
|
||
Price history
1 event — show timeline
- 2026-06-05 Listed $150,000 HARMLS
Cash-flow waterfall
monthlySold comps — $/sqft
last 12 mo · ≤1 miLoading sold comps…