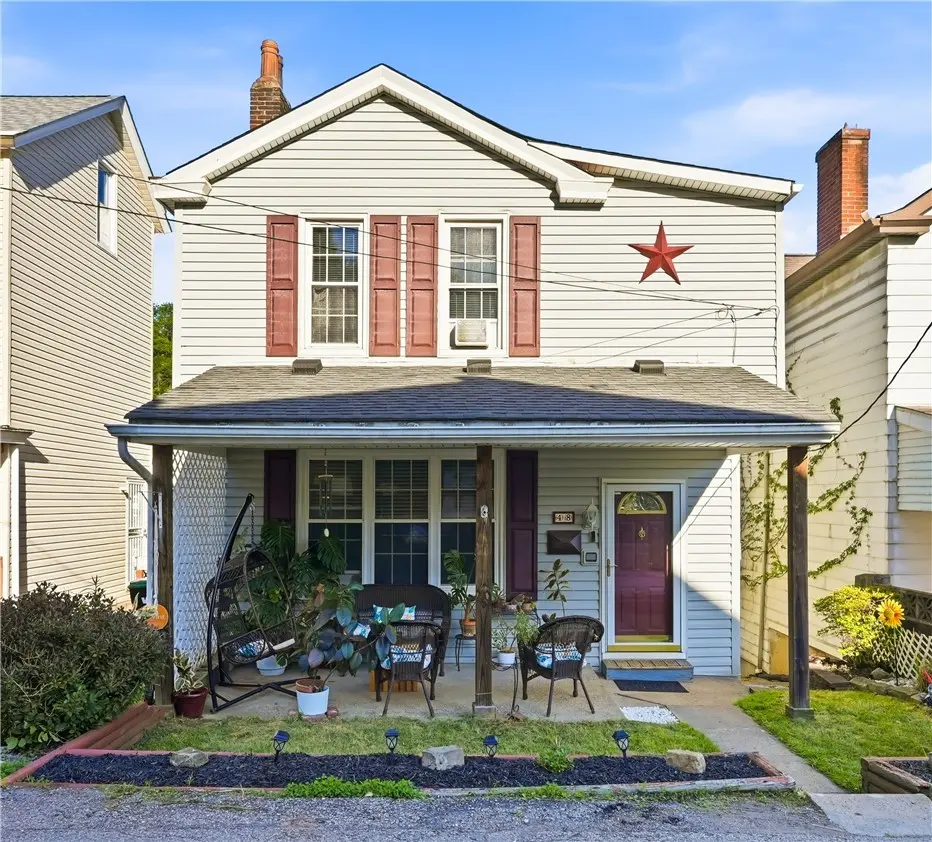
48 Angle Aly · Etna, PA
Flood risk 9/10 · Severe
- FEMA flood zone
- X (unshaded)
- Chance of flooding over 30 yrs
- 0.99%
- Est. flood insurance / yr
- $473 – $860
Fire risk 1/10 · Minimal
- Est. fire insurance / yr
- $511 – $949
Heat risk 4/10 · Minor
- Hot days now (above 98°F)
- 7 days/yr
- Hot days in 30 yrs
- 18 days/yr
Wind risk 2/10 · Minimal
- Chance of severe wind over 30 yrs
- 0.0%
Air-quality risk 4/10 · Minor
- Unhealthy air days now
- 5 days/yr
- Unhealthy air days in 30 yrs
- 7 days/yr
Risk factors via First Street. Map © Google.
Why this score? — see what drove the C+ grade
The composite is a weighted blend of 9 inputs, each scored 0–100. Each bar is that input's sub-score; the figure is the points it added to the 100-point composite (weight × sub-score).
- Cash flow +21.9/30.0
- ARV discount +15.0/15.0
- DSCR +7.0/10.0
- 1% rule +5.6/10.0
- Schools +4.1/10.0
- Livability +4.0/5.0
- Rent growth +2.5/5.0
- Condition / age +2.5/5.0
- Appreciation +0.0/10.0
$142,000
🖨 Deal sheet (PDF) 📄 Offer letter ✓ Due diligence
Listing remarks MLS
Lovely, lovingly cared for and nicely updated home in Etna Borough and award winning Shaler School District convenient to Rt 8 & Rt 28. The charming front lawn welcomes you as you enter this home that features newer carpet, updated kitchen with new back-splash. Entertain in the dining-room that is open to the kitchen featuring new gas stove and built-in microwave Upstairs you will find 3 nice sized bedrooms, the "captive" bedroom could be a huge walk-in closet, office space, or kids bedroom, your choice. The clean spacious laundry area in the basement leads to a 2 separate storage areas for all of your needs. Owner will even leave a lawn-mower for mowing the fenced-in back yard ready for a swing set or fire-pit. Don't miss this lovely home ready a new family to love it. Why rent when you can own a great family home in such a convenient location. Come by today before it's gone.
Key facts
- Covered front porch
- Hillside views
- Updated flooring
Tags
Property features AI
Finance
- HOA & community: Public transportation nearby
Exterior
- Parking: On-street parking
- Utilities: Public water; Public sewer
- Home design: 2-story frame home with vinyl siding; Asphalt roof; Resale property
- Construction: Frame construction; Vinyl siding; Asphalt roof
- Exterior features: Lot dimensions approximately 32x80x30x81
Interior
- Kitchen: Stove; Refrigerator; Microwave; Dishwasher; Some gas appliances
- Bedrooms: Bedroom (upper) 15x12; Bedroom (upper) 12x7
- Flooring: Ceramic tile; Vinyl
- Bathrooms: 1 full bathroom
- Heating & cooling: Gas hot water heating; Wall/window air conditioning units
- Interior features: Screened windows; Window treatments; Partially finished basement with walk-out access; 9 total rooms
- Laundry & utility: Washer; Dryer
Neighborhood map
What this means for you Summary
Snapshot
- This is a 3-bed/1.0-bath single-family listed at $142k.
Deal economics
- At list price, monthly cash flow is $169 ($2k/yr) — positive.
- The deal already cash-flows at list — no discount required.
- Meets the 1% rule at list price ($2k rent vs $142k).
- Recommended offer: $140k (1.5% below list) — sets the bar for market timing.
- Cap rate 8.2% vs local median 4.5% in Etna — top-decile yield for the area; either an underpriced asset or a hidden risk that comps aren't pricing in. Stress-test before assuming the spread holds.
Location & tenants
- Location reads 81/100 on livability (#172 in PA, #1,441 nationally) — a professional / high-income tenant draw. Strengths: crime A+, commute A+, cost of living A+; Watch: employment C-, amenities D, schools D-.
- Shaler Area SD (suburban): math 36% / reading 59% proficiency, ranked #208 of 539 in PA (top 39%) — families likely to look elsewhere, expect single-tenant / working-renter base with shorter leases.
- Market conditions: 23 active listings in the ZIP; 11 comparable units currently listed for rent nearby; rentals at typical pace (median 25d on market — plan ~3-4 weeks tenant-placement turnaround); 2,996 units permitted in Allegheny County in 2024 (1,588 in 5+ unit buildings).
Forward outlook
- Local home prices are declining (-3.0%/yr); year-one equity from $982 of loan paydown is wiped out by about $4k of value loss. Plan a longer hold.
Negotiation context
- It's been on market 23 days — a 2% lower offer ($140k) is reasonable based on typical stale-listing flexibility.
- 2 sale attempts since 7y ago with the ask held roughly flat each time — persistent listings suggest the price (not the market) is what's stuck; bring a comps-based counter.
- Current owner paid $119k; 19% above their basis — modest negotiation headroom, anchor on the comps not their cost.
Risks & watch-outs
- Watch-outs: flood insurance adds $56/mo; built in 1890 — expect roof / HVAC / electrical / plumbing capex.
- Climate carrying-cost: severe flood risk — expect insurance premiums to compound above CPI over the hold.
Questions for the listing agent
- Built in 1890 — when were the roof, HVAC, electrical panel, plumbing, and water heater last replaced?
- What's the actual annual flood-insurance premium (NFIP or private), and is the property in a SFHA with mandatory coverage?
- Is there a deadline driving the sale (1031 exchange, divorce, estate, relocation)? That informs how much negotiation room exists.
- Schools are D-rated, which usually means shorter tenancies and higher turnover. Who's the typical renter profile here, and what's been the actual vacancy rate?
- What's the average days-on-market for RENTAL listings here right now (not sales)? A rising rental-DOM trend means longer vacancies and softer asking-rent achievability than the comps imply.
- What's the recent tenant-quality profile in this submarket — average credit score on applications, eviction rate, late-payment / NSF rate, and stable-employment percentage? A property-management company in the area should have these aggregated.
- How much new for-sale + rental construction is in the pipeline within 1–3 miles? Heavy new supply typically softens prices + rents 12–24 months out; constrained supply supports both.
Investment metrics
- 1% rule
- 1.06% ✓
- Cap rate
- 8.19%
- Cash-on-cash
- 6.78%
- DSCR
- 1.30
- GRM
- 7.8
CMA / ARV
- ARV (on-the-fly)
- $188,622
- Comps found
- 12
Show comp detail 12 sales within ~0.75 mi
| Address | Dist | Beds/Ba | Sqft | Sold | Price | $/sf | Match |
|---|---|---|---|---|---|---|---|
| 141 Grant Ave | 0.24mi | 3/1.0 | 1,390 (-7%) | 12mo | $37,500 | $27 | 67 |
| 7 Spring Street Ext | 0.35mi | 3/2.0 | 1,384 (-8%) | 10mo | $175,000 | $126 | 59 |
| 106 Grant Ave | 0.15mi | 4/1.5 (+1) | 1,661 (+11%) | 13mo | $150,000 | $90 | 57 |
| 20 Fischer Ave | 0.32mi | 3/1.5 | 1,644 (+10%) | 14mo | $269,900 | $164 | 55 |
| 117 Grant Ave | 0.19mi | 4/2.0 (+1) | 1,680 (+12%) | 10mo | $55,000 | $33 | 54 |
| 24 High St | 0.54mi | 3/1.0 | 1,296 (-13%) | 0mo | $155,000 | $120 | 52 |
| 19 Prospect St | 0.70mi | 3/1.0 | 1,440 (-4%) | 15mo | $50,000 | $35 | 49 |
| 36 Hickory St | 0.46mi | 4/3.0 (+1) | 1,400 (-6%) | 7mo | $200,000 | $143 | 49 |
| 4 Emma Dr | 0.55mi | 2/2.0 (-1) | 1,318 (-12%) | 2mo | $271,500 | $206 | 44 |
| 24 Christler St | 0.67mi | 3/1.0 | 1,275 (-15%) | 10mo | $167,000 | $131 | 35 |
| 59 Sycamore | 0.74mi | 2/1.0 (-1) | 1,296 (-13%) | 5mo | $125,000 | $96 | 34 |
| 112 Fenway Rd | 0.63mi | 3/2.0 | 1,711 (+14%) | 12mo | $279,900 | $164 | 32 |
Match score weights: distance 35% · size 25% · config 20% · recency 20%. Top-matched comps best support the ARV.
Projected returns pro-forma
-3.0% appreciation · 3.0% rent growth · sell at horizon
- IRR
- -8.3%
- Equity multiple
- 0.69×
- Total profit
- $-12,182
- Equity at exit
- $21,173
- IRR
- 1.2%
- Equity multiple
- 1.09×
- Total profit
- $3,469
- Equity at exit
- $12,278
Cash invested: $39,760 (down + closing). Projections, not guarantees.
Landlord ↔ Tenant lean methodology
- Overall (STATE)
- 62 Landlord-Friendly
- State Pennsylvania
- 62 Landlord-Friendly · EVEN
- County
- — inherits STATE
- City
- — inherits STATE
ZIP-level market 15223
- Home prices YoY
- -28.0%
- Active inventory
- 23
- Price-to-rent
- 7.8×
Monthly cashflow live
- Estimated rent
- $1,510 high interval (Pro) →
- Mortgage (P&I)
- −$745
- Tax from tax record
- −$164 /mo · $1,970/yr
- Insurance
- −$59
- Flood insurance flood zone
- −$56 /mo · $666/yr
- HOA
- −$0
- Vacancy / Maint / Mgmt
- −$317
- Net cashflow
- $169
Break-even live
Sensitivity live
| Price | -10% $250 | -5% $209 | +0% $169 | +5% $129 | +10% $89 |
|---|---|---|---|---|---|
| Rent | -10% $50 | -5% $110 | +0% $169 | +5% $229 | +10% $289 |
| Rate | -1.0pp $241 | -0.5pp $205 | base $169 | +0.5pp $132 | +1.0pp $95 |
UW: 25.0% down · 7.5% · 30yr · 1.5% tax · 5.0% vac · 8.0% maint · 8.0% mgmt
Financing live
Cash to close
- Down payment
- $35,500
- Closing costs
- $4,260
- Reserves months
- —
- Total cash needed
- —
Loan-product check · same deal, 3 products live
Conventional
25% down · 7.5% · 30yr
- Down + closing
- —
- Monthly P&I
- —
- Monthly cashflow
- —
- DSCR
- —
- Eligible?
- —
Personal DTI + credit; lowest rate.
DSCR
20% down · 8.5% · 30yr
- Down + closing
- —
- Monthly P&I
- —
- Monthly cashflow
- —
- DSCR
- —
- Eligible?
- —
No personal income docs; deal must DSCR.
Hard money
10% down · 12.0% · 12mo
- Down + closing
- —
- Monthly P&I
- —
- Monthly cashflow
- —
- DSCR
- —
- Eligible?
- —
Short-term bridge; refi at stabilization.
Rent comps 11 comps
| Address | Beds | Baths | Sqft | Rent | $/sqft | DOM | Units | Dist |
|---|---|---|---|---|---|---|---|---|
| 621 Butler St Unit BS Pittsburgh, PA | 2.0 | 1.0 | 1000 | $995 | $0.99 | 44d | 1 | 0.16mi |
| 20 Beyrleye Ave Pittsburgh, PA | 3.0 | 2.0 | 1100 | $1,350 | $1.23 | 24d | 1 | 0.35mi |
| 14 Bethany Dr Unit A Pittsburgh, PA | 2.0 | 1.5 | 1032 | $1,650 | $1.60 | 44d | 1 | 0.53mi |
| 553 Foundry St Pittsburgh, PA | 2.0 | 2.0 | 1025 | $1,650 | $1.61 | 22d | 1 | 0.56mi |
| 39 Prospect St Pittsburgh, PA | 2.0 | 1.0 | 1056 | $1,200 | $1.14 | 8d | 1 | 0.61mi |
| 629 Glen Malcolm Dr Glenshaw, PA | 1.0–2.0 | 1.0 | 815 | $1,350 | $1.66 | 24d | 1 | 0.85mi |
| 404 Reetz St Pittsburgh, PA | 4.0 | 1.0 | 1500 | $2,050 | $1.37 | 17d | 1 | 0.91mi |
| 209 Mary St Sharpsburg, PA | 3.0 | 1.0 | 1100 | $1,395 | $1.27 | 24d | 1 | 1.33mi |
| 207 Mary St Sharpsburg, PA | 3.0 | 1.0 | 1100 | $1,395 | $1.27 | 24d | 1 | 1.33mi |
| 160 56th St Pittsburgh, PA | 3.0 | 3.0 | 1737 | $3,900 | $2.25 | 20d | 1 | 1.41mi |
| 212 Hugel Dr Unit 1 Pittsburgh, PA | 2.0 | 1.0 | 1200 | $1,450 | $1.21 | 24d | 1 | 1.44mi |
Listing history 14 events
-
2026-06-21days on market $142,000 Active 23 DOM
-
2026-06-18days on market $142,000 Active 20 DOM
-
2026-06-17days on market $142,000 Active 19 DOM
-
2026-06-16days on market $142,000 Active 18 DOM
-
2026-06-15days on market $142,000 Active 17 DOM
-
2026-06-13days on market $142,000 Active 15 DOM
-
2026-06-13pricedays on market $142,000 Active 14 DOM
-
2026-06-09days on market $147,000 Active 11 DOM
-
2026-06-08days on market $147,000 Active 10 DOM
-
2026-06-07days on market $147,000 Active 9 DOM
-
2026-06-03days on market $147,000 Active 5 DOM
-
2026-06-02days on market $147,000 Active 4 DOM
-
2026-06-01days on market $147,000 Active 3 DOM
-
2026-05-31days on market $147,000 Active 2 DOM
ⓘ Source: listings_history table (triggers on properties + properties_extension) + one-shot
backfill from property_details.listing_events for pre-trigger history.
Tax reassessment forecast PA · Partial reset (capped growth)
- Current annual tax
- $1,970 · $164/mo
- Projected year-2 tax
- $2,107 · $176/mo
- Expected delta
- +$137/yr (+$11/mo · 7.0%)
ⓘ Screening estimate from a state-policy table — verify with the county assessor before closing.
Climate risk First Street
- Flood 9/10 Extreme FEMA zone X (unshaded) · 99% chance over 30 yrs
- Wildfire 1/10 Low
- Heat 4/10 Moderate 7 d/yr ≥98°F today · 18 d/yr by 30 yrs out
- Wind 2/10 Low 0% chance of damaging wind over 30 yrs
- Air quality 4/10 Moderate 5 unhealthy d/yr today · 7 by 30 yrs out
Nearby sold comps map
Loading sold comps map…
Walkable amenities ~0.75 mi
Loading nearby amenities…
Taxation est. · year 1
- Rental income
- $18,118
- − Mortgage interest
- −$7,954
- − Property taxes
- −$1,970
- − Insurance
- −$1,376
- − Repairs & maintenance
- −$1,449
- − Management
- −$1,449
- − Depreciation
- −$4,131
- Taxable loss
- −$212
- Est. tax savings @ 24.0%
- +$51
- After-tax cash flow
- $2,082/yr
For passive investors: Depreciation is non-cash, so a rental often shows a tax loss while cash-flowing — sheltering income. Rental losses are passive: they offset passive income freely, and up to $25,000/yr can offset ordinary (W-2) income if you actively participate and your MAGI is under $100k (phasing out to $0 by $150k); unused losses carry forward. On sale, claimed depreciation is recaptured at up to 25%, and gains may owe capital-gains tax (a 1031 exchange can defer both). Figures are a year-1 estimate at your 24.0% rate — not tax advice; consult a CPA.
Schools (NCES district)
- District
- Shaler Area SD
- NCES district ID
- 4221200
- Math proficiency
- 36% ▼ -16.00%
- Reading proficiency
- 59% ▼ -15.00%
- Median HH income
- $57,411
- Composite
- 41.33/100
- National rank
- #3506
- State rank
- #208 of 539 in PA
Livability — Etna
- Score
- 81/100
- State rank
- #172
- US rank
- #1441
Category grades
Schools grade is shown separately in the Schools card above.
Census & demographics
- Census place
- Etna, PA
- County
- Allegheny County · 1,022,028 people
- City population
- 6,255
- Metro
- Pittsburgh, PA
- Population (ZIP)
- 6,255
- Household income
- $61,083
- Rent vs Own
- Severe rent burden
- 266.0
Population outlook (Allegheny County) Hauer SSP2
- Today (2025)
- 1,250,282 people
- By 2030
- 1,256,482 · +0.5%
- By 2040
- 1,256,318 · +0.5%
- By 2050
- 1,244,169 · -0.5%
- By 2075
- 1,197,693 · -4.2%
- By 2100
- 1,093,187 · -12.6%
Race, ethnicity, and origin ACS 2023
- Neighborhood character
- Predominantly White (89%)
- Race & ethnicity
- White 89% Two or more races 7% Hispanic / Latino 2% Black 2%
- Common ancestry
- Romanian 15% Lithuanian 4% Italian 4%
- Foreign-born
- 2% · Canada
- Languages at home
- 96% English-only · Russian/Polish/Slavic 2% Spanish 1%
Political lean MEDSL · Allegheny
- 2024 margin
- Strong D (+20.3) · D 59.7% · R 39.4%
- 2008→2024 swing
- +4.8pp toward D · 2008: 15.5pp · 2024: 20.3pp
- All cycles
- 2024: D+20.3 2020: D+20.4 2016: D+16.4 2012: D+14.4 2008: D+15.5
Not yet ingested
- Civics
- —
Market trends
- HPI YoY
- ▼ -98.96%
- Current HPI
- 254.2648
- Rent YoY
- —
- Metro
- Pittsburgh, PA
- State GDP YoY
- ▲ 1.68%
- F500 in state
- 34
Industry mix (Fortune 500 HQ in PA)
| Industry | F500 HQs | Revenue |
|---|---|---|
| Healthcare | 2 | $309B |
|
||
| Insurance | 2 | $27B |
|
||
| Telecommunications / Media | 1 | $124B |
|
||
| Industrial Distribution | 1 | $22B |
|
||
| Financial Services | 1 | $20B |
|
||
| Chemicals / Materials | 1 | $18B |
|
||
Price history
+352.3% since first listed7 events — show timeline
- 2026-05-29 Listed $147,000 West Penn MLS
- 2019-06-24 Sold (Public Records) $118,900 Public Records
- 2019-06-10 Sold (MLS) $118,900 West Penn MLS
- 2019-05-30 Pending — West Penn MLS
- 2019-04-29 Contingent — West Penn MLS
- 2019-04-17 Listed $120,900 West Penn MLS
- 1990-05-16 Sold (Public Records) $32,500 Public Records
Property tax history
+5.2%/yrLatest (2026): $1,970 · +0.0% YoY. Source: county tax records.
Cash-flow waterfall
monthlySold comps — $/sqft
last 12 mo · ≤1 miLoading sold comps…