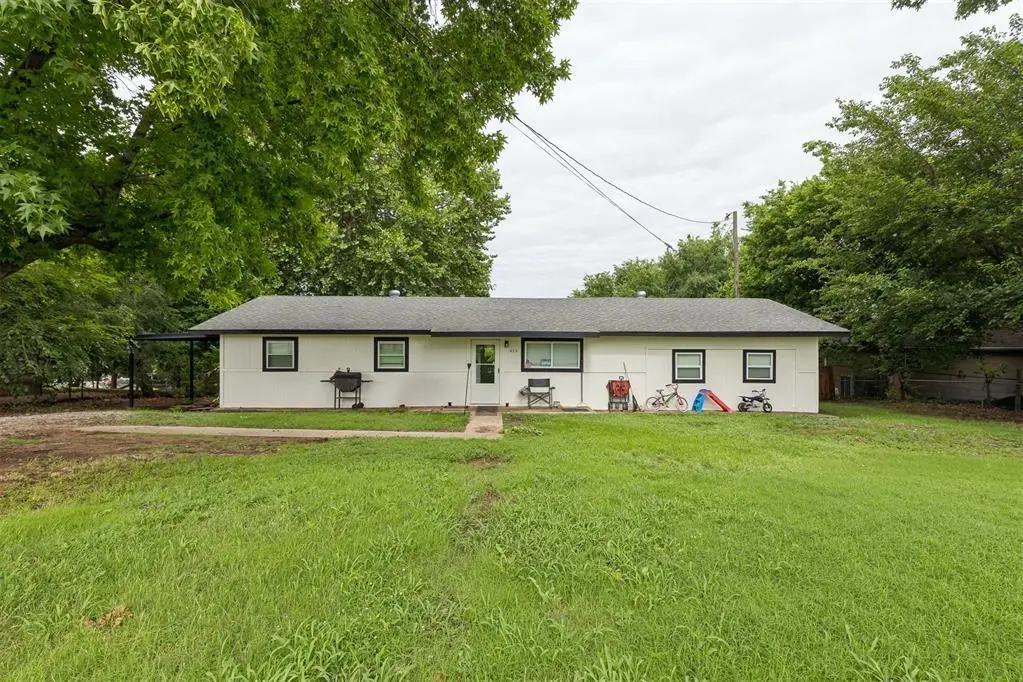
419 NE 4th St · Lexington, OK
Flood risk 1/10 · Minimal
- FEMA flood zone
- X (unshaded)
- Chance of flooding over 30 yrs
- 0.0%
- Est. flood insurance / yr
- $507 – $1,088
Fire risk 5/10 · Moderate
- Est. fire insurance / yr
- $2,463 – $4,575
Heat risk 6/10 · Moderate
- Hot days now (above 109°F)
- 7 days/yr
- Hot days in 30 yrs
- 18 days/yr
Wind risk 3/10 · Minor
- Chance of severe wind over 30 yrs
- 6.0%
Air-quality risk 1/10 · Minimal
- Unhealthy air days now
- 0 days/yr
- Unhealthy air days in 30 yrs
- 0 days/yr
Risk factors via First Street. Map © Google.
Why this score? — see what drove the D grade
The composite is a weighted blend of 9 inputs, each scored 0–100. Each bar is that input's sub-score; the figure is the points it added to the 100-point composite (weight × sub-score).
- ARV discount +11.0/15.0
- Appreciation +10.0/10.0
- Cash flow +8.9/30.0
- Livability +3.1/5.0
- DSCR +2.5/10.0
- Rent growth +2.5/5.0
- Condition / age +2.5/5.0
- 1% rule +2.4/10.0
- Schools +1.4/10.0
$180,000
🖨 Deal sheet (PDF) 📄 Offer letter ✓ Due diligence
Listing remarks MLS
Check out this updated home on 1/2 acre! It features new appliances, new windows, new paint interior and exterior, new flooring throughout, and new light fixtures. Schedule your showing today.
Key facts
- 0.48 acre lot
- Built 1977
- Listed 5 days
Property features AI
Finance
- Other: Located in Lexington area; manual geocode; Directions: From E Broadway St, turn onto NE 4th St. The property will be on your left.; Occupied; Active listing; Listed price available (not included here); Living area reported as 1,536 by assessor
- Financial info: Loan qualification possible; Not assumable
- HOA & community: No mandatory association dues; Homestead exempt
Exterior
- Home design: Single family residence; One level
- Construction: Frame construction; Composition roof; Slab foundation; Existing property
- Exterior features: Covered patio; Open deck; Open patio; Interior lot
Interior
- Bedrooms: 3 bedrooms
- Bathrooms: 2 full bathrooms
- Interior features: One living area; No fireplace
Neighborhood map
What this means for you Summary
Snapshot
- This is a 3-bed/2.0-bath single-family listed at $180k.
Deal economics
- At list price, monthly cash flow is $-144 ($-2k/yr) — negative.
- To cash-flow at today's rent, offer at most $154k (14.2% below list).
- To meet the 1% rule (rent ≥ 1% of price), the offer needs to be $133k (26.3% below list).
- Recommended offer: $133k (26.3% below list) — sets the bar for 1% rule.
Location & tenants
- Location reads 61/100 on livability (#310 in OK) — a middle-class / working-renter tenant base. Strengths: cost of living A+, crime A-, housing A-; Watch: amenities F, commute F, employment D-.
- Lexington (town): math 13% / reading 18% proficiency, ranked #214 of 270 in OK (top 79%) — low school quality limits family demand, transient renter base, plan for 1-2y turnover.
- Zoned schools: Lexington Es (math 17% / reading 22%, grade F, #479 of 845 statewide, top 63%, 473 students, 0% FRL); Lexington Ms (math 7% / reading 12%, grade F, #299 of 345 statewide, top 88%, 223 students, 0% FRL); Lexington Hs (math 17% / reading 27%, grade F, #222 of 447 statewide, top 52%, 300 students, 0% FRL) — zoned schools average 0% FRL vs 51% district-wide (51 pts lower); this property's tenant base skews higher-income than the district average.
- Market conditions: 74 active listings in the ZIP; 592 units permitted in Cleveland County in 2024 (12 in 5+ unit buildings).
Forward outlook
- In year one you build about $19k of equity ($1k loan paydown + $18k appreciation (10.0% local appreciation)).
- Cleveland County population projected at +40% by 2050 — long-run rental-demand tailwind backs the buy-and-hold thesis.
- By year 2, paydown + projected appreciation supports a ~$31k cash-out refi (75% LTV) — recoverable capital for the next deal without selling this one.
Negotiation context
- Only 5 days on market — expect competitive offers; lowballing is unlikely to land.
- 10 sale attempts since 23y ago with the ask held roughly flat each time — persistent listings suggest the price (not the market) is what's stuck; bring a comps-based counter.
- Current owner paid $150k; 20% above their basis — modest negotiation headroom, anchor on the comps not their cost.
Risks & watch-outs
- Climate carrying-cost: moderate wildfire risk; extreme-heat days projected 7→18/yr by 2055 (HVAC capex compounding) — expect insurance premiums to compound above CPI over the hold.
Questions for the listing agent
- What do current leases actually rent for vs. the listed asking? Can we see a recent rent roll and the last 12 months of T-12 income?
- Built in 1977 — when were the roof, HVAC, electrical panel, plumbing, and water heater last replaced?
- Is there a deadline driving the sale (1031 exchange, divorce, estate, relocation)? That informs how much negotiation room exists.
- Schools are F-rated, which usually means shorter tenancies and higher turnover. Who's the typical renter profile here, and what's been the actual vacancy rate?
- The area grade is low — what's the realistic commute time and amenity access for the typical tenant pool here? Any planned neighborhood developments (good or bad) we should know about?
- What's the average days-on-market for RENTAL listings here right now (not sales)? A rising rental-DOM trend means longer vacancies and softer asking-rent achievability than the comps imply.
- What's the recent tenant-quality profile in this submarket — average credit score on applications, eviction rate, late-payment / NSF rate, and stable-employment percentage? A property-management company in the area should have these aggregated.
- How much new for-sale + rental construction is in the pipeline within 1–3 miles? Heavy new supply typically softens prices + rents 12–24 months out; constrained supply supports both.
Investment metrics
- 1% rule
- 0.74% ✗
- Cap rate
- 5.33%
- Cash-on-cash
- -3.44%
- DSCR
- 0.85
- GRM
- 11.3
CMA / ARV
- ARV (on-the-fly)
- $195,072
- Comps found
- 12
Show comp detail 12 sales within ~0.75 mi
| Address | Dist | Beds/Ba | Sqft | Sold | Price | $/sf | Match |
|---|---|---|---|---|---|---|---|
| 207 SE 7th St | 0.54mi | 3/2.0 | 1,559 (+2%) | 3mo | $222,000 | $142 | 70 |
| 422 E Ash St | 0.22mi | 4/1.0 (+1) | 1,513 (-2%) | 10mo | $35,000 | $23 | 70 |
| 600 Peachtree Ln | 0.13mi | 4/3.0 (+1) | 1,663 (+8%) | 5mo | $218,000 | $131 | 67 |
| 410 E Johnson St | 0.58mi | 3/2.0 | 1,633 (+6%) | 5mo | $199,900 | $122 | 59 |
| 410 SE 7th St | 0.66mi | 3/2.0 | 1,468 (-4%) | 8mo | $200,000 | $136 | 55 |
| 304 W Beech St | 0.55mi | 3/1.0 | 1,584 (+3%) | 12mo | $160,000 | $101 | 55 |
| 210 W Center St | 0.46mi | 4/2.0 (+1) | 1,420 (-8%) | 15mo | $179,500 | $126 | 49 |
| 709 E Kennedy St | 0.65mi | 3/2.0 | 1,475 (-4%) | 17mo | $199,900 | $136 | 49 |
| 307 SE 4th St | 0.45mi | 3/1.5 | 1,356 (-12%) | 18mo | $167,000 | $123 | 42 |
| 205 SE 7th St | 0.52mi | 3/2.0 | 1,723 (+12%) | 17mo | $250,000 | $145 | 42 |
| 518 S Main St | 0.67mi | 4/2.0 (+1) | 1,450 (-6%) | 20mo | $183,500 | $127 | 37 |
| 523 SE 4th St | 0.67mi | 4/1.5 (+1) | 1,320 (-14%) | 2mo | $145,000 | $110 | 36 |
Match score weights: distance 35% · size 25% · config 20% · recency 20%. Top-matched comps best support the ARV.
Projected returns pro-forma
10.0% appreciation · 3.0% rent growth · sell at horizon
- IRR
- 21.8%
- Equity multiple
- 2.76×
- Total profit
- $88,824
- Equity at exit
- $162,158
- IRR
- 19.7%
- Equity multiple
- 6.33×
- Total profit
- $268,781
- Equity at exit
- $349,700
Cash invested: $50,400 (down + closing). Projections, not guarantees.
Landlord ↔ Tenant lean methodology
- Overall (STATE)
- 83 Strongly Landlord-Friendly
- State Oklahoma
- 83 Strongly Landlord-Friendly · R+20
- County
- — inherits STATE
- City
- — inherits STATE
ZIP-level market 73051
- Home prices YoY
- 5.5%
- Active inventory
- 74
- Price-to-rent
- 11.3×
Monthly cashflow live
- Estimated rent
- $1,326 medium interval (Pro) →
- Mortgage (P&I)
- −$944
- Tax from tax record
- −$173 /mo · $2,078/yr
- Insurance
- −$75
- HOA
- −$0
- Vacancy / Maint / Mgmt
- −$279
- Net cashflow
- $-144
Break-even live
Sensitivity live
| Price | -10% $-43 | -5% $-93 | +0% $-144 | +5% $-195 | +10% $-246 |
|---|---|---|---|---|---|
| Rent | -10% $-249 | -5% $-197 | +0% $-144 | +5% $-92 | +10% $-40 |
| Rate | -1.0pp $-54 | -0.5pp $-99 | base $-144 | +0.5pp $-191 | +1.0pp $-238 |
UW: 25.0% down · 7.5% · 30yr · 1.5% tax · 5.0% vac · 8.0% maint · 8.0% mgmt
Financing live
Cash to close
- Down payment
- $45,000
- Closing costs
- $5,400
- Reserves months
- —
- Total cash needed
- —
Loan-product check · same deal, 3 products live
Conventional
25% down · 7.5% · 30yr
- Down + closing
- —
- Monthly P&I
- —
- Monthly cashflow
- —
- DSCR
- —
- Eligible?
- —
Personal DTI + credit; lowest rate.
DSCR
20% down · 8.5% · 30yr
- Down + closing
- —
- Monthly P&I
- —
- Monthly cashflow
- —
- DSCR
- —
- Eligible?
- —
No personal income docs; deal must DSCR.
Hard money
10% down · 12.0% · 12mo
- Down + closing
- —
- Monthly P&I
- —
- Monthly cashflow
- —
- DSCR
- —
- Eligible?
- —
Short-term bridge; refi at stabilization.
Listing history 5 events
-
2026-06-21days on market $180,000 Active 5 DOM
-
2026-06-21days on market $180,000 Active 4 DOM
-
2026-06-18days on market $180,000 Active 2 DOM
-
2026-06-17remarks 625-char remark
-
2026-06-17$180,000 Active 1 DOM
ⓘ Source: listings_history table (triggers on properties + properties_extension) + one-shot
backfill from property_details.listing_events for pre-trigger history.
Tax reassessment forecast OK · Resets to sale price
- Current annual tax
- $2,078 · $173/mo
- Projected year-2 tax
- $2,078 · $173/mo
- Expected delta
- $0/yr ($0/mo · 0.0%)
ⓘ Screening estimate from a state-policy table — verify with the county assessor before closing.
Climate risk First Street
- Flood 1/10 Low FEMA zone X (unshaded) · 0% chance over 30 yrs
- Wildfire 5/10 Major
- Heat 6/10 Major 7 d/yr ≥109°F today · 18 d/yr by 30 yrs out
- Wind 3/10 Moderate 6% chance of damaging wind over 30 yrs
- Air quality 1/10 Low 0 unhealthy d/yr today · 0 by 30 yrs out
Nearby sold comps map
Loading sold comps map…
Walkable amenities ~0.75 mi
Loading nearby amenities…
Taxation est. · year 1
- Rental income
- $15,915
- − Mortgage interest
- −$10,083
- − Property taxes
- −$2,078
- − Insurance
- −$900
- − Repairs & maintenance
- −$1,273
- − Management
- −$1,273
- − Depreciation
- −$5,236
- Taxable loss
- −$4,929
- Est. tax savings @ 24.0%
- +$1,183
- After-tax cash flow
- $-550/yr
For passive investors: Depreciation is non-cash, so a rental often shows a tax loss while cash-flowing — sheltering income. Rental losses are passive: they offset passive income freely, and up to $25,000/yr can offset ordinary (W-2) income if you actively participate and your MAGI is under $100k (phasing out to $0 by $150k); unused losses carry forward. On sale, claimed depreciation is recaptured at up to 25%, and gains may owe capital-gains tax (a 1031 exchange can defer both). Figures are a year-1 estimate at your 24.0% rate — not tax advice; consult a CPA.
Schools (NCES district)
- District
- Lexington
- NCES district ID
- 4017580
- Math proficiency
- 13% ▼ -12.00%
- Reading proficiency
- 18% ▼ -5.00%
- Median HH income
- $44,923
- Composite
- 13.68/100
- National rank
- #9501
- State rank
- #214 of 270 in OK
Livability — Lexington
- Score
- 61/100
- State rank
- #310
- US rank
- #17913
Category grades
Schools grade is shown separately in the Schools card above.
Census & demographics
- Census place
- Lexington, OK
- Population (ZIP)
- 10,079
Population outlook (Cleveland County) Hauer SSP2
- Today (2025)
- 323,621 people
- By 2030
- 349,070 · +7.9%
- By 2040
- 400,168 · +23.7%
- By 2050
- 454,101 · +40.3%
- By 2075
- 602,926 · +86.3%
- By 2100
- 734,485 · +127.0%
Race, ethnicity, and origin ACS 2023
- Neighborhood character
- Predominantly White (67%)
- Race & ethnicity
- White 67% Two or more races 13% Hispanic / Latino 9% Native American 8% Black 7%
- Hispanic origin (detail)
- Mexican 7%
- Common ancestry
- Portuguese 2% Italian 2% Lithuanian 1%
- Foreign-born
- 4% · Canada, China
- Languages at home
- 93% English-only · Spanish 6%
Political lean MEDSL · Cleveland
- 2024 margin
- R (+14.9) · D 41.4% · R 56.4% · Other 2.2%
- 2008→2024 swing
- +9.1pp toward D · 2008: -24.0pp · 2024: -14.9pp
- All cycles
- 2024: R+14.9 2020: R+14.1 2016: R+21.7 2012: R+25.9 2008: R+24.0
Not yet ingested
- Civics
- —
Market trends
- HPI YoY
- ▲ 15.58%
- Current HPI
- 298.2589
- Rent YoY
- —
- Metro
- —
- State GDP YoY
- ▲ 1.55%
- F500 in state
- 6
Industry mix (Fortune 500 HQ in OK)
| Industry | F500 HQs | Revenue |
|---|---|---|
| Energy | 3 | $48B |
|
||
Price history
+176.9% since first listed38 events — show timeline
- 2026-06-16 Listed $180,000 MLSOK
- 2024-10-24 Listing Removed — MLSOK
- 2024-09-17 Price Changed $169,900 MLSOK
- 2024-09-03 Listed $174,900 MLSOK
- 2022-06-28 Sold (Public Records) $150,000 Public Records
- 2022-06-24 Sold (MLS) $150,000 MLSOK
- 2022-05-08 Pending — MLSOK
- 2022-05-05 Listed $139,000 MLSOK
- 2020-03-06 Sold (Public Records) $58,000 Public Records
- 2020-03-04 Sold (MLS) $58,000 MLSOK
- 2020-02-04 Pending — MLSOK
- 2020-01-28 Price Changed $72,000 MLSOK
- 2020-01-23 Price Changed $73,000 MLSOK
- 2020-01-19 Price Changed $78,000 MLSOK
- 2020-01-12 Price Changed $82,000 MLSOK
- 2020-01-06 Price Changed $85,000 MLSOK
- 2020-01-04 Listed $88,000 MLSOK
- 2019-12-20 Listing Removed — MLSOK
- 2019-11-25 Price Changed $115,000 MLSOK
- 2019-11-09 Price Changed $120,000 MLSOK
- 2019-11-04 Listed $130,000 MLSOK
- 2016-10-18 Sold (MLS) $51,500 MLSOK
- 2016-10-06 Pending — MLSOK
- 2016-09-28 Price Changed $55,000 MLSOK
- 2016-09-23 Relisted — MLSOK
- 2016-08-30 Pending — MLSOK
- 2016-08-12 Price Changed $59,900 MLSOK
- 2016-08-11 Price Changed $54,900 MLSOK
- 2016-07-29 Relisted — MLSOK
- 2016-07-17 Listing Removed — MLSOK
- 2016-07-06 Price Changed $64,900 MLSOK
- 2016-06-21 Relisted — MLSOK
- 2016-06-05 Pending — MLSOK
- 2016-05-03 Price Changed $69,900 MLSOK
- 2016-04-01 Listed $74,900 MLSOK
- 2004-09-17 Sold (Public Records) $62,000 Public Records
- 2003-08-27 Listing Removed — MLSOK
- 2003-08-27 Listed $65,000 MLSOK
Property tax history
+8.7%/yrLatest (2024): $2,078 · +12.0% YoY. Source: county tax records.
Cash-flow waterfall
monthlySold comps — $/sqft
last 12 mo · ≤1 miLoading sold comps…