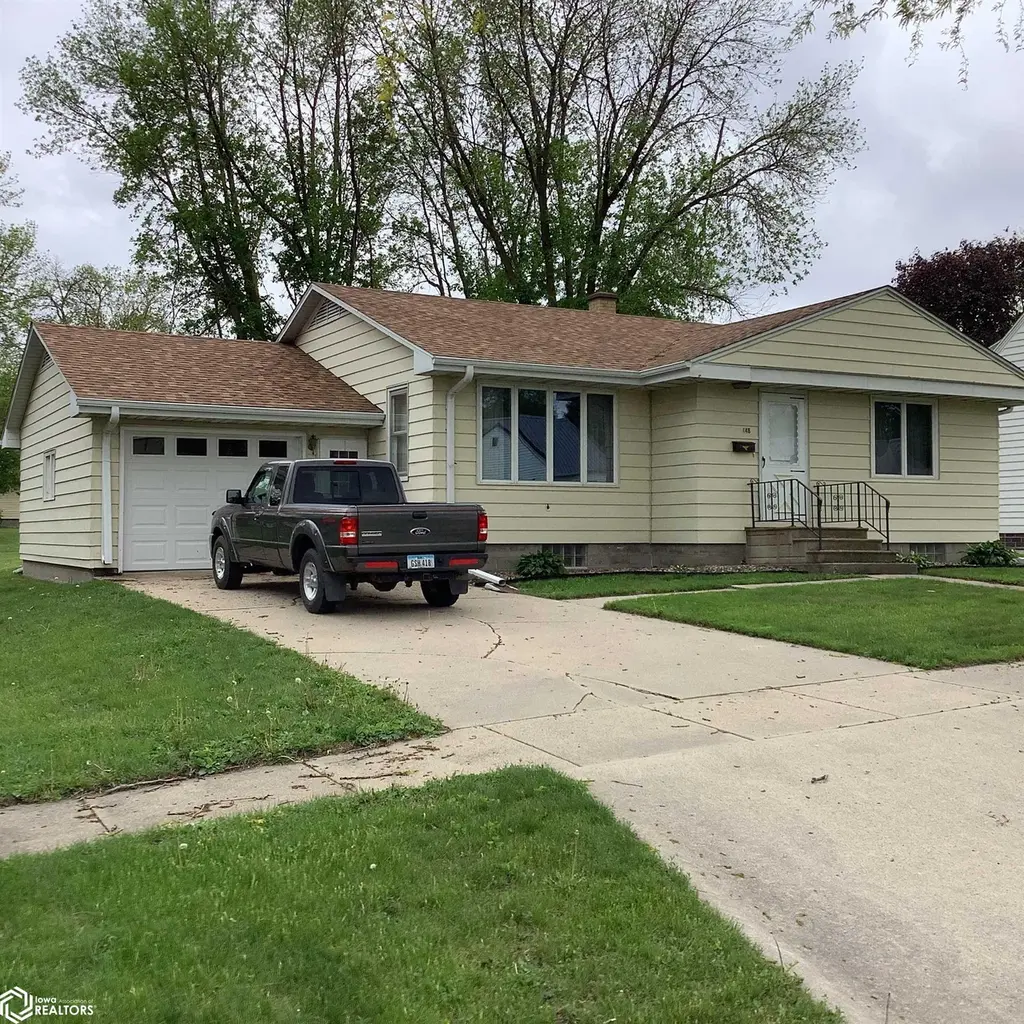
148 NE 3rd Ave · Titonka, IA
Flood risk 4/10 · Minor
- FEMA flood zone
- X (unshaded)
- Chance of flooding over 30 yrs
- 0.22%
- Est. flood insurance / yr
- $473 – $860
Fire risk 1/10 · Minimal
- Est. fire insurance / yr
- $902 – $1,676
Heat risk 2/10 · Minimal
- Hot days now (above 99°F)
- 7 days/yr
- Hot days in 30 yrs
- 16 days/yr
Wind risk 2/10 · Minimal
- Chance of severe wind over 30 yrs
- —
Air-quality risk 1/10 · Minimal
- Unhealthy air days now
- 0 days/yr
- Unhealthy air days in 30 yrs
- 0 days/yr
Risk factors via First Street. Map © Google.
Why this score? — see what drove the C grade
The composite is a weighted blend of 9 inputs, each scored 0–100. Each bar is that input's sub-score; the figure is the points it added to the 100-point composite (weight × sub-score).
- Cash flow +18.4/30.0
- Appreciation +8.4/10.0
- DSCR +5.8/10.0
- Schools +5.7/10.0
- ARV discount +5.2/15.0
- 1% rule +4.1/10.0
- Livability +3.2/5.0
- Rent growth +2.5/5.0
- Condition / age +2.5/5.0
$105,000
🖨 Deal sheet 📄 Offer letter ✓ Due diligence
Listing remarks
Cozy and neat 2 bedroom ranch style home that is move in ready. The main floor consists of the kitchen with appliances and eating area, spacious living room, 2 nice bedrooms and a full bathroom. The laundry and an additional half bath are located in the basement. Other nice features of this home include steel siding, new roof in 2023, a quiet neighborhood and low maintenance. Outside concrete patio in the back. 12 x 12 portable shed included. Single attached garage with nice curb appeal.
Key facts
- Full bathroom
- Laundry in basement
- New roof
Tags
Property features AI
Exterior
- Parking: Attached 1-car garage
- Utilities: Public water; Public sewer
- Home design: Residential single-family home
- Construction: Metal siding
- Exterior features: Shingle roof
Interior
- Kitchen: Range; Cooktop; Microwave; Refrigerator
- Bathrooms: 1 full bathroom; 1 half bathroom
- Heating & cooling: Central air conditioning; Forced air heating
- Interior features: Range; Cooktop; Microwave; Refrigerator; Basement
Neighborhood map
What this means for you Summary
Snapshot
- This is a 2-bed/1.5-bath single-family listed at $105k.
Deal economics
- At list price, monthly cash flow is $99 ($1k/yr) — positive.
- The deal already cash-flows at list — no discount required.
- To meet the 1% rule (rent ≥ 1% of price), the offer needs to be $95k (9.1% below list).
- Recommended offer: $95k (9.1% below list) — sets the bar for 1% rule.
Location & tenants
- Location reads 64/100 on livability (#597 in IA) — a middle-class / working-renter tenant base. Strengths: cost of living A+, housing A+; Watch: health & safety C-, schools F, amenities F.
- Algona Community School District (town): math 65% / reading 70% proficiency, ranked #170 of 289 in IA (top 59%) — acceptable for families but not a draw, mixed tenant base, ~2y average lease.
- Market conditions: 6 active listings in the ZIP; 15 units permitted in Kossuth County in 2024 (0 in 5+ unit buildings).
Forward outlook
- In year one you build about $8k of equity ($726 loan paydown + $7k appreciation (6.8% local appreciation)).
- Kossuth County population projected to shrink 6% by 2050 — rents likely to lag national; underwrite the cash flow, not the appreciation.
- At projected returns (6.8% appreciation + 3.0% rent growth), your $29k cash investment doubles in ~3 years — after that, you're playing with house money.
- By year 5, paydown + projected appreciation supports a ~$35k cash-out refi (75% LTV) — recoverable capital for the next deal without selling this one.
Negotiation context
- It's been on market 29 days — a 2% lower offer ($103k) is reasonable based on typical stale-listing flexibility.
- Current owner paid $28k; list at $105k implies a 282% gain — meaningful room to come down on a strong offer.
Risks & watch-outs
- Watch-outs: built in 1959 — expect roof / HVAC / electrical / plumbing capex.
Questions for the listing agent
- Built in 1959 — when were the roof, HVAC, electrical panel, plumbing, and water heater last replaced?
- Is there a deadline driving the sale (1031 exchange, divorce, estate, relocation)? That informs how much negotiation room exists.
- Schools are F-rated, which usually means shorter tenancies and higher turnover. Who's the typical renter profile here, and what's been the actual vacancy rate?
- What's the average days-on-market for RENTAL listings here right now (not sales)? A rising rental-DOM trend means longer vacancies and softer asking-rent achievability than the comps imply.
- What's the recent tenant-quality profile in this submarket — average credit score on applications, eviction rate, late-payment / NSF rate, and stable-employment percentage? A property-management company in the area should have these aggregated.
- How much new for-sale + rental construction is in the pipeline within 1–3 miles? Heavy new supply typically softens prices + rents 12–24 months out; constrained supply supports both.
Investment metrics
- 1% rule
- 0.91% ✗
- Cap rate
- 7.42%
- Cash-on-cash
- 4.03%
- DSCR
- 1.18
- GRM
- 9.2
CMA / ARV
- ARV (on-the-fly)
- $99,840
- Comps found
- 4
Show comp detail 4 sales within ~0.75 mi
| Address | Dist | Beds/Ba | Sqft | Sold | Price | $/sf | Match |
|---|---|---|---|---|---|---|---|
| 35 5th Ave NE | 0.18mi | 3/1.0 (+1) | 1,056 (+2%) | 5mo | $75,000 | $71 | 78 |
| 224 Buffalo St SW | 0.36mi | 2/1.0 | 1,040 (0%) | 10mo | $100,000 | $96 | 72 |
| 223 State St | 0.32mi | 3/1.0 (+1) | 1,064 (+2%) | 9mo | $123,500 | $116 | 67 |
| 011 Giesking St | 0.21mi | 3/1.5 (+1) | 1,196 (+15%) | 15mo | $84,900 | $71 | 48 |
Match score weights: distance 35% · size 25% · config 20% · recency 20%. Top-matched comps best support the ARV.
Projected returns pro-forma
6.81% appreciation · 3.0% rent growth · sell at horizon
- IRR
- 20.5%
- Equity multiple
- 2.42×
- Total profit
- $41,714
- Equity at exit
- $71,473
- IRR
- 19.3%
- Equity multiple
- 4.97×
- Total profit
- $116,621
- Equity at exit
- $134,614
Cash invested: $29,400 (down + closing). Projections, not guarantees.
Landlord ↔ Tenant lean methodology
- Overall (STATE)
- 83 Strongly Landlord-Friendly
- State Iowa
- 83 Strongly Landlord-Friendly · R+6
- County
- — inherits STATE
- City
- — inherits STATE
ZIP-level market 50480
- Home prices YoY
- 6.0%
- Active inventory
- 6
- Price-to-rent
- 9.2×
Monthly cashflow live
- Estimated rent
- $954 medium interval (Pro) →
- Mortgage (P&I)
- −$551
- Tax from tax record
- −$61 /mo · $730/yr
- Insurance
- −$44
- HOA
- −$0
- Vacancy / Maint / Mgmt
- −$200
- Net cashflow
- $99
Break-even live
UW: 25.0% down · 7.5% · 30yr · 1.5% tax · 5.0% vac · 8.0% maint · 8.0% mgmt
Financing live
Cash to close
- Down payment
- $26,250
- Closing costs
- $3,150
- Reserves months
- —
- Total cash needed
- —
Loan-product check · same deal, 3 products live
Conventional
25% down · 7.5% · 30yr
- Down + closing
- —
- Monthly P&I
- —
- Monthly cashflow
- —
- DSCR
- —
- Eligible?
- —
Personal DTI + credit; lowest rate.
DSCR
20% down · 8.5% · 30yr
- Down + closing
- —
- Monthly P&I
- —
- Monthly cashflow
- —
- DSCR
- —
- Eligible?
- —
No personal income docs; deal must DSCR.
Hard money
10% down · 12.0% · 12mo
- Down + closing
- —
- Monthly P&I
- —
- Monthly cashflow
- —
- DSCR
- —
- Eligible?
- —
Short-term bridge; refi at stabilization.
Listing history 18 events
-
2026-06-18days on market $105,000 Active 29 DOM
-
2026-06-17days on market $105,000 Active 28 DOM
-
2026-06-16days on market $105,000 Active 27 DOM
-
2026-06-16price $105,000 Active 26 DOM
-
2026-06-15days on market $124,900 Active 26 DOM
-
2026-06-13days on market $124,900 Active 24 DOM
-
2026-06-12days on market $124,900 Active 23 DOM
-
2026-06-09days on market $124,900 Active 20 DOM
-
2026-06-08days on market $124,900 Active 19 DOM
-
2026-06-07days on market $124,900 Active 18 DOM
-
2026-06-07days on market $124,900 Active 17 DOM
-
2026-06-04days on market $124,900 Active 14 DOM
-
2026-06-02days on market $124,900 Active 13 DOM
-
2026-06-01days on market $124,900 Active 12 DOM
-
2026-05-31days on market $124,900 Active 11 DOM
-
2026-05-31days on market $124,900 Active 10 DOM
-
2026-05-20$124,900 Active
-
2013-07-18soldstatus $27,500
ⓘ Source: listings_history table (triggers on properties + properties_extension) + one-shot
backfill from property_details.listing_events for pre-trigger history.
Tax reassessment forecast IA · Partial reset (capped growth)
- Current annual tax
- $730 · $61/mo
- Projected year-2 tax
- $1,189 · $99/mo
- Expected delta
- +$459/yr (+$38/mo · 62.9%)
ⓘ Screening estimate from a state-policy table — verify with the county assessor before closing.
Climate risk First Street
- Flood 4/10 Moderate FEMA zone X (unshaded) · 22% chance over 30 yrs
- Wildfire 1/10 Low
- Heat 2/10 Low 7 d/yr ≥99°F today · 16 d/yr by 30 yrs out
- Wind 2/10 Low
- Air quality 1/10 Low 0 unhealthy d/yr today · 0 by 30 yrs out
Nearby sold comps map
Loading sold comps map…
Walkable amenities ~0.75 mi
Loading nearby amenities…
Taxation est. · year 1
- Rental income
- $11,453
- − Mortgage interest
- −$5,882
- − Property taxes
- −$730
- − Insurance
- −$525
- − Repairs & maintenance
- −$916
- − Management
- −$916
- − Depreciation
- −$3,055
- Taxable loss
- −$571
- Est. tax savings @ 24.0%
- +$137
- After-tax cash flow
- $1,322/yr
For passive investors: Depreciation is non-cash, so a rental often shows a tax loss while cash-flowing — sheltering income. Rental losses are passive: they offset passive income freely, and up to $25,000/yr can offset ordinary (W-2) income if you actively participate and your MAGI is under $100k (phasing out to $0 by $150k); unused losses carry forward. On sale, claimed depreciation is recaptured at up to 25%, and gains may owe capital-gains tax (a 1031 exchange can defer both). Figures are a year-1 estimate at your 24.0% rate — not tax advice; consult a CPA.
Schools (NCES district)
- District
- Algona Community School District
- NCES district ID
- 1903360
- Math proficiency
- 65% ▼ -8.00%
- Reading proficiency
- 70% ▼ -7.00%
- Median HH income
- $51,369
- Composite
- 57.41/100
- National rank
- #1076
- State rank
- #170 of 289 in IA
Livability — Titonka
- Score
- 64/100
- State rank
- #597
- US rank
- #13618
Category grades
Schools grade is shown separately in the Schools card above.
Census & demographics
- Census place
- Titonka, IA
- Population (ZIP)
- 926
Population outlook (Kossuth County) Hauer SSP2
- Today (2025)
- 14,667 people
- By 2030
- 14,445 · -1.5%
- By 2040
- 14,093 · -3.9%
- By 2050
- 13,825 · -5.7%
- By 2075
- 14,039 · -4.3%
- By 2100
- 13,662 · -6.9%
Race, ethnicity, and origin ACS 2023
- Neighborhood character
- Predominantly White (97%)
- Race & ethnicity
- White 97% Black 2% Hispanic / Latino 1% Two or more races 1%
- Common ancestry
- Portuguese 6% Iranian 2% Lithuanian 2%
- Foreign-born
- 1% · Canada
- Languages at home
- 99% English-only · Spanish 1%
Political lean MEDSL · Kossuth
- 2024 margin
- Solid R (+44.2) · D 27.3% · R 71.4% · Other 1.3%
- 2008→2024 swing
- -47.4pp toward R · 2008: 3.2pp · 2024: -44.2pp
- All cycles
- 2024: R+44.2 2020: R+39.4 2016: R+36.5 2012: R+12.3 2008: D+3.2
Not yet ingested
- Civics
- —
Market trends
- HPI YoY
- ▲ 6.81%
- Current HPI
- 119.7268
- Rent YoY
- —
- Metro
- —
- State GDP YoY
- ▲ 2.48%
- F500 in state
- 4
Industry mix (Fortune 500 HQ in IA)
| Industry | F500 HQs | Revenue |
|---|---|---|
| Financial Services | 1 | $16B |
|
||
| Retail / Convenience | 1 | $15B |
|
||
Price history
+354.2% since first listed2 events — show timeline
- 2026-05-20 Listed $124,900 IAR
- 2013-07-18 Sold (Public Records) $27,500 Public Records
Property tax history
+0.3%/yrLatest (2025): $730 · -2.7% YoY. Source: county tax records.
Cash-flow waterfall
monthlySold comps — $/sqft
last 12 mo · ≤1 miLoading sold comps…