19084 Oliver Ln · Onyx, CA
Flood risk 1/10 · Minimal
- FEMA flood zone
- X (unshaded)
- Chance of flooding over 30 yrs
- 0.0%
- Est. flood insurance / yr
- $507 – $1,088
Fire risk 7/10 · Major
- Est. fire insurance / yr
- $659 – $1,223
Heat risk 7/10 · Major
- Hot days now (above 96°F)
- 9 days/yr
- Hot days in 30 yrs
- 24 days/yr
Wind risk 1/10 · Minimal
- Chance of severe wind over 30 yrs
- —
Air-quality risk 7/10 · Major
- Unhealthy air days now
- 15 days/yr
- Unhealthy air days in 30 yrs
- 17 days/yr
Risk factors via First Street. Map © Google.
Why this score? — see what drove the C+ grade
The composite is a weighted blend of 9 inputs, each scored 0–100. Each bar is that input's sub-score; the figure is the points it added to the 100-point composite (weight × sub-score).
- Cash flow +23.5/30.0
- Appreciation +8.4/10.0
- DSCR +7.5/10.0
- ARV discount +7.5/15.0
- 1% rule +5.1/10.0
- Schools +2.9/10.0
- Rent growth +2.5/5.0
- Livability +2.5/5.0
- Condition / age +2.5/5.0
$110,000
🖨 Deal sheet (PDF) 📄 Offer letter ✓ Due diligence
Listing remarks MLS
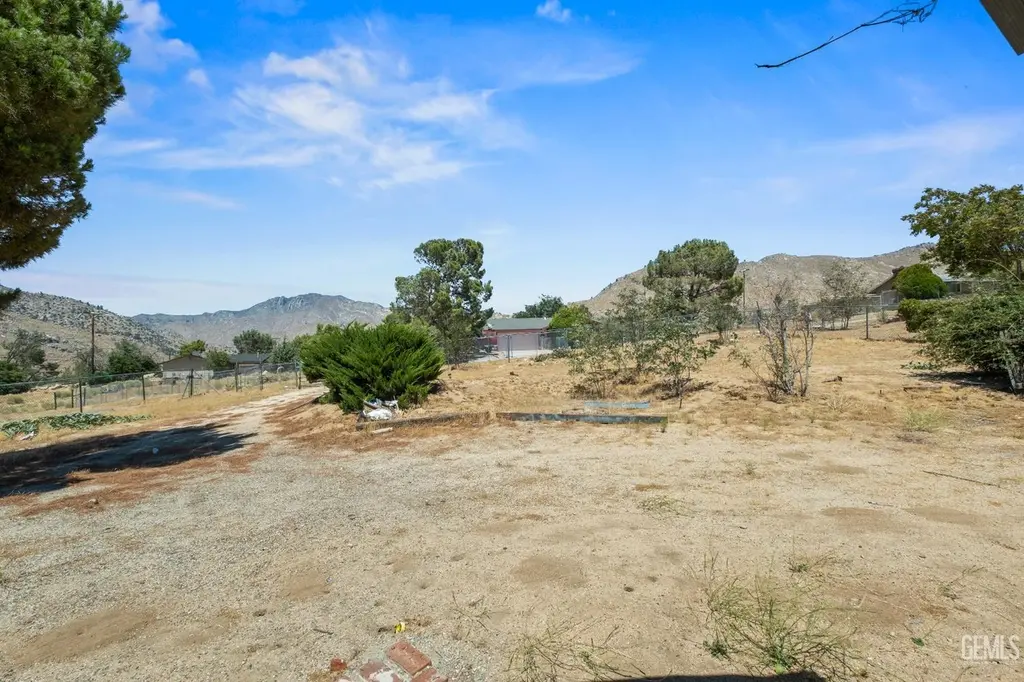
If you've have been searching for peace, space and unforgettable Mountain Views this is it. Perfect for anyone who loves nature. Fresh air, and the beauty of Lake Isabella just minutes away.
Key facts
- Lake isabella
- Mountain views
- 0.28 acre lot
Tags
Neighborhood map
What this means for you Summary
Snapshot
- This is a 2-bed/1.0-bath manufactured listed at $110k.
Deal economics
- At list price, monthly cash flow is $205 ($2k/yr) — positive.
- The deal already cash-flows at list — no discount required.
- Meets the 1% rule at list price ($1k rent vs $110k).
- Recommended offer: $97k (12.0% below list) — sets the bar for market timing.
Location & tenants
- Location reads 50/100 on livability (#1,132 in CA) — a working-class tenant base; expect higher turnover. Strengths: housing A, cost of living B; Watch: employment C-, crime F, amenities F.
- South Fork Union (rural): math 25% / reading 40% proficiency, ranked #1,016 of 1,400 in CA (top 73%) — families likely to look elsewhere, expect single-tenant / working-renter base with shorter leases; 67% free/reduced lunch — lower-income household profile, screen leases tightly.
- Zoned schools: South Fork Elementary (344 students, 71% FRL); Kern Valley High (reading 75%, 466 students, 72% FRL) — zoned schools at 71% FRL track the district average.
- Market conditions: 32 active listings in the ZIP; 3,244 units permitted in Kern County in 2024 (73 in 5+ unit buildings).
Forward outlook
- In year one you build about $8k of equity ($761 loan paydown + $7k appreciation (6.7% local appreciation)).
- Kern County population projected at +17% by 2050 — long-run rental-demand tailwind backs the buy-and-hold thesis.
- At projected returns (6.7% appreciation + 3.0% rent growth), your $31k cash investment doubles in ~3 years — after that, you're playing with house money.
- By year 5, paydown + projected appreciation supports a ~$36k cash-out refi (75% LTV) — recoverable capital for the next deal without selling this one.
Negotiation context
- It's been on market 283 days — a 12% lower offer ($97k) is reasonable based on typical stale-listing flexibility.
- 2 sale attempts since 4y ago; this cycle's ask has dropped $10k (8%) from the opening price — seller is motivated, your offer sets the floor, not the list.
Risks & watch-outs
- Climate carrying-cost: major wildfire risk; extreme-heat days projected 9→24/yr by 2055 (HVAC capex compounding) — expect insurance premiums to compound above CPI over the hold.
Questions for the listing agent
- It's been on market 283 days. Have you received any prior offers? Is the seller open to a 12% concession, seller financing, or rate buy-down credit?
- Built in 1972 — when were the roof, HVAC, electrical panel, plumbing, and water heater last replaced?
- Why hasn't it sold? Are there any deal-killer items the seller is aware of (foundation, flood, title, zoning, code violations)?
- Is there a deadline driving the sale (1031 exchange, divorce, estate, relocation)? That informs how much negotiation room exists.
- Schools are D-rated, which usually means shorter tenancies and higher turnover. Who's the typical renter profile here, and what's been the actual vacancy rate?
- Crime grade is F in this area — have there been break-ins, vandalism, or insurance claims at this property in the last 3 years? What carrier currently insures it and at what premium?
- What's the average days-on-market for RENTAL listings here right now (not sales)? A rising rental-DOM trend means longer vacancies and softer asking-rent achievability than the comps imply.
- What's the recent tenant-quality profile in this submarket — average credit score on applications, eviction rate, late-payment / NSF rate, and stable-employment percentage? A property-management company in the area should have these aggregated.
- How much new for-sale + rental construction is in the pipeline within 1–3 miles? Heavy new supply typically softens prices + rents 12–24 months out; constrained supply supports both.
Investment metrics
- 1% rule
- 1.01% ✓
- Cap rate
- 8.53%
- Cash-on-cash
- 7.98%
- DSCR
- 1.35
- GRM
- 8.3
CMA / ARV
No comps found within radius.
Projected returns pro-forma
6.73% appreciation · 3.0% rent growth · sell at horizon
- IRR
- 23.5%
- Equity multiple
- 2.61×
- Total profit
- $49,596
- Equity at exit
- $74,292
- IRR
- 21.9%
- Equity multiple
- 5.37×
- Total profit
- $134,540
- Equity at exit
- $139,402
Cash invested: $30,800 (down + closing). Projections, not guarantees.
Landlord ↔ Tenant lean methodology
- Overall (STATE)
- 18 Strongly Tenant-Friendly
- State California
- 18 Strongly Tenant-Friendly · D+13
- County
- — inherits STATE
- City
- — inherits STATE
ZIP-level market 93255
- Home prices YoY
- 1.2%
- Active inventory
- 32
- Price-to-rent
- 8.3×
Monthly cashflow live
- Estimated rent
- $1,109 medium interval (Pro) →
- Mortgage (P&I)
- −$577
- Tax from tax record
- −$49 /mo · $585/yr
- Insurance
- −$46
- HOA
- −$0
- Lot rent leased land?
- −$0
- Vacancy / Maint / Mgmt
- −$233
- Net cashflow
- $205
Break-even live
Sensitivity live
| Price | -10% $267 | -5% $236 | +0% $205 | +5% $174 | +10% $143 |
|---|---|---|---|---|---|
| Rent | -10% $117 | -5% $161 | +0% $205 | +5% $249 | +10% $292 |
| Rate | -1.0pp $260 | -0.5pp $233 | base $205 | +0.5pp $176 | +1.0pp $147 |
UW: 25.0% down · 7.5% · 30yr · 1.5% tax · 5.0% vac · 8.0% maint · 8.0% mgmt
Financing live
Cash to close
- Down payment
- $27,500
- Closing costs
- $3,300
- Reserves months
- —
- Total cash needed
- —
Loan-product check · same deal, 3 products live
Conventional
25% down · 7.5% · 30yr
- Down + closing
- —
- Monthly P&I
- —
- Monthly cashflow
- —
- DSCR
- —
- Eligible?
- —
Personal DTI + credit; lowest rate.
DSCR
20% down · 8.5% · 30yr
- Down + closing
- —
- Monthly P&I
- —
- Monthly cashflow
- —
- DSCR
- —
- Eligible?
- —
No personal income docs; deal must DSCR.
Hard money
10% down · 12.0% · 12mo
- Down + closing
- —
- Monthly P&I
- —
- Monthly cashflow
- —
- DSCR
- —
- Eligible?
- —
Short-term bridge; refi at stabilization.
Listing history 27 events
-
2026-06-22days on market $110,000 Active 283 DOM
-
2026-06-21days on market $110,000 Active 282 DOM
-
2026-06-19days on market $110,000 Active 280 DOM
-
2026-06-18days on market $110,000 Active 279 DOM
-
2026-06-17days on market $110,000 Active 278 DOM
-
2026-06-16days on market $110,000 Active 277 DOM
-
2026-06-15days on market $110,000 Active 276 DOM
-
2026-06-14days on market $110,000 Active 274 DOM
-
2026-06-12days on market $110,000 Active 273 DOM
-
2026-06-10days on market $110,000 Active 271 DOM
-
2026-06-09days on market $110,000 Active 270 DOM
-
2026-06-08days on market $110,000 Active 269 DOM
-
2026-06-07days on market $110,000 Active 268 DOM
-
2026-06-05days on market $110,000 Active 266 DOM
-
2026-06-05days on market $110,000 Active 265 DOM
-
2026-06-03days on market $110,000 Active 264 DOM
-
2026-06-02days on market $110,000 Active 263 DOM
-
2026-06-01days on market $110,000 Active 262 DOM
-
2026-05-31days on market $110,000 Active 261 DOM
-
2026-05-01price $110,000 190-char remark
Show marketing remark (190 chars)
If you've have been searching for peace, space and unforgettable Mountain Views this is it. Perfect for anyone who loves nature. Fresh air, and the beauty of Lake Isabella just minutes away.
-
2026-03-23price $95,000 190-char remark
Show marketing remark (190 chars)
If you've have been searching for peace, space and unforgettable Mountain Views this is it. Perfect for anyone who loves nature. Fresh air, and the beauty of Lake Isabella just minutes away.
-
2025-10-11price $110,000 190-char remark
Show marketing remark (190 chars)
If you've have been searching for peace, space and unforgettable Mountain Views this is it. Perfect for anyone who loves nature. Fresh air, and the beauty of Lake Isabella just minutes away.
-
2025-08-04$120,000 Active 190-char remark
Show marketing remark (190 chars)
If you've have been searching for peace, space and unforgettable Mountain Views this is it. Perfect for anyone who loves nature. Fresh air, and the beauty of Lake Isabella just minutes away.
-
2022-08-21historical
-
2022-06-07status Pending Sale
-
2022-05-02historical Active Under Contract
-
2022-03-30$39,600 Active
ⓘ Source: listings_history table (triggers on properties + properties_extension) + one-shot
backfill from property_details.listing_events for pre-trigger history.
Tax reassessment forecast CA · Resets to sale price
- Current annual tax
- $585 · $49/mo
- Projected year-2 tax
- $836 · $70/mo
- Expected delta
- +$251/yr (+$21/mo · 42.8%)
ⓘ Screening estimate from a state-policy table — verify with the county assessor before closing.
Climate risk First Street
- Flood 1/10 Low FEMA zone X (unshaded) · 0% chance over 30 yrs
- Wildfire 7/10 Severe
- Heat 7/10 Severe 9 d/yr ≥96°F today · 24 d/yr by 30 yrs out
- Wind 1/10 Low
- Air quality 7/10 Severe 15 unhealthy d/yr today · 17 by 30 yrs out
Nearby sold comps map
Loading sold comps map…
Walkable amenities ~0.75 mi
Loading nearby amenities…
Taxation est. · year 1
- Rental income
- $13,310
- − Mortgage interest
- −$6,162
- − Property taxes
- −$585
- − Insurance
- −$550
- − Repairs & maintenance
- −$1,065
- − Management
- −$1,065
- − Depreciation
- −$3,200
- Taxable income
- $683
- Est. tax owed @ 24.0%
- −$164
- After-tax cash flow
- $2,293/yr
For passive investors: Depreciation is non-cash, so a rental often shows a tax loss while cash-flowing — sheltering income. Rental losses are passive: they offset passive income freely, and up to $25,000/yr can offset ordinary (W-2) income if you actively participate and your MAGI is under $100k (phasing out to $0 by $150k); unused losses carry forward. On sale, claimed depreciation is recaptured at up to 25%, and gains may owe capital-gains tax (a 1031 exchange can defer both). Figures are a year-1 estimate at your 24.0% rate — not tax advice; consult a CPA.
Schools (NCES district)
- District
- South Fork Union
- NCES district ID
- 0637470
- Math proficiency
- 25% ▲ 5.00%
- Reading proficiency
- 40% ▲ 5.00%
- Median HH income
- $32,532
- Composite
- 29.31/100
- National rank
- #11836
- State rank
- #1016 of 1400 in CA
Livability — Onyx
- Score
- 50/100
- State rank
- #1132
- US rank
- #25709
Category grades
Schools grade is shown separately in the Schools card above.
Census & demographics
- Census place
- Onyx, CA
- Population (ZIP)
- 739
Population outlook (Kern County) Hauer SSP2
- Today (2025)
- 947,286 people
- By 2030
- 978,984 · +3.3%
- By 2040
- 1,045,018 · +10.3%
- By 2050
- 1,105,232 · +16.7%
- By 2075
- 1,229,538 · +29.8%
- By 2100
- 1,238,059 · +30.7%
Race, ethnicity, and origin ACS 2023
- Neighborhood character
- Diverse neighborhood (Simpson 0.56)
- Race & ethnicity
- White 64% Hispanic / Latino 15% Two or more races 14% Asian 8%
- Hispanic origin (detail)
- Mexican 15%
- Common ancestry
- Iranian 6%
- Foreign-born
- 8% · Canada
- Languages at home
- 85% English-only · Spanish 15%
Political lean MEDSL · Kern
- 2024 margin
- Strong R (+21.1) · D 38.2% · R 59.3% · Other 2.5%
- 2008→2024 swing
- -3.3pp toward R · 2008: -17.8pp · 2024: -21.1pp
- All cycles
- 2024: R+21.1 2020: R+10.2 2016: R+15.0 2012: R+20.9 2008: R+17.8
Not yet ingested
- Civics
- —
Market trends
- HPI YoY
- ▲ 6.73%
- Current HPI
- 565.4615
- Rent YoY
- —
- Metro
- —
- State GDP YoY
- ▲ 3.21%
- F500 in state
- 116
Industry mix (Fortune 500 HQ in CA)
| Industry | F500 HQs | Revenue |
|---|---|---|
| Technology | 27 | $1,492B |
|
||
| Financial Services | 3 | $174B |
|
||
| Retail | 3 | $44B |
|
||
| Insurance | 3 | $26B |
|
||
| Media / Entertainment | 2 | $115B |
|
||
| Pharmaceuticals / Biotech | 2 | $62B |
|
||
Price history
+177.8% since first listed8 events — show timeline
- 2026-05-01 Price Changed $110,000 GEMLS
- 2026-03-23 Price Changed $95,000 GEMLS
- 2025-10-11 Price Changed $110,000 GEMLS
- 2025-08-04 Listed $120,000 GEMLS
- 2022-08-21 Listing Removed — CRMLS
- 2022-06-07 Pending — CRMLS
- 2022-05-02 Contingent — CRMLS
- 2022-03-30 Listed $39,600 CRMLS
Property tax history
+2.8%/yrLatest (2025): $585 · +2.2% YoY. Source: county tax records.
Cash-flow waterfall
monthlySold comps — $/sqft
last 12 mo · ≤1 miLoading sold comps…