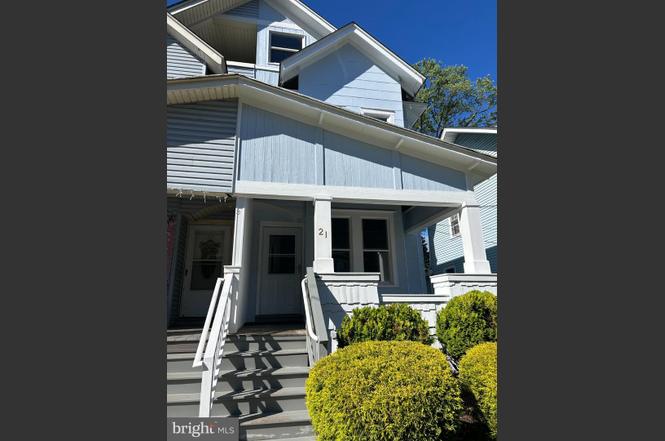
21 Columbia Ave · Trenton, NJ
Flood risk 10/10 · Severe
- FEMA flood zone
- AE
- Chance of flooding over 30 yrs
- 0.99%
- Est. flood insurance / yr
- $1,737 – $8,500
Fire risk 1/10 · Minimal
- Est. fire insurance / yr
- $526 – $976
Heat risk 6/10 · Moderate
- Hot days now (above 102°F)
- 7 days/yr
- Hot days in 30 yrs
- 15 days/yr
Wind risk 6/10 · Moderate
- Chance of severe wind over 30 yrs
- 27.0%
Air-quality risk 5/10 · Moderate
- Unhealthy air days now
- 6 days/yr
- Unhealthy air days in 30 yrs
- 8 days/yr
Risk factors via First Street. Map © Google.
Why this score? — see what drove the C- grade
The composite is a weighted blend of 9 inputs, each scored 0–100. Each bar is that input's sub-score; the figure is the points it added to the 100-point composite (weight × sub-score).
- Cash flow +24.6/30.0
- DSCR +7.9/10.0
- 1% rule +6.5/10.0
- Livability +3.8/5.0
- Rent growth +3.2/5.0
- Condition / age +2.5/5.0
- ARV discount +1.9/15.0
- Schools +0.7/10.0
- Appreciation +0.0/10.0
$250,000
🖨 Deal sheet 📄 Offer letter ✓ Due diligence
Listing remarks
Nestled in the charming community of The Island, this delightful Colonial twin home offers a unique blend of comfort and convenience. With four spacious bedrooms and a full bathroom, the residence is designed for both relaxation and entertaining. The allure of the nearby Delaware River enhances the lifestyle here, inviting leisurely strolls along the water's edge and tranquil moments spent soaking in the serene views. The property boasts a full basement, providing ample storage or potential for customization to suit your needs. The modest sized, virtually maintenance free lot, offers a cozy outdoor space perfect for intimate gatherings or quiet evenings under the stars. This is more than ju
Key facts
- Built 1912
- Listed 2 days
Property features AI
Exterior
- Parking: On-street parking
- Utilities: Public water; Public sewer; Natural gas for heating
- Home design: Semi-detached frame structure; Above-grade living spaces
- Construction: Frame construction; Concrete perimeter foundation; Estimated year built
- Exterior features: Water-oriented property on the Delaware River; Located in a federal flood zone
Interior
- Kitchen: Kitchen
- Bedrooms: Three bedrooms on the first upper level; One bedroom on the second upper level; Master bedroom
- Bathrooms: One full bathroom (all upper levels)
- Heating & cooling: Radiator heating; Electric baseboard heating; Wall unit cooling; 60+ gallon hot water tank
- Interior features: Living room; Dining room; Sitting room; Screened porch; Full basement
Neighborhood map
What this means for you Summary
Snapshot
- This is a 4-bed/1.0-bath townhouse listed at $250k.
Deal economics
- At list price, monthly cash flow is $91 ($1k/yr) — positive.
- The deal already cash-flows at list — no discount required.
- Meets the 1% rule at list price ($3k rent vs $250k).
- Cap rate 8.8% vs local median 6.3% in Trenton — top-decile yield for the area; either an underpriced asset or a hidden risk that comps aren't pricing in. Stress-test before assuming the spread holds.
Location & tenants
- Location reads 76/100 on livability (#133 in NJ, #3,533 nationally) — a middle-class / working-renter tenant base. Strengths: amenities A+, commute A+, health & safety A+; Watch: schools F, crime F, employment F.
- Trenton Public School District (urban): math 2% / reading 16% proficiency, ranked #471 of 472 in NJ (top 100%) — low school quality limits family demand, transient renter base, plan for 1-2y turnover; 80% free/reduced lunch — lower-income household profile, screen leases tightly.
- Market conditions: Rents rising (+2.6%/yr); 144 active listings in the ZIP; 14 comparable units currently listed for rent nearby; rentals leasing fast (median 13d on market — plan ~1-2 weeks tenant-placement turnaround); 2,256 units permitted in Mercer County in 2024 (1,303 in 5+ unit buildings).
- At $2,864/mo this rent would consume 68% of the median local household income ($50k/yr) (locally 2116% of renters already pay >50% of income on rent) — very limited rent-growth headroom before tenants either downsize or default.
Forward outlook
- Local home prices are declining (-3.0%/yr); year-one equity from $2k of loan paydown is wiped out by about $8k of value loss. Plan a longer hold.
- Mercer County population projected at +4% by 2050 — modest demand growth; plan on rents tracking national, not racing it.
Negotiation context
- Only 2 days on market — expect competitive offers; lowballing is unlikely to land.
- 5 sale attempts since 20y ago with the ask held roughly flat each time — persistent listings suggest the price (not the market) is what's stuck; bring a comps-based counter.
- Current owner paid $70k; list at $250k implies a 257% gain — meaningful room to come down on a strong offer.
Risks & watch-outs
- Watch-outs: flood insurance adds $427/mo; built in 1912 — expect roof / HVAC / electrical / plumbing capex.
- Climate carrying-cost: in FEMA flood zone AE (mandatory federal flood insurance); major wind risk, 27% chance of damaging wind over 30y; extreme-heat days projected 7→15/yr by 2055 (HVAC capex compounding) — expect insurance premiums to compound above CPI over the hold.
Questions for the listing agent
- Built in 1912 — when were the roof, HVAC, electrical panel, plumbing, and water heater last replaced?
- What's the actual annual flood-insurance premium (NFIP or private), and is the property in a SFHA with mandatory coverage?
- Is there a deadline driving the sale (1031 exchange, divorce, estate, relocation)? That informs how much negotiation room exists.
- Schools are F-rated, which usually means shorter tenancies and higher turnover. Who's the typical renter profile here, and what's been the actual vacancy rate?
- Crime grade is F in this area — have there been break-ins, vandalism, or insurance claims at this property in the last 3 years? What carrier currently insures it and at what premium?
- What's the average days-on-market for RENTAL listings here right now (not sales)? A rising rental-DOM trend means longer vacancies and softer asking-rent achievability than the comps imply.
- What's the recent tenant-quality profile in this submarket — average credit score on applications, eviction rate, late-payment / NSF rate, and stable-employment percentage? A property-management company in the area should have these aggregated.
- How much new for-sale + rental construction is in the pipeline within 1–3 miles? Heavy new supply typically softens prices + rents 12–24 months out; constrained supply supports both.
Investment metrics
- 1% rule
- 1.15% ✓
- Cap rate
- 8.78%
- Cash-on-cash
- 8.88%
- DSCR
- 1.39
- GRM
- 7.3
CMA / ARV
- ARV (on-the-fly)
- $222,504
- Comps found
- 12
Show comp detail 12 sales within ~0.75 mi
| Address | Dist | Beds/Ba | Sqft | Sold | Price | $/sf | Match |
|---|---|---|---|---|---|---|---|
| 25 Lee Ave | 0.08mi | 4/1.5 | 1,550 (+2%) | 9mo | $165,000 | $106 | 84 |
| 1806 Riverside Dr | 0.15mi | 4/2.0 | 1,556 (+2%) | 11mo | $285,000 | $183 | 76 |
| 57 Sanhican Dr | 0.16mi | 4/2.0 | 1,567 (+3%) | 12mo | $350,000 | $223 | 74 |
| 21 N Westfield Ave | 0.26mi | 3/2.0 (-1) | 1,472 (-3%) | 1mo | $135,000 | $92 | 72 |
| 28 Lee Ave | 0.10mi | 5/1.0 (+1) | 1,422 (-7%) | 22mo | $177,500 | $125 | 61 |
| 101 Lee Ave | 0.05mi | 5/2.0 (+1) | 1,351 (-11%) | 17mo | $275,000 | $204 | 56 |
| 1408 Stuyvesant Ave | 0.67mi | 4/1.0 | 1,404 (-8%) | 1mo | $201,000 | $143 | 55 |
| 1464 Stuyvesant Ave | 0.69mi | 3/1.0 (-1) | 1,627 (+7%) | 9mo | $235,000 | $144 | 44 |
| 1426 Stuyvesant Ave | 0.67mi | 4/1.0 | 1,404 (-8%) | 15mo | $228,000 | $162 | 43 |
| 1474 Stuyvesant Ave | 0.69mi | 4/1.0 | 1,404 (-8%) | 17mo | $185,000 | $132 | 40 |
| 1432 Stuyvesant | 0.67mi | 4/1.5 | 1,404 (-8%) | 16mo | $230,000 | $164 | 40 |
| 1450 Stuyvesant Ave | 0.68mi | 4/1.0 | 1,404 (-8%) | 19mo | $205,000 | $146 | 39 |
Match score weights: distance 35% · size 25% · config 20% · recency 20%. Top-matched comps best support the ARV.
Projected returns pro-forma
-3.0% appreciation · 2.6% rent growth · sell at horizon
- IRR
- -14.2%
- Equity multiple
- 0.49×
- Total profit
- $-35,534
- Equity at exit
- $37,276
- IRR
- -6.0%
- Equity multiple
- 0.62×
- Total profit
- $-26,853
- Equity at exit
- $21,615
Cash invested: $70,000 (down + closing). Projections, not guarantees.
Landlord ↔ Tenant lean methodology
- Overall (STATE)
- 21 Tenant-Leaning
- State New Jersey
- 21 Tenant-Leaning · D+6
- County
- — inherits STATE
- City
- — inherits STATE
ZIP-level market 08618
- Rents YoY
- 2.6%
- Active inventory
- 144
- Price-to-rent
- 7.3×
Monthly cashflow live
- Estimated rent
- $2,864 high interval (Pro) →
- Mortgage (P&I)
- −$1,311
- Tax from tax record
- −$330 /mo · $3,958/yr
- Insurance
- −$104
- Flood insurance flood zone
- −$427 /mo · $5,118/yr
- HOA
- −$0
- Vacancy / Maint / Mgmt
- −$601
- Net cashflow
- $91
Break-even live
UW: 25.0% down · 7.5% · 30yr · 1.5% tax · 5.0% vac · 8.0% maint · 8.0% mgmt
Financing live
Cash to close
- Down payment
- $62,500
- Closing costs
- $7,500
- Reserves months
- —
- Total cash needed
- —
Loan-product check · same deal, 3 products live
Conventional
25% down · 7.5% · 30yr
- Down + closing
- —
- Monthly P&I
- —
- Monthly cashflow
- —
- DSCR
- —
- Eligible?
- —
Personal DTI + credit; lowest rate.
DSCR
20% down · 8.5% · 30yr
- Down + closing
- —
- Monthly P&I
- —
- Monthly cashflow
- —
- DSCR
- —
- Eligible?
- —
No personal income docs; deal must DSCR.
Hard money
10% down · 12.0% · 12mo
- Down + closing
- —
- Monthly P&I
- —
- Monthly cashflow
- —
- DSCR
- —
- Eligible?
- —
Short-term bridge; refi at stabilization.
Rent comps 14 comps
| Address | Beds | Baths | Sqft | Rent | $/sqft | DOM | Units | Dist |
|---|---|---|---|---|---|---|---|---|
| 129 Clearfield Ave Trenton, NJ | 4.0 | 1.5 | 1358 | $3,000 | $2.21 | 12d | 1 | 0.09mi |
| 1442 W State St Trenton, NJ | 5.0 | 2.5 | 1956 | $3,000 | $1.53 | 12d | 1 | 0.19mi |
| 20 N Overbrook Ave Unit B Trenton, NJ | 3.0 | 1.0 | 1518 | $2,300 | $1.52 | 12d | 1 | 0.87mi |
| 73 Oak Ln #2 Trenton, NJ | 4.0 | 1.0 | 1886 | $2,300 | $1.22 | 13d | 1 | 0.97mi |
| 649 W State St Trenton, NJ | 5.0 | 2.0 | 1870 | $2,900 | $1.55 | 12d | 1 | 0.97mi |
| 600 Artisan St Unit 126 Trenton, NJ | 3.0 | 2.0 | 1392 | $2,650 | $1.90 | 20d | 1 | 1.12mi |
| 600 Artisan St Trenton, NJ | 3.0 | 2.0 | 1392 | $2,650 | $1.90 | 12d | 3 | 1.12mi |
| 510 N Hermitage Ave Trenton, NJ | 5.0 | 1.5 | 1316 | $2,500 | $1.90 | 12d | 1 | 1.12mi |
| 830 Lower Ferry Rd Ewing, NJ | 3.0 | 2.0 | 1438 | $2,975 | $2.07 | 13d | 1 | 1.22mi |
| 1800 Kathy Dr Yardley, PA | 1.0–3.0 | 1.0–2.5 | 1101 | $3,065 | $2.78 | 1d | 11 | 1.44mi |
| 311 Spring St Trenton, NJ | 3.0 | 1.0 | 1200 | $2,200 | $1.83 | 13d | 1 | 1.44mi |
| 510 W Hanover St Trenton, NJ | 5.0 | 1.0 | 1200 | $2,200 | $1.83 | 13d | 1 | 1.46mi |
| 319 Rutherford Ave Trenton, NJ | 4.0 | 2.0 | 1100 | $2,200 | $2.00 | 21d | 1 | 1.48mi |
| 186 Passaic St Trenton, NJ | 3.0 | 2.0 | 1064 | $2,400 | $2.26 | 4d | 1 | 1.48mi |
Listing history 3 events
-
2026-06-18days on market $250,000 Active 2 DOM
-
2026-06-16remarks 699-char remark
-
2026-06-16$250,000 Active 1 DOM
ⓘ Source: listings_history table (triggers on properties + properties_extension) + one-shot
backfill from property_details.listing_events for pre-trigger history.
Tax reassessment forecast NJ · Partial reset (capped growth)
- Current annual tax
- $3,958 · $330/mo
- Projected year-2 tax
- $5,092 · $424/mo
- Expected delta
- +$1,133/yr (+$94/mo · 28.6%)
ⓘ Screening estimate from a state-policy table — verify with the county assessor before closing.
Climate risk First Street
- Flood 10/10 Extreme FEMA zone AE · 99% chance over 30 yrs
- Wildfire 1/10 Low
- Heat 6/10 Major 7 d/yr ≥102°F today · 15 d/yr by 30 yrs out
- Wind 6/10 Major 27% chance of damaging wind over 30 yrs
- Air quality 5/10 Major 6 unhealthy d/yr today · 8 by 30 yrs out
Nearby sold comps map
Loading sold comps map…
Walkable amenities ~0.75 mi
Loading nearby amenities…
Taxation est. · year 1
- Rental income
- $34,371
- − Mortgage interest
- −$14,004
- − Property taxes
- −$3,958
- − Insurance
- −$6,368
- − Repairs & maintenance
- −$2,750
- − Management
- −$2,750
- − Depreciation
- −$7,273
- Taxable loss
- −$2,731
- Est. tax savings @ 24.0%
- +$656
- After-tax cash flow
- $1,750/yr
For passive investors: Depreciation is non-cash, so a rental often shows a tax loss while cash-flowing — sheltering income. Rental losses are passive: they offset passive income freely, and up to $25,000/yr can offset ordinary (W-2) income if you actively participate and your MAGI is under $100k (phasing out to $0 by $150k); unused losses carry forward. On sale, claimed depreciation is recaptured at up to 25%, and gains may owe capital-gains tax (a 1031 exchange can defer both). Figures are a year-1 estimate at your 24.0% rate — not tax advice; consult a CPA.
Schools (NCES district)
- District
- Trenton Public School District
- NCES district ID
- 3416290
- Math proficiency
- 2% ▼ -8.00%
- Reading proficiency
- 16% ▼ -4.00%
- Median HH income
- $35,078
- Composite
- 7.31/100
- National rank
- #9956
- State rank
- #471 of 472 in NJ
Livability — Trenton
- Score
- 76/100
- State rank
- #133
- US rank
- #3533
Category grades
Schools grade is shown separately in the Schools card above.
Census & demographics
- Census place
- Trenton, NJ
- County
- Mercer County · 327,655 people
- City population
- 177,819
- Metro
- Trenton-Princeton, NJ
- Population (ZIP)
- 35,634
- Household income
- $50,390
- Rent vs Own
- Severe rent burden
- 2116.0
Population outlook (Mercer County) Hauer SSP2
- Today (2025)
- 381,395 people
- By 2030
- 384,640 · +0.9%
- By 2040
- 391,431 · +2.6%
- By 2050
- 397,845 · +4.3%
- By 2075
- 417,281 · +9.4%
- By 2100
- 420,327 · +10.2%
Race, ethnicity, and origin ACS 2023
- Neighborhood character
- Diverse neighborhood (Simpson 0.59)
- Race & ethnicity
- Black 59% White 19% Hispanic / Latino 16% Two or more races 7% Asian 3%
- Hispanic origin (detail)
- Mexican 1% Puerto Rican 6% Dominican 3%
- Common ancestry
- Romanian 2% Hispanic 1% Scotch-Irish 1%
- Foreign-born
- 14% · Canada, China, South Korea
- Languages at home
- 80% English-only · Spanish 10% Other Indo-European 3% Arabic 1%
Political lean MEDSL · Mercer
- 2024 margin
- Solid D (+33.9) · D 65.9% · R 32.0% · Other 2.1%
- 2008→2024 swing
- -2.2pp toward R · 2008: 36.1pp · 2024: 33.9pp
- All cycles
- 2024: D+33.9 2020: D+40.0 2016: D+36.2 2012: D+36.8 2008: D+36.1
Not yet ingested
- Civics
- —
Market trends
- HPI YoY
- ▼ -309.54%
- Current HPI
- 288.6841
- Rent YoY
- ▲ 2.60%
- Metro
- Trenton-Princeton, NJ
- State GDP YoY
- ▲ 2.05%
- F500 in state
- 34
Industry mix (Fortune 500 HQ in NJ)
| Industry | F500 HQs | Revenue |
|---|---|---|
| Consumer Goods | 3 | $31B |
|
||
| Pharmaceuticals | 2 | $153B |
|
||
| Technology | 2 | $21B |
|
||
| Insurance | 2 | $20B |
|
||
| Healthcare | 2 | $19B |
|
||
| Financial Services | 1 | $70B |
|
||
Price history
+1288.9% since first listed13 events — show timeline
- 2026-06-09 Listed $250,000 BRIGHT MLS
- 2013-09-01 Listing Removed — BRIGHT MLS
- 2013-06-17 Sold (Public Records) $70,000 Public Records
- 2013-03-14 Listed $85,000 BRIGHT MLS
- 2010-08-10 Listing Removed — BRIGHT MLS
- 2010-06-01 Listed $144,900 BRIGHT MLS
- 2010-05-06 Listing Removed — BRIGHT MLS
- 2010-01-06 Listed $149,999 BRIGHT MLS
- 2007-05-10 Sold (Public Records) $66,523 Public Records
- 2007-05-02 Sold (MLS) $66,573 BRIGHT MLS
- 2007-04-25 Listing Removed — BRIGHT MLS
- 2006-12-24 Listed $66,573 BRIGHT MLS
- 2002-05-02 Sold (Public Records) $18,000 Public Records
Property tax history
+0.6%/yrLatest (2025): $3,958 · +1.5% YoY. Source: county tax records.
Cash-flow waterfall
monthlySold comps — $/sqft
last 12 mo · ≤1 miLoading sold comps…