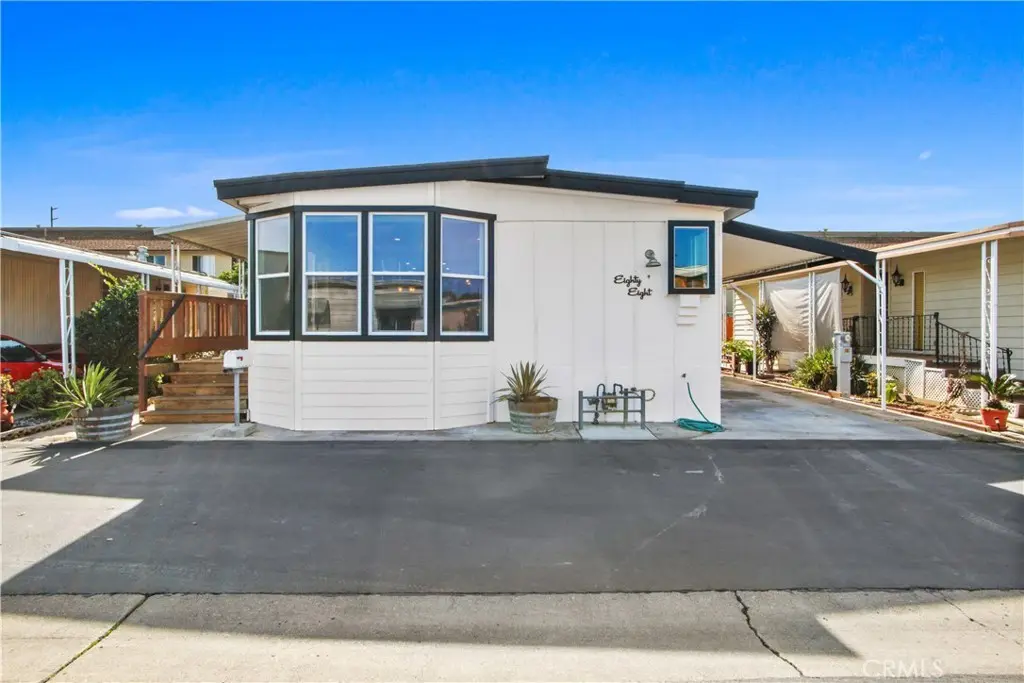
1845 Monrovia Ave #88 · Costa Mesa, CA
Flood risk 1/10 · Minimal
- FEMA flood zone
- X (unshaded)
- Chance of flooding over 30 yrs
- 0.0%
- Est. flood insurance / yr
- $507 – $1,088
Fire risk 1/10 · Minimal
- Est. fire insurance / yr
- $659 – $1,223
Heat risk 5/10 · Moderate
- Hot days now (above 82°F)
- 5 days/yr
- Hot days in 30 yrs
- 16 days/yr
Wind risk 1/10 · Minimal
- Chance of severe wind over 30 yrs
- —
Air-quality risk 4/10 · Minor
- Unhealthy air days now
- 6 days/yr
- Unhealthy air days in 30 yrs
- 6 days/yr
Risk factors via First Street. Map © Google.
Why this score? — see what drove the C- grade
The composite is a weighted blend of 9 inputs, each scored 0–100. Each bar is that input's sub-score; the figure is the points it added to the 100-point composite (weight × sub-score).
- Cash flow +24.9/30.0
- DSCR +8.1/10.0
- 1% rule +6.5/10.0
- Schools +4.8/10.0
- Livability +3.1/5.0
- Rent growth +2.9/5.0
- Condition / age +2.5/5.0
- ARV discount +0.0/15.0
- Appreciation +0.0/10.0
$295,000
🖨 Deal sheet 📄 Offer letter ✓ Due diligence
Listing remarks MLS
All appliances included, home was gutted, 2 br 2.5 ba, new flooring, new windows, new canned lighting, new drywall, new electric wire and pannel, new plubming, new counter tops, new paint, new siding, new tankless water heater, no carpet. House looks and feels like brand new!!!, 1 1/2 miles to the Beach!! 240 volt electric vehical charging outlet, 3-4 car parking in carport! Space rent is $1500 monthly, You have to come see it! SENIOR PARK MUST BE 55 OR OLDER
Key facts
- New drywall
- Gutted
- New flooring
Tags
Neighborhood map
What this means for you Summary
Snapshot
- This is a 2-bed/2.5-bath manufactured listed at $295k.
Deal economics
- At list price, monthly cash flow is $630 ($8k/yr) — positive.
- The deal already cash-flows at list — no discount required.
- Meets the 1% rule at list price ($3k rent vs $295k).
- Recommended offer: $268k (9.0% below list) — sets the bar for market timing.
- Cap rate 8.9% vs local median 1.8% in Costa Mesa — top-decile yield for the area; either an underpriced asset or a hidden risk that comps aren't pricing in. Stress-test before assuming the spread holds.
Location & tenants
- Location reads 61/100 on livability (#558 in CA) — a middle-class / working-renter tenant base. Strengths: employment A+, amenities B; Watch: schools C-, health & safety D+, crime F.
- Newport-Mesa Unified (urban): math 46% / reading 58% proficiency, ranked #106 of 517 in CA (top 20%) — acceptable for families but not a draw, mixed tenant base, ~2y average lease.
- Market conditions: Rents rising (+1.7%/yr); 97 active listings in the ZIP; 40 comparable units currently listed for rent nearby; rentals at typical pace (median 25d on market — plan ~3-4 weeks tenant-placement turnaround); solid renter incomes; 6,974 units permitted in Orange County in 2024 (3,839 in 5+ unit buildings).
- This rent runs 37% of the median local income ($109k/yr) — at the standard rent-burdened threshold; future hikes will face affordability resistance.
Forward outlook
- Local home prices are declining (-3.0%/yr); year-one equity from $2k of loan paydown is wiped out by about $9k of value loss. Plan a longer hold.
- Orange County population projected at +14% by 2050 — modest demand growth; plan on rents tracking national, not racing it.
Negotiation context
- It's been on market 118 days — a 9% lower offer ($268k) is reasonable based on typical stale-listing flexibility.
- 4 sale attempts since 11y ago with the ask held roughly flat each time — persistent listings suggest the price (not the market) is what's stuck; bring a comps-based counter.
- Current owner paid $50k; list at $295k implies a 490% gain — meaningful room to come down on a strong offer.
Risks & watch-outs
- Climate carrying-cost: extreme-heat days projected 5→16/yr by 2055 (HVAC capex compounding) — expect insurance premiums to compound above CPI over the hold.
Questions for the listing agent
- It's been on market 118 days. Have you received any prior offers? Is the seller open to a 9% concession, seller financing, or rate buy-down credit?
- Built in 1969 — when were the roof, HVAC, electrical panel, plumbing, and water heater last replaced?
- Why hasn't it sold? Are there any deal-killer items the seller is aware of (foundation, flood, title, zoning, code violations)?
- Is there a deadline driving the sale (1031 exchange, divorce, estate, relocation)? That informs how much negotiation room exists.
- Crime grade is F in this area — have there been break-ins, vandalism, or insurance claims at this property in the last 3 years? What carrier currently insures it and at what premium?
- What's the average days-on-market for RENTAL listings here right now (not sales)? A rising rental-DOM trend means longer vacancies and softer asking-rent achievability than the comps imply.
- What's the recent tenant-quality profile in this submarket — average credit score on applications, eviction rate, late-payment / NSF rate, and stable-employment percentage? A property-management company in the area should have these aggregated.
- How much new for-sale + rental construction is in the pipeline within 1–3 miles? Heavy new supply typically softens prices + rents 12–24 months out; constrained supply supports both.
Investment metrics
- 1% rule
- 1.15% ✓
- Cap rate
- 8.86%
- Cash-on-cash
- 9.16%
- DSCR
- 1.41
- GRM
- 7.3
CMA / ARV
- ARV (median comp)
- $200,501
- List price
- $295,000
- Delta
- 47.13%
- Verdict
- OVERPRICED
- Comps
- 20 within 1.0 mi
Show comp detail 4 sales within ~0.75 mi
| Address | Dist | Beds/Ba | Sqft | Sold | Price | $/sf | Match |
|---|---|---|---|---|---|---|---|
| 1750 Whittier #86 | 0.21mi | 3/2.0 (+1) | 1,080 (-8%) | 2mo | $260,000 | $241 | 68 |
| 903 W 17th #63 | 0.42mi | 2/2.0 | 1,197 (+2%) | 23mo | $207,000 | $173 | 57 |
| 1750 Whittier #87 | 0.24mi | 3/2.0 (+1) | 1,344 (+14%) | 4mo | $360,000 | $268 | 55 |
| 1660 Whittier Ave #1 | 0.46mi | 2/2.0 | 1,056 (-10%) | 10mo | $235,000 | $223 | 51 |
Match score weights: distance 35% · size 25% · config 20% · recency 20%. Top-matched comps best support the ARV.
Projected returns pro-forma
-3.0% appreciation · 1.71% rent growth · sell at horizon
- IRR
- -3.9%
- Equity multiple
- 0.86×
- Total profit
- $-11,929
- Equity at exit
- $43,985
- IRR
- 4.3%
- Equity multiple
- 1.29×
- Total profit
- $24,211
- Equity at exit
- $25,506
Cash invested: $82,600 (down + closing). Projections, not guarantees.
Landlord ↔ Tenant lean methodology
- Overall (STATE)
- 18 Strongly Tenant-Friendly
- State California
- 18 Strongly Tenant-Friendly · D+13
- County
- — inherits STATE
- City
- — inherits STATE
ZIP-level market 92627
- Rents YoY
- 1.7%
- Active inventory
- 97
- Price-to-rent
- 7.3×
Monthly cashflow live
- Estimated rent
- $3,379 high interval (Pro) →
- Mortgage (P&I)
- −$1,547
- Tax est. 1.5%
- −$369 /mo · $4,425/yr
- Insurance
- −$123
- HOA
- −$0
- Vacancy / Maint / Mgmt
- −$710
- Net cashflow
- $630
Break-even live
UW: 25.0% down · 7.5% · 30yr · 1.5% tax · 5.0% vac · 8.0% maint · 8.0% mgmt
Financing live
Cash to close
- Down payment
- $73,750
- Closing costs
- $8,850
- Reserves months
- —
- Total cash needed
- —
Loan-product check · same deal, 3 products live
Conventional
25% down · 7.5% · 30yr
- Down + closing
- —
- Monthly P&I
- —
- Monthly cashflow
- —
- DSCR
- —
- Eligible?
- —
Personal DTI + credit; lowest rate.
DSCR
20% down · 8.5% · 30yr
- Down + closing
- —
- Monthly P&I
- —
- Monthly cashflow
- —
- DSCR
- —
- Eligible?
- —
No personal income docs; deal must DSCR.
Hard money
10% down · 12.0% · 12mo
- Down + closing
- —
- Monthly P&I
- —
- Monthly cashflow
- —
- DSCR
- —
- Eligible?
- —
Short-term bridge; refi at stabilization.
Rent comps 40 comps
| Address | Beds | Baths | Sqft | Rent | $/sqft | DOM | Units | Dist |
|---|---|---|---|---|---|---|---|---|
| 1819 Monrovia Ave Costa Mesa, CA | 1.0–2.0 | 1.0 | 821 | $2,805 | $3.42 | 4d | 1 | 0.06mi |
| 955 W 19th St Costa Mesa, CA | 2.0 | 1.0 | 900 | $3,043 | $3.38 | 14d | 2 | 0.17mi |
| 1850 Whittier Ave Costa Mesa, CA | 1.0–2.0 | 1.0–2.0 | 775 | $3,657 | $4.72 | 1d | 9 | 0.20mi |
| 825 Center St Costa Mesa, CA | 2.0 | 1.0–2.0 | 850 | $3,200 | $3.76 | 24d | 1 | 0.23mi |
| 989 Arbor St Costa Mesa, CA | 3.0 | 2.0 | 1200 | $4,500 | $3.75 | 24d | 1 | 0.27mi |
| 1846 Placentia Ave Apt A Costa Mesa, CA | 2.0 | 1.0 | 800 | $2,700 | $3.38 | 43d | 1 | 0.32mi |
| 4 Latitude Ct Newport Beach, CA | 3.0 | 3.0 | 1346 | $4,200 | $3.12 | 43d | 1 | 0.36mi |
| 1822 Pomona Ave Unit B Costa Mesa, CA | 3.0 | 3.0 | 1200 | $5,000 | $4.17 | 3d | 1 | 0.55mi |
| 38 Starfish Ct Newport Beach, CA | 3.0 | 2.5 | 1441 | $4,000 | $2.78 | 24d | 1 | 0.64mi |
| 2061-D Wallace Ave Costa Mesa, CA | 2.0 | 1.5 | 986 | $2,735 | $2.77 | 24d | 1 | 0.70mi |
| 2115 Placentia Ave Costa Mesa, CA | 1.0–2.0 | 1.0–2.0 | 725 | $2,595 | $3.58 | 2d | 4 | 0.74mi |
| 625 Shalimar Dr Apt 4 Costa Mesa, CA | 1.0 | 1.0 | 760 | $2,550 | $3.36 | 43d | 1 | 0.75mi |
| 1525 Placentia Ave Newport Beach, CA | 2.0 | 1.0–1.5 | 635 | $3,200 | $5.04 | 5d | 3 | 0.80mi |
| 1544 Placentia Ave Newport Beach, CA | 1.0–2.0 | 1.0 | 900 | $3,035 | $3.37 | 24d | 1 | 0.81mi |
| 1094 Sea Bluff Dr Costa Mesa, CA | 3.0 | 2.0 | 1287 | $4,200 | $3.26 | 3d | 1 | 0.81mi |
| 1530 Placentia Ave Newport Beach, CA | 2.0 | 1.0 | 715 | $2,995 | $4.19 | 24d | 1 | 0.82mi |
| 819 W 15th St Unit 4C Newport Beach, CA | 2.0 | 2.5 | 1295 | $4,500 | $3.47 | 43d | 1 | 0.90mi |
| 454 Bolero Way Newport Beach, CA | 2.0 | 2.0 | 972 | $4,195 | $4.32 | 43d | 1 | 0.91mi |
| 1940 Maple Ave Costa Mesa, CA | 2.0 | 2.5 | 1172 | $3,575 | $3.05 | 15d | 1 | 0.94mi |
| 1940 Maple Ave Costa Mesa, CA | 2.0 | 2.5 | 1170 | $3,495 | $2.99 | 20d | 1 | 0.94mi |
| 1999 Maple Ave Unit 202 Costa Mesa, CA | 2.0 | 1.0 | 704 | $2,575 | $3.66 | 7d | 1 | 0.94mi |
| 673 Victoria St Costa Mesa, CA | 2.0 | 1.0 | 700 | $3,000 | $4.29 | 17d | 1 | 0.97mi |
| 1433 Superior Ave Newport Beach, CA | 1.0 | 1.0 | 600 | $2,845 | $4.74 | 43d | 3 | 0.99mi |
| 2212 Placentia Ave Unit A Costa Mesa, CA | 3.0 | 1.0 | 1000 | $3,400 | $3.40 | 43d | 1 | 1.00mi |
| 2151 Pacific Ave Costa Mesa, CA | 2.0 | 2.0 | 908 | $3,025 | $3.33 | 43d | 1 | 1.01mi |
| 2218 Placentia Ave Unit D Costa Mesa, CA | 2.0 | 1.0 | 900 | $3,000 | $3.33 | 43d | 1 | 1.01mi |
| 2002 Maple Ave Costa Mesa, CA | 2.0 | 1.0 | 950 | $2,595 | $2.73 | 24d | 1 | 1.01mi |
| 2244 Canyon Dr Unit 2244 D Costa Mesa, CA | 2.0 | 1.0 | 740 | $2,750 | $3.72 | 22d | 1 | 1.02mi |
| 2250 Canyon Dr Costa Mesa, CA | 2.0 | 1.0 | 740 | $2,750 | $3.72 | 15d | 1 | 1.04mi |
| 2175 Pacific Ave Unit E5 Costa Mesa, CA | 2.0 | 2.0 | 1117 | $3,400 | $3.04 | 7d | 1 | 1.06mi |
| 592 Hamilton St Apt C Costa Mesa, CA | 2.0 | 1.0 | 810 | $3,800 | $4.69 | 43d | 1 | 1.06mi |
| 2068 Maple Ave Unit C Costa Mesa, CA | 2.0 | 2.5 | 1482 | $5,000 | $3.37 | 43d | 1 | 1.06mi |
| 201 E 16th St Unit D Costa Mesa, CA | 2.0 | 1.0 | 1050 | $3,700 | $3.52 | 43d | 1 | 1.07mi |
| 201 E 16th St Unit C Costa Mesa, CA | 2.0 | 1.0 | 1050 | $3,700 | $3.52 | 24d | 1 | 1.07mi |
| 1612 Orange Ave Costa Mesa, CA | 2.0 | 1.0 | 738 | $3,795 | $5.14 | 24d | 1 | 1.08mi |
| 1614 Orange Ave Costa Mesa, CA | 2.0 | 1.0 | 738 | $3,795 | $5.14 | 24d | 1 | 1.08mi |
| 204 16th Pl Unit C Costa Mesa, CA | 2.0 | 1.0 | 880 | $3,100 | $3.52 | 5d | 1 | 1.10mi |
| 1032 W Wilson St Unit 1024B Costa Mesa, CA | 2.0 | 1.5 | 1028 | $2,975 | $2.89 | 43d | 1 | 1.10mi |
| 102 Scholz Plz Newport Beach, CA | 1.0 | 1.0 | 726 | $3,045 | $4.19 | 2d | 1 | 1.12mi |
| 102 Scholz Plz Newport Beach, CA | 1.0 | 1.0 | 726 | $3,200 | $4.41 | 43d | 1 | 1.12mi |
Listing history 24 events
-
2026-06-18days on market $295,000 Active 118 DOM
-
2026-06-17days on market $295,000 Active 117 DOM
-
2026-06-16days on market $295,000 Active 116 DOM
-
2026-06-15days on market $295,000 Active 115 DOM
-
2026-06-13days on market $295,000 Active 113 DOM
-
2026-06-13days on market $295,000 Active 112 DOM
-
2026-06-09days on market $295,000 Active 109 DOM
-
2026-06-08days on market $295,000 Active 108 DOM
-
2026-06-07days on market $295,000 Active 107 DOM
-
2026-06-04days on market $295,000 Active 104 DOM
-
2026-06-03days on market $295,000 Active 103 DOM
-
2026-06-02days on market $295,000 Active 102 DOM
-
2026-06-01days on market $295,000 Active 101 DOM
-
2026-05-31days on market $295,000 Active 100 DOM
-
2026-02-20$295,000 Active 465-char remark
Show marketing remark (465 chars)
All appliances included, home was gutted, 2 br 2.5 ba, new flooring, new windows, new canned lighting, new drywall, new electric wire and pannel, new plubming, new counter tops, new paint, new siding, new tankless water heater, no carpet. House looks and feels like brand new!!!, 1 1/2 miles to the Beach!! 240 volt electric vehical charging outlet, 3-4 car parking in carport! Space rent is $1500 monthly, You have to come see it! SENIOR PARK MUST BE 55 OR OLDER
-
2022-12-30historical
-
2022-12-08price $289,000
-
2022-10-15status Active
-
2022-09-30$275,000 Active
-
2022-09-24historical
-
2015-08-31historical
-
2015-08-31soldstatus $50,000 Closed Sale
-
2015-08-26status Pending Sale
-
2015-08-01$50,000 Active
ⓘ Source: listings_history table (triggers on properties + properties_extension) + one-shot
backfill from property_details.listing_events for pre-trigger history.
Climate risk First Street
- Flood 1/10 Low FEMA zone X (unshaded) · 0% chance over 30 yrs
- Wildfire 1/10 Low
- Heat 5/10 Major 5 d/yr ≥82°F today · 16 d/yr by 30 yrs out
- Wind 1/10 Low
- Air quality 4/10 Moderate 6 unhealthy d/yr today · 6 by 30 yrs out
Nearby sold comps map
Loading sold comps map…
Walkable amenities ~0.75 mi
Loading nearby amenities…
Taxation est. · year 1
- Rental income
- $40,544
- − Mortgage interest
- −$16,525
- − Property taxes
- −$4,425
- − Insurance
- −$1,475
- − Repairs & maintenance
- −$3,243
- − Management
- −$3,243
- − Depreciation
- −$8,582
- Taxable income
- $3,050
- Est. tax owed @ 24.0%
- −$732
- After-tax cash flow
- $6,833/yr
For passive investors: Depreciation is non-cash, so a rental often shows a tax loss while cash-flowing — sheltering income. Rental losses are passive: they offset passive income freely, and up to $25,000/yr can offset ordinary (W-2) income if you actively participate and your MAGI is under $100k (phasing out to $0 by $150k); unused losses carry forward. On sale, claimed depreciation is recaptured at up to 25%, and gains may owe capital-gains tax (a 1031 exchange can defer both). Figures are a year-1 estimate at your 24.0% rate — not tax advice; consult a CPA.
Schools (NCES district)
- District
- Newport-Mesa Unified
- NCES district ID
- 0627240
- Math proficiency
- 46% ▼ -6.00%
- Reading proficiency
- 58% ▼ -5.00%
- Median HH income
- $83,922
- Composite
- 47.64/100
- National rank
- #2248
- State rank
- #106 of 517 in CA
Livability — Costa Mesa
- Score
- 61/100
- State rank
- #558
- US rank
- #18441
Category grades
Schools grade is shown separately in the Schools card above.
Census & demographics
- Census place
- Costa Mesa, CA
- County
- Orange County · 3,096,323 people
- City population
- 111,101
- Metro
- Los Angeles-Long Beach-Anaheim, CA
- Population (ZIP)
- 60,393
- Household income
- $108,994
- Rent vs Own
- Severe rent burden
- 2889.0
Population outlook (Orange County) Hauer SSP2
- Today (2025)
- 3,477,456 people
- By 2030
- 3,613,117 · +3.9%
- By 2040
- 3,835,945 · +10.3%
- By 2050
- 3,968,736 · +14.1%
- By 2075
- 4,097,053 · +17.8%
- By 2100
- 3,903,633 · +12.3%
Race, ethnicity, and origin ACS 2023
- Neighborhood character
- Diverse neighborhood (Simpson 0.60)
- Race & ethnicity
- White 48% Hispanic / Latino 41% Two or more races 18% Asian 4% Native American 1%
- Hispanic origin (detail)
- Mexican 32%
- Common ancestry
- Italian 4% Slovak 2% Romanian 2%
- Foreign-born
- 22% · Canada, Vietnam, Jamaica
- Languages at home
- 62% English-only · Spanish 32% Other Indo-European 1% Other Asian/Pacific 1%
Political lean MEDSL · Orange
- 2024 margin
- Toss-up / Even · D 49.7% · R 47.1% · Other 3.2%
- 2008→2024 swing
- +5.2pp toward D · 2008: -2.6pp · 2024: 2.6pp
- All cycles
- 2024: D+2.6 2020: D+9.0 2016: D+7.7 2012: R+8.3 2008: R+2.6
Not yet ingested
- Civics
- —
Market trends
- HPI YoY
- ▼ -1520.53%
- Current HPI
- 455.1299
- Rent YoY
- ▲ 1.71%
- Metro
- Los Angeles-Long Beach-Anaheim, CA
- State GDP YoY
- ▲ 3.21%
- F500 in state
- 116
Industry mix (Fortune 500 HQ in CA)
| Industry | F500 HQs | Revenue |
|---|---|---|
| Technology | 27 | $1,492B |
|
||
| Financial Services | 3 | $174B |
|
||
| Retail | 3 | $44B |
|
||
| Insurance | 3 | $26B |
|
||
| Media / Entertainment | 2 | $115B |
|
||
| Pharmaceuticals / Biotech | 2 | $62B |
|
||
Price history
+490.0% since first listed10 events — show timeline
- 2026-02-20 Listed $295,000 CRMLS
- 2022-12-30 Listing Removed — CRMLS
- 2022-12-08 Price Changed $289,000 CRMLS
- 2022-10-15 Relisted — CRMLS
- 2022-09-30 Listed $275,000 CRMLS
- 2022-09-24 Coming Soon — CRMLS
- 2015-08-31 Listing Removed — CRMLS
- 2015-08-31 Sold (MLS) $50,000 CRMLS
- 2015-08-26 Pending — CRMLS
- 2015-08-01 Listed $50,000 CRMLS
Property tax history
+7.4%/yrLatest (2024): $71 · +0.0% YoY. Source: county tax records.
Cash-flow waterfall
monthlySold comps — $/sqft
last 12 mo · ≤1 miLoading sold comps…