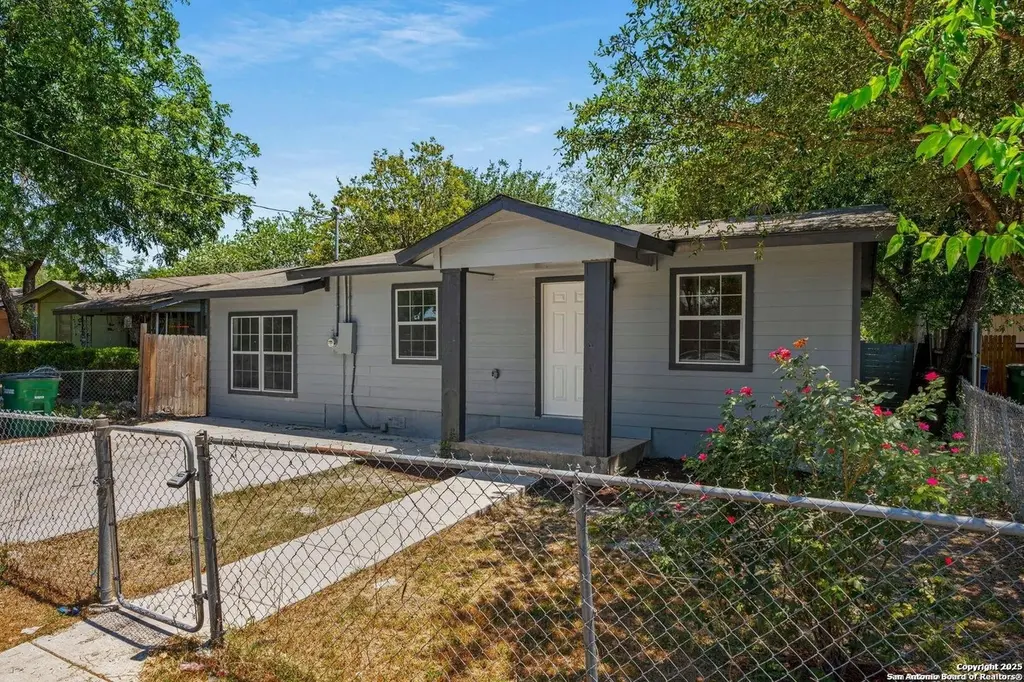
512 Vickers Ave · San Antonio, TX
Flood risk 1/10 · Minimal
- FEMA flood zone
- X (unshaded)
- Chance of flooding over 30 yrs
- 0.0%
- Est. flood insurance / yr
- $507 – $1,088
Fire risk 1/10 · Minimal
- Est. fire insurance / yr
- $1,222 – $2,270
Heat risk 8/10 · Major
- Hot days now (above 108°F)
- 7 days/yr
- Hot days in 30 yrs
- 22 days/yr
Wind risk 8/10 · Major
- Chance of severe wind over 30 yrs
- 80.0%
Air-quality risk 2/10 · Minimal
- Unhealthy air days now
- 1 days/yr
- Unhealthy air days in 30 yrs
- 2 days/yr
Risk factors via First Street. Map © Google.
Why this score? — see what drove the C grade
The composite is a weighted blend of 9 inputs, each scored 0–100. Each bar is that input's sub-score; the figure is the points it added to the 100-point composite (weight × sub-score).
- ARV discount +15.0/15.0
- Cash flow +14.8/30.0
- 1% rule +5.1/10.0
- Appreciation +4.8/10.0
- DSCR +4.5/10.0
- Livability +4.0/5.0
- Rent growth +2.5/5.0
- Condition / age +2.5/5.0
- Schools +1.9/10.0
$162,900
🖨 Deal sheet 📄 Offer letter ✓ Due diligence
Listing remarks MLS
Thoughtfully renovated with a refined, modern aesthetic, this home blends comfort and style in every detail. Wide-plank vinyl flooring flows throughout an open-concept layout ideal for both everyday living and entertaining. The designer kitchen features quartz countertops, sleek finishes, stainless steel appliances and a separate kitchenette for added versatility. Spa-inspired bathrooms offer tiled walk-in showers, while new windows fill the home with natural light. Recent upgrades include fresh interior and exterior paint, a new roof, and central air for year-round comfort. Step outside to a spacious backyard patio perfect for relaxing or hosting guests. Conveniently located just 15 minutes from downtown San Antonio, 18 minutes from Lackland Air Force Base, and less than 5 minutes from premier shopping and dining.
Key facts
- Designer kitchen
- Quartz countertops
- Separate kitchenette
Tags
Neighborhood map
What this means for you Summary
Snapshot
- This is a 4-bed/3.0-bath single-family listed at $163k.
Deal economics
- At list price, monthly cash flow is $46 ($550/yr) — positive.
- The deal already cash-flows at list — no discount required.
- Meets the 1% rule at list price ($2k rent vs $163k).
- Recommended offer: $148k (9.0% below list) — sets the bar for market timing.
- Cap rate 6.6% vs local median 3.8% in San Antonio — top-decile yield for the area; either an underpriced asset or a hidden risk that comps aren't pricing in. Stress-test before assuming the spread holds.
Location & tenants
- Location reads 80/100 on livability (#31 in TX, #1,616 nationally) — a professional / high-income tenant draw. Strengths: amenities A+, commute A+, cost of living A+; Watch: schools C-, crime F.
- Harlandale ISD (urban): math 20% / reading 27% proficiency, ranked #748 of 826 in TX (top 91%) — low school quality limits family demand, transient renter base, plan for 1-2y turnover; 66% free/reduced lunch — lower-income household profile, screen leases tightly.
- Market conditions: 152 active listings in the ZIP; 18 comparable units currently listed for rent nearby; rentals at typical pace (median 24d on market — plan ~3-4 weeks tenant-placement turnaround); 8,308 units permitted in Bexar County in 2024 (2,506 in 5+ unit buildings).
- This rent runs 36% of the median local income ($55k/yr) — at the standard rent-burdened threshold; future hikes will face affordability resistance.
Forward outlook
- In year one you build about $394 of equity ($1k loan paydown + $-732 appreciation (-0.5% local appreciation)).
- Bexar County population projected at +50% by 2050 — long-run rental-demand tailwind backs the buy-and-hold thesis.
Negotiation context
- It's been on market 115 days — a 9% lower offer ($148k) is reasonable based on typical stale-listing flexibility.
- 18 sale attempts since 4y ago with the ask held roughly flat each time — persistent listings suggest the price (not the market) is what's stuck; bring a comps-based counter.
Risks & watch-outs
- Climate carrying-cost: severe wind risk, 80% chance of damaging wind over 30y; extreme-heat days projected 7→22/yr by 2055 (HVAC capex compounding) — expect insurance premiums to compound above CPI over the hold.
Questions for the listing agent
- It's been on market 115 days. Have you received any prior offers? Is the seller open to a 9% concession, seller financing, or rate buy-down credit?
- Why hasn't it sold? Are there any deal-killer items the seller is aware of (foundation, flood, title, zoning, code violations)?
- Is there a deadline driving the sale (1031 exchange, divorce, estate, relocation)? That informs how much negotiation room exists.
- Crime grade is F in this area — have there been break-ins, vandalism, or insurance claims at this property in the last 3 years? What carrier currently insures it and at what premium?
- What's the average days-on-market for RENTAL listings here right now (not sales)? A rising rental-DOM trend means longer vacancies and softer asking-rent achievability than the comps imply.
- What's the recent tenant-quality profile in this submarket — average credit score on applications, eviction rate, late-payment / NSF rate, and stable-employment percentage? A property-management company in the area should have these aggregated.
- How much new for-sale + rental construction is in the pipeline within 1–3 miles? Heavy new supply typically softens prices + rents 12–24 months out; constrained supply supports both.
Investment metrics
- 1% rule
- 1.01% ✓
- Cap rate
- 6.63%
- Cash-on-cash
- 1.20%
- DSCR
- 1.05
- GRM
- 8.2
CMA / ARV
- ARV (median comp)
- $209,293
- List price
- $162,900
- Delta
- -22.17%
- Verdict
- UNDERPRICED
- Comps
- 20 within 1.0 mi
Show comp detail 12 sales within ~0.75 mi
| Address | Dist | Beds/Ba | Sqft | Sold | Price | $/sf | Match |
|---|---|---|---|---|---|---|---|
| 503 Vickers | 0.03mi | 3/2.0 (-1) | 1,328 (+2%) | 4mo | $183,900 | $138 | 83 |
| 702 Berlin | 0.20mi | 3/1.0 (-1) | 1,296 (-0%) | 7mo | $100,000 | $77 | 71 |
| 1166 Fitch | 0.42mi | 3/2.0 (-1) | 1,292 (-1%) | 3mo | $225,000 | $174 | 68 |
| 1161 Fitch | 0.44mi | 3/2.0 (-1) | 1,300 (-0%) | 6mo | $235,000 | $181 | 66 |
| 862 W Southcross | 0.31mi | 3/2.0 (-1) | 1,407 (+8%) | 1mo | $235,000 | $167 | 62 |
| 918 Berlin Ave | 0.32mi | 3/2.0 (-1) | 1,383 (+6%) | 6mo | $282,500 | $204 | 61 |
| 1229 Flanders Ave | 0.66mi | 3/2.0 (-1) | 1,295 (-0%) | 1mo | $230,000 | $178 | 58 |
| 1519 W Harlan Ave | 0.49mi | 3/2.0 (-1) | 1,278 (-2%) | 10mo | $239,000 | $187 | 57 |
| 1918 Brunswick | 0.44mi | 3/2.0 (-1) | 1,438 (+10%) | 3mo | $239,000 | $166 | 50 |
| 1201 Brighton | 0.75mi | 3/2.0 (-1) | 1,259 (-3%) | 2mo | $260,000 | $207 | 49 |
| 1406 Keats St | 0.67mi | 3/2.0 (-1) | 1,349 (+4%) | 14mo | $135,000 | $100 | 42 |
| 224 Elks Dr | 0.70mi | 3/2.0 (-1) | 1,120 (-14%) | 12mo | $160,000 | $143 | 25 |
Match score weights: distance 35% · size 25% · config 20% · recency 20%. Top-matched comps best support the ARV.
Projected returns pro-forma
-0.45% appreciation · 3.0% rent growth · sell at horizon
- IRR
- -2.5%
- Equity multiple
- 0.89×
- Total profit
- $-5,152
- Equity at exit
- $43,676
- IRR
- 3.7%
- Equity multiple
- 1.38×
- Total profit
- $17,291
- Equity at exit
- $49,688
Cash invested: $45,612 (down + closing). Projections, not guarantees.
Landlord ↔ Tenant lean methodology
- Overall (STATE)
- 87 Strongly Landlord-Friendly
- State Texas
- 87 Strongly Landlord-Friendly · R+5
- County
- — inherits STATE
- City
- — inherits STATE
ZIP-level market 78211
- Home prices YoY
- -0.2%
- Active inventory
- 152
- Price-to-rent
- 8.2×
Monthly cashflow live
- Estimated rent
- $1,646 high interval (Pro) →
- Mortgage (P&I)
- −$854
- Tax from tax record
- −$333 /mo · $3,992/yr
- Insurance
- −$68
- HOA
- −$0
- Vacancy / Maint / Mgmt
- −$346
- Net cashflow
- $46
Break-even live
UW: 25.0% down · 7.5% · 30yr · 1.5% tax · 5.0% vac · 8.0% maint · 8.0% mgmt
Financing live
Cash to close
- Down payment
- $40,725
- Closing costs
- $4,887
- Reserves months
- —
- Total cash needed
- —
Loan-product check · same deal, 3 products live
Conventional
25% down · 7.5% · 30yr
- Down + closing
- —
- Monthly P&I
- —
- Monthly cashflow
- —
- DSCR
- —
- Eligible?
- —
Personal DTI + credit; lowest rate.
DSCR
20% down · 8.5% · 30yr
- Down + closing
- —
- Monthly P&I
- —
- Monthly cashflow
- —
- DSCR
- —
- Eligible?
- —
No personal income docs; deal must DSCR.
Hard money
10% down · 12.0% · 12mo
- Down + closing
- —
- Monthly P&I
- —
- Monthly cashflow
- —
- DSCR
- —
- Eligible?
- —
Short-term bridge; refi at stabilization.
Rent comps 18 comps
| Address | Beds | Baths | Sqft | Rent | $/sqft | DOM | Units | Dist |
|---|---|---|---|---|---|---|---|---|
| 1467 W Gerald Ave San Antonio, TX | 3.0 | 2.5 | 1120 | $1,300 | $1.16 | 10d | 1 | 0.01mi |
| 422 Wagner Ave San Antonio, TX | 3.0 | 2.0 | 1220 | $1,750 | $1.43 | 43d | 1 | 0.10mi |
| 507 Linden Ave San Antonio, TX | 3.0 | 2.5 | 1668 | $1,695 | $1.02 | 4d | 1 | 0.12mi |
| 923 Whitman Ave San Antonio, TX | 4.0 | 2.0 | 1208 | $1,700 | $1.41 | 14d | 1 | 0.32mi |
| 737 W Mayfield Blvd San Antonio, TX | 3.0 | 1.0 | 1150 | $1,462 | $1.27 | 43d | 1 | 0.47mi |
| 328 Elks Dr San Antonio, TX | 4.0 | 1.0 | 1600 | $1,500 | $0.94 | 23d | 1 | 0.63mi |
| 1067 Rayburn Dr San Antonio, TX | 4.0 | 2.0 | 1744 | $1,495 | $0.86 | 4d | 1 | 0.72mi |
| 838 McCauley Blvd San Antonio, TX | 3.0 | 2.0 | 1009 | $1,646 | $1.63 | 14d | 1 | 0.88mi |
| 1862 Kendalia Ave San Antonio, TX | 3.0 | 1.0 | 1345 | $1,350 | $1.00 | 23d | 1 | 1.02mi |
| 909 Sims Ave San Antonio, TX | 4.0 | 2.0 | 1400 | $1,750 | $1.25 | 23d | 1 | 1.24mi |
| 1130 Sims Ave San Antonio, TX | 3.0 | 2.0 | 1206 | $1,300 | $1.08 | 23d | 1 | 1.24mi |
| 616 Sims Ave San Antonio, TX | 3.0 | 1.0 | 1148 | $875 | $0.76 | 43d | 1 | 1.30mi |
| 118 Carthage Ct San Antonio, TX | 3.0 | 2.0 | 1368 | $1,450 | $1.06 | 17d | 1 | 1.32mi |
| 611 Brunswick Blvd San Antonio, TX | 3.0 | 2.0 | 1080 | $1,700 | $1.57 | 23d | 1 | 1.32mi |
| 611 Brunswick Blvd San Antonio, TX | 3.0 | 2.0 | 1080 | $1,700 | $1.57 | 14d | 1 | 1.32mi |
| 607 Brunswick Blvd San Antonio, TX | 3.0 | 2.0 | 1350 | $1,750 | $1.30 | 43d | 1 | 1.33mi |
| 503 W Hart Ave San Antonio, TX | 3.0 | 1.0 | 1232 | $1,750 | $1.42 | 10d | 1 | 1.46mi |
| 575 Division Ave San Antonio, TX | 3.0 | 1.5 | 1362 | $1,950 | $1.43 | 17d | 1 | 1.48mi |
Listing history 50 events
-
2026-05-31days on market $162,900 Active 115 DOM
-
2026-02-20price $162,900 826-char remark
Show marketing remark (826 chars)
Thoughtfully renovated with a refined, modern aesthetic, this home blends comfort and style in every detail. Wide-plank vinyl flooring flows throughout an open-concept layout ideal for both everyday living and entertaining. The designer kitchen features quartz countertops, sleek finishes, stainless steel appliances and a separate kitchenette for added versatility. Spa-inspired bathrooms offer tiled walk-in showers, while new windows fill the home with natural light. Recent upgrades include fresh interior and exterior paint, a new roof, and central air for year-round comfort. Step outside to a spacious backyard patio perfect for relaxing or hosting guests. Conveniently located just 15 minutes from downtown San Antonio, 18 minutes from Lackland Air Force Base, and less than 5 minutes from premier shopping and dining.
-
2026-02-06price $163,900 826-char remark
Show marketing remark (826 chars)
Thoughtfully renovated with a refined, modern aesthetic, this home blends comfort and style in every detail. Wide-plank vinyl flooring flows throughout an open-concept layout ideal for both everyday living and entertaining. The designer kitchen features quartz countertops, sleek finishes, stainless steel appliances and a separate kitchenette for added versatility. Spa-inspired bathrooms offer tiled walk-in showers, while new windows fill the home with natural light. Recent upgrades include fresh interior and exterior paint, a new roof, and central air for year-round comfort. Step outside to a spacious backyard patio perfect for relaxing or hosting guests. Conveniently located just 15 minutes from downtown San Antonio, 18 minutes from Lackland Air Force Base, and less than 5 minutes from premier shopping and dining.
-
2026-02-05$164,900 Active 826-char remark
Show marketing remark (826 chars)
Thoughtfully renovated with a refined, modern aesthetic, this home blends comfort and style in every detail. Wide-plank vinyl flooring flows throughout an open-concept layout ideal for both everyday living and entertaining. The designer kitchen features quartz countertops, sleek finishes, stainless steel appliances and a separate kitchenette for added versatility. Spa-inspired bathrooms offer tiled walk-in showers, while new windows fill the home with natural light. Recent upgrades include fresh interior and exterior paint, a new roof, and central air for year-round comfort. Step outside to a spacious backyard patio perfect for relaxing or hosting guests. Conveniently located just 15 minutes from downtown San Antonio, 18 minutes from Lackland Air Force Base, and less than 5 minutes from premier shopping and dining.
-
2026-02-05historical
Show marketing remark (826 chars)
Thoughtfully renovated with a refined, modern aesthetic, this home blends comfort and style in every detail. Wide-plank vinyl flooring flows throughout an open-concept layout ideal for both everyday living and entertaining. The designer kitchen features quartz countertops, sleek finishes, stainless steel appliances and a separate kitchenette for added versatility. Spa-inspired bathrooms offer tiled walk-in showers, while new windows fill the home with natural light. Recent upgrades include fresh interior and exterior paint, a new roof, and central air for year-round comfort. Step outside to a spacious backyard patio perfect for relaxing or hosting guests. Conveniently located just 15 minutes from downtown San Antonio, 18 minutes from Lackland Air Force Base, and less than 5 minutes from premier shopping and dining.
-
2026-01-29status Active
-
2026-01-25status Pending
-
2026-01-15price $164,900
-
2025-12-23$169,000 Active
-
2025-12-12historical $1,440
-
2025-11-19price $1,440
-
2025-10-12$1,600
-
2025-10-10historical
-
2025-09-23price $184,900
-
2025-08-28price $189,900
-
2025-08-19price $194,900
-
2025-07-21price $199,000
-
2025-07-14price $206,000
-
2025-06-30price $209,000
-
2025-06-20$219,000 New
-
2024-12-18price $249,000
-
2024-12-17status Back on Market
-
2024-12-17historical
-
2024-10-24historical $1,700
-
2024-09-28$1,700
-
2024-06-13soldstatus
-
2024-05-25historical $1,700
-
2024-05-18historical
-
2024-05-18$1,700
-
2024-04-01status Back on Market
-
2024-03-31historical
-
2024-03-03status Back on Market
-
2024-03-02historical
-
2024-03-01status Back on Market
-
2024-02-29historical
-
2024-02-22price $209,000
-
2024-01-31price $219,000
-
2024-01-17price $220,000
-
2024-01-16status Back on Market
-
2024-01-08historical
-
2024-01-07$229,900 New
-
2023-12-31historical
-
2023-12-07price $229,900
-
2023-12-05$232,900 New
-
2023-11-30historical
-
2023-11-01$232,999 New
-
2023-10-31historical
-
2023-10-21price $232,999
-
2023-10-10price $237,999
-
2023-09-29status Back on Market
ⓘ Source: listings_history table (triggers on properties + properties_extension) + one-shot
backfill from property_details.listing_events for pre-trigger history.
Tax reassessment forecast TX · Resets to sale price
- Current annual tax
- $3,992 · $333/mo
- Projected year-2 tax
- $3,992 · $333/mo
- Expected delta
- $0/yr ($0/mo · 0.0%)
ⓘ Screening estimate from a state-policy table — verify with the county assessor before closing.
Climate risk First Street
- Flood 1/10 Low FEMA zone X (unshaded) · 0% chance over 30 yrs
- Wildfire 1/10 Low
- Heat 8/10 Severe 7 d/yr ≥108°F today · 22 d/yr by 30 yrs out
- Wind 8/10 Severe 80% chance of damaging wind over 30 yrs
- Air quality 2/10 Low 1 unhealthy d/yr today · 2 by 30 yrs out
Nearby sold comps map
Loading sold comps map…
Walkable amenities ~0.75 mi
Loading nearby amenities…
Taxation est. · year 1
- Rental income
- $19,756
- − Mortgage interest
- −$9,125
- − Property taxes
- −$3,992
- − Insurance
- −$814
- − Repairs & maintenance
- −$1,580
- − Management
- −$1,580
- − Depreciation
- −$4,739
- Taxable loss
- −$2,075
- Est. tax savings @ 24.0%
- +$498
- After-tax cash flow
- $1,048/yr
For passive investors: Depreciation is non-cash, so a rental often shows a tax loss while cash-flowing — sheltering income. Rental losses are passive: they offset passive income freely, and up to $25,000/yr can offset ordinary (W-2) income if you actively participate and your MAGI is under $100k (phasing out to $0 by $150k); unused losses carry forward. On sale, claimed depreciation is recaptured at up to 25%, and gains may owe capital-gains tax (a 1031 exchange can defer both). Figures are a year-1 estimate at your 24.0% rate — not tax advice; consult a CPA.
Schools (NCES district)
- District
- Harlandale ISD
- NCES district ID
- 4822470
- Math proficiency
- 20% ▼ -22.00%
- Reading proficiency
- 27% ▼ -9.00%
- Median HH income
- $33,850
- Composite
- 19.25/100
- National rank
- #8806
- State rank
- #748 of 826 in TX
Livability — San Antonio
- Score
- 80/100
- State rank
- #31
- US rank
- #1616
Category grades
Schools grade is shown separately in the Schools card above.
Census & demographics
- Census place
- San Antonio, TX
- County
- Bexar County · 1,990,555 people
- City population
- 1,806,925
- Metro
- San Antonio-New Braunfels, TX
- Population (ZIP)
- 30,857
- Household income
- $55,436
- Rent vs Own
- Severe rent burden
- 729.0
Population outlook (Bexar County) Hauer SSP2
- Today (2025)
- 2,336,851 people
- By 2030
- 2,560,728 · +9.6%
- By 2040
- 3,020,569 · +29.3%
- By 2050
- 3,493,522 · +49.5%
- By 2075
- 4,668,459 · +99.8%
- By 2100
- 5,533,242 · +136.8%
Race, ethnicity, and origin ACS 2023
- Neighborhood character
- Predominantly Hispanic (93%)
- Race & ethnicity
- Hispanic / Latino 93% Two or more races 30% White 5% Black 1% Native American 1%
- Hispanic origin (detail)
- Mexican 76%
- Foreign-born
- 18% · Canada
- Languages at home
- 35% English-only · Spanish 65%
Political lean MEDSL · Bexar
- 2024 margin
- Lean D (+9.8) · D 54.3% · R 44.6% · Other 1.1%
- 2008→2024 swing
- +4.2pp toward D · 2008: 5.6pp · 2024: 9.8pp
- All cycles
- 2024: D+9.8 2020: D+18.2 2016: D+13.5 2012: D+4.6 2008: D+5.6
Not yet ingested
- Civics
- —
Market trends
- HPI YoY
- ▼ -0.45%
- Current HPI
- 241.1709
- Rent YoY
- —
- Metro
- San Antonio-New Braunfels, TX
- State GDP YoY
- ▲ 3.95%
- F500 in state
- 110
Industry mix (Fortune 500 HQ in TX)
| Industry | F500 HQs | Revenue |
|---|---|---|
| Energy | 16 | $1,198B |
|
||
| Technology | 5 | $198B |
|
||
| Engineering / Construction | 4 | $72B |
|
||
| Energy Services | 3 | $60B |
|
||
| Utilities | 3 | $41B |
|
||
| Healthcare | 2 | $330B |
|
||
Price history
+1.8% since first listed61 events — show timeline
- 2026-02-20 Price Changed $162,900 HARMLS
- 2026-02-06 Price Changed $163,900 HARMLS
- 2026-02-05 Listing Removed — HARMLS
- 2026-02-05 Listed $164,900 HARMLS
- 2026-01-29 Relisted — HARMLS
- 2026-01-25 Pending — HARMLS
- 2026-01-15 Price Changed $164,900 HARMLS
- 2025-12-23 Listed $169,000 HARMLS
- 2025-12-12 Rental Removed $1,440 SABOR
- 2025-11-19 Price Changed $1,440 SABOR
- 2025-10-12 Listed for Rent $1,600 SABOR
- 2025-10-10 Listing Removed — LERA
- 2025-09-23 Price Changed $184,900 LERA
- 2025-08-28 Price Changed $189,900 LERA
- 2025-08-19 Price Changed $194,900 LERA
- 2025-07-21 Price Changed $199,000 LERA
- 2025-07-14 Price Changed $206,000 LERA
- 2025-06-30 Price Changed $209,000 LERA
- 2025-06-20 Listed $219,000 LERA
- 2024-12-18 Price Changed $249,000 LERA
- 2024-12-17 Relisted — LERA
- 2024-12-17 Listing Removed — LERA
- 2024-10-24 Rental Removed $1,700 SABOR
- 2024-09-28 Listed for Rent $1,700 SABOR
- 2024-06-13 Sold (Public Records) — Public Records
- 2024-05-25 Rental Removed $1,700 SABOR
- 2024-05-18 Listing Removed — LERA
- 2024-05-18 Listed for Rent $1,700 SABOR
- 2024-04-01 Relisted — LERA
- 2024-03-31 Listing Removed — LERA
- 2024-03-03 Relisted — LERA
- 2024-03-02 Listing Removed — LERA
- 2024-03-01 Relisted — LERA
- 2024-02-29 Listing Removed — LERA
- 2024-02-22 Price Changed $209,000 LERA
- 2024-01-31 Price Changed $219,000 LERA
- 2024-01-17 Price Changed $220,000 LERA
- 2024-01-16 Relisted — LERA
- 2024-01-08 Listing Removed — LERA
- 2024-01-07 Listed $229,900 LERA
- 2023-12-31 Listing Removed — LERA
- 2023-12-07 Price Changed $229,900 LERA
- 2023-12-05 Listed $232,900 LERA
- 2023-11-30 Listing Removed — LERA
- 2023-11-01 Listed $232,999 LERA
- 2023-10-31 Listing Removed — LERA
- 2023-10-21 Price Changed $232,999 LERA
- 2023-10-10 Price Changed $237,999 LERA
- 2023-09-29 Relisted — LERA
- 2023-09-25 Listing Removed — LERA
- 2023-09-07 Price Changed $240,999 LERA
- 2023-07-25 Price Changed $244,000 LERA
- 2023-06-29 Listed $249,000 LERA
- 2023-04-11 Sold (Public Records) — Public Records
- 2023-04-10 Contingent — LERA
- 2023-04-10 Sold (MLS) — LERA
- 2022-11-12 Price Changed $145,000 LERA
- 2022-11-12 Price Changed $155,000 LERA
- 2022-11-12 Price Changed $150,000 LERA
- 2022-11-11 Listed $160,000 LERA
- 2006-04-25 Sold (Public Records) — Public Records
Property tax history
+8.4%/yrLatest (2025): $3,992 · -11.3% YoY. Source: county tax records.
Cash-flow waterfall
monthlySold comps — $/sqft
last 12 mo · ≤1 miLoading sold comps…