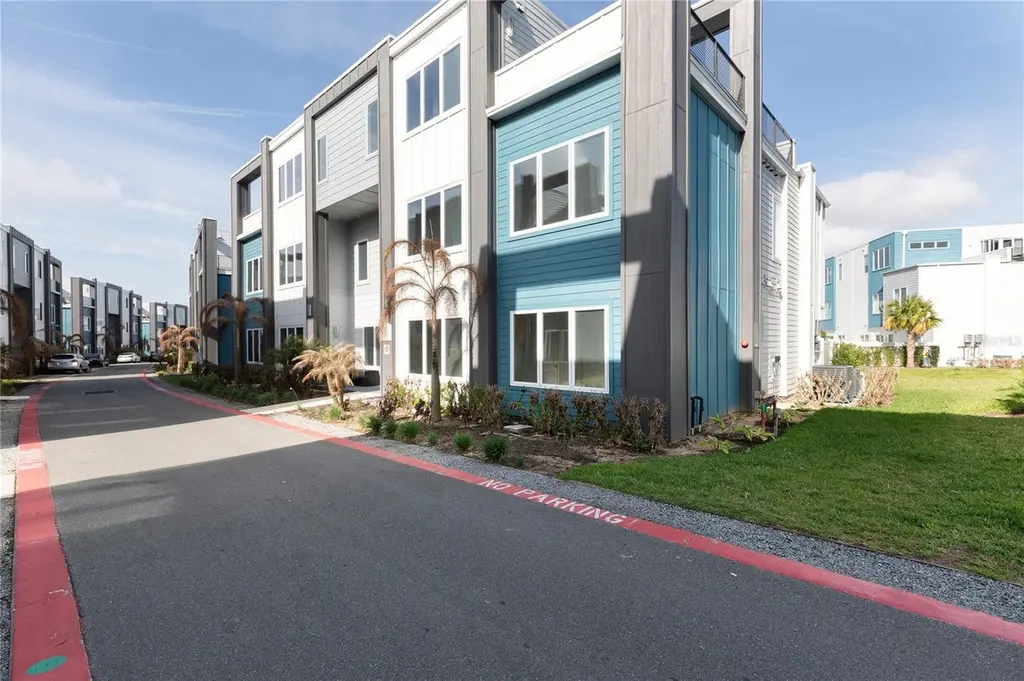
7760 Sandy Ridge Dr #219 · Four Corners, FL
Flood risk 1/10 · Minimal
- FEMA flood zone
- X
- Chance of flooding over 30 yrs
- 0.0%
- Est. flood insurance / yr
- $435 – $905
Fire risk 2/10 · Minimal
- Est. fire insurance / yr
- $947 – $1,759
Heat risk 8/10 · Major
- Hot days now (above threshold)
- 7 days/yr
- Hot days in 30 yrs
- 25 days/yr
Wind risk No data
- Chance of severe wind over 30 yrs
- —
Air-quality risk 1/10 · Minimal
- Unhealthy air days now
- 0 days/yr
- Unhealthy air days in 30 yrs
- 0 days/yr
Risk factors via First Street. Map © Google.
Why this score? — see what drove the F grade
The composite is a weighted blend of 9 inputs, each scored 0–100. Each bar is that input's sub-score; the figure is the points it added to the 100-point composite (weight × sub-score).
- ARV discount +12.7/15.0
- Condition / age +4.8/5.0
- Cash flow +4.3/30.0
- 1% rule +4.0/10.0
- Schools +3.5/10.0
- Livability +3.5/5.0
- Rent growth +1.5/5.0
- DSCR +0.0/10.0
- Appreciation +0.0/10.0
$436,900
🖨 Deal sheet (PDF) 📄 Offer letter ✓ Due diligence
Listing remarks
Discover luxury, space, and income potential in this stunning 5-bedroom, 2-story residence located in Spectrum+ at Reunion Resort—one of Orlando’s most desirable vacation home communities. This expansive home features a modern open-concept design with spacious living areas, high ceilings, and premium finishes throughout. The gourmet kitchen is equipped with quartz countertops, stainless steel appliances, and custom cabinetry, making it perfect for entertaining large groups or hosting guests. Designed with versatility in mind, this property is ideal for large families, vacation use, or short-term rental income in a market that attracts millions of visitors annually.
Key facts
- Custom cabinetry
- Quartz countertops
- Gourmet kitchen
Tags
Neighborhood map
What this means for you Summary
Snapshot
- This is a 5-bed/4.5-bath condo listed at $437k. Condition is rated excellent.
Deal economics
- At list price, monthly cash flow is $-1k ($-14k/yr) — negative.
- To cash-flow at today's rent, offer at most $231k (47.1% below list).
- To meet the 1% rule (rent ≥ 1% of price), the offer needs to be $392k (10.2% below list).
- Recommended offer: $231k (47.1% below list) — sets the bar for cash-flow.
Location & tenants
- Location reads 69/100 on livability (#453 in FL) — a middle-class / working-renter tenant base. Strengths: housing A+, cost of living A-; Watch: amenities F, health & safety F.
- Osceola (suburban): math 39% / reading 45% proficiency, ranked #60 of 73 in FL (top 82%) — families likely to look elsewhere, expect single-tenant / working-renter base with shorter leases; 60% free/reduced lunch — lower-income household profile, screen leases tightly.
- Zoned schools: Reedy Creek Elementary School (math 38% / reading 38%, grade F, #1,587 of 2,144 statewide, top 74%, 880 students, 55% FRL); Horizon Middle School (math 40% / reading 41%, grade F, #360 of 571 statewide, top 64%, 1,295 students, 75% FRL); Poinciana High School (math 24% / reading 31%, grade F, #470 of 667 statewide, top 71%, 2,455 students, 48% FRL) — zoned schools at 60% FRL track the district average.
- Market conditions: Rents falling (-4.0%/yr); 2296 active listings in the ZIP; 40 comparable units currently listed for rent nearby; rentals lingering (median 52d on market — plan ~5-8 weeks vacancy on turnover, expect pricing pressure); 55% of comp listings sitting > 30 days — soft ceiling on asking rent; solid renter incomes; 8,813 units permitted in Osceola County in 2024 (3,072 in 5+ unit buildings).
- At $3,924/mo this rent would consume 61% of the median local household income ($78k/yr) — very limited rent-growth headroom before tenants either downsize or default.
Forward outlook
- Local home prices are declining (-3.0%/yr); year-one equity from $3k of loan paydown is wiped out by about $13k of value loss. Plan a longer hold.
- Osceola County population projected at +73% by 2050 — long-run rental-demand tailwind backs the buy-and-hold thesis.
Negotiation context
- It's been on market 102 days — a 9% lower offer ($398k) is reasonable based on typical stale-listing flexibility.
Risks & watch-outs
- Watch-outs: property tax is 2.5% of price; HOA is 22% of rent.
- Climate carrying-cost: extreme-heat days projected 7→25/yr by 2055 (HVAC capex compounding) — expect insurance premiums to compound above CPI over the hold.
Questions for the listing agent
- What do current leases actually rent for vs. the listed asking? Can we see a recent rent roll and the last 12 months of T-12 income?
- It's been on market 102 days. Have you received any prior offers? Is the seller open to a 47% concession, seller financing, or rate buy-down credit?
- Property tax is high relative to price — has the assessment been appealed recently, and will the sale trigger a re-assessment?
- What does the HOA fee cover, when was the last increase, and are there any pending special assessments or reserve-fund shortfalls?
- Any open or pending special assessments — roof, HVAC, plumbing, elevator, façade? What's the per-unit balance and payoff schedule, and is the seller paying it off at close or rolling it to the buyer?
- Why hasn't it sold? Are there any deal-killer items the seller is aware of (foundation, flood, title, zoning, code violations)?
- Is there a deadline driving the sale (1031 exchange, divorce, estate, relocation)? That informs how much negotiation room exists.
- Schools are F-rated, which usually means shorter tenancies and higher turnover. Who's the typical renter profile here, and what's been the actual vacancy rate?
- The area grade is low — what's the realistic commute time and amenity access for the typical tenant pool here? Any planned neighborhood developments (good or bad) we should know about?
- What's the average days-on-market for RENTAL listings here right now (not sales)? A rising rental-DOM trend means longer vacancies and softer asking-rent achievability than the comps imply.
- What's the recent tenant-quality profile in this submarket — average credit score on applications, eviction rate, late-payment / NSF rate, and stable-employment percentage? A property-management company in the area should have these aggregated.
- How much new apartment / multifamily construction is in the pipeline within 1–3 miles? Heavy new supply (>2% of stock underway) typically softens rents 12–24 months out; light construction supports rent growth.
Investment metrics
- 1% rule
- 0.90% ✗
- Cap rate
- 3.09%
- Cash-on-cash
- -11.44%
- DSCR
- 0.49
- GRM
- 9.3
CMA / ARV
- ARV (median comp)
- $494,072
- List price
- $436,900
- Delta
- -11.57%
- Verdict
- UNDERPRICED
- Comps
- 20 within 1.0 mi
Show comp detail 12 sales within ~0.75 mi
| Address | Dist | Beds/Ba | Sqft | Sold | Price | $/sf | Match |
|---|---|---|---|---|---|---|---|
| 7813 Marlow Pl | 0.27mi | 6/4.5 (+1) | 2,714 (+3%) | 1mo | $562,900 | $207 | 76 |
| 401 Southfield St | 0.93mi | 5/4.5 | 2,574 (-2%) | 2mo | $599,900 | $233 | 60 |
| 7546 Marker Ave | 1.28mi | 5/5.0 | 2,570 (-2%) | 2mo | $575,000 | $224 | 58 |
| 1514 Euston Dr | 1.17mi | 4/4.5 (-1) | 2,592 (-1%) | 2mo | $551,000 | $213 | 56 |
| 877 Desert Mountain Ct | 0.70mi | 4/3.5 (-1) | 2,703 (+3%) | 1mo | $550,000 | $203 | 53 |
| 1181 Castle Pines Ct | 0.60mi | 5/5.5 | 3,228 (+23%) | 4mo | $800,000 | $248 | 40 |
| 1036 Castle Pines Ct | 0.56mi | 6/5.5 (+1) | 3,228 (+23%) | 4mo | $990,000 | $307 | 36 |
| 7727 Fairfax Dr | 1.26mi | 6/5.5 (+1) | 2,921 (+11%) | 2mo | $640,000 | $219 | 36 |
| 240 Burma St | 1.03mi | 4/3.0 (-1) | 2,363 (-10%) | 4mo | $537,500 | $227 | 34 |
| 1545 Fairview Cir | 0.85mi | 5/5.5 | 3,076 (+17%) | 3mo | $525,000 | $171 | 34 |
| 348 Famagusta Dr | 1.40mi | 4/4.0 (-1) | 2,020 (-23%) | 1mo | $345,000 | $171 | 32 |
| 421 Southfield St | 0.96mi | 6/5.0 (+1) | 3,203 (+22%) | 2mo | $675,000 | $211 | 32 |
Match score weights: distance 35% · size 25% · config 20% · recency 20%. Top-matched comps best support the ARV.
Projected returns pro-forma
-3.0% appreciation · 0.0% rent growth · sell at horizon
- IRR
- -42.4%
- Equity multiple
- -0.27×
- Total profit
- $-155,726
- Equity at exit
- $65,143
- IRR
- —
- Equity multiple
- -1.23×
- Total profit
- $-272,310
- Equity at exit
- $37,775
Cash invested: $122,332 (down + closing). Projections, not guarantees.
Landlord ↔ Tenant lean methodology
- Overall (STATE)
- 87 Strongly Landlord-Friendly
- State Florida
- 87 Strongly Landlord-Friendly · R+3
- County
- — inherits STATE
- City
- — inherits STATE
ZIP-level market 34747
- Home prices YoY
- -33.1%
- Rents YoY
- -4.0%
- Active inventory
- 2296
- Price-to-rent
- 9.3×
Monthly cashflow live
- Estimated rent
- $3,924 high interval (Pro) →
- Mortgage (P&I)
- −$2,291
- Tax from tax record
- −$916 /mo · $10,992/yr
- Insurance
- −$182
- HOA
- −$877
- Lot rent
- −$0
- Vacancy / Maint / Mgmt
- −$824
- Net cashflow
- $-1,166
Break-even live
Sensitivity live
| Price | -10% $-919 | -5% $-1,042 | +0% $-1,166 | +5% $-1,290 | +10% $-1,413 |
|---|---|---|---|---|---|
| Rent | -10% $-1,476 | -5% $-1,321 | +0% $-1,166 | +5% $-1,011 | +10% $-856 |
| Rate | -1.0pp $-946 | -0.5pp $-1,055 | base $-1,166 | +0.5pp $-1,279 | +1.0pp $-1,394 |
UW: 25.0% down · 7.5% · 30yr · 1.5% tax · 5.0% vac · 8.0% maint · 8.0% mgmt
Financing live
Cash to close
- Down payment
- $109,225
- Closing costs
- $13,107
- Club membership (one-time)
- —
- Reserves months
- —
- Total cash needed
- —
Loan-product check · same deal, 3 products live
Conventional
25% down · 7.5% · 30yr
- Cash invested
- —
- Monthly P&I
- —
- Monthly cashflow
- —
- DSCR
- —
- Eligible?
- —
Personal DTI + credit; lowest rate.
DSCR
20% down · 8.5% · 30yr
- Cash invested
- —
- Monthly P&I
- —
- Monthly cashflow
- —
- DSCR
- —
- Eligible?
- —
No personal income docs; deal must DSCR.
Hard money
10% down · 12.0% · 12mo
- Cash invested
- —
- Monthly P&I
- —
- Monthly cashflow
- —
- DSCR
- —
- Eligible?
- —
Short-term bridge; refi at stabilization.
Rent comps 40 comps
| Address | Beds | Baths | Sqft | Rent | $/sqft | DOM | Units | Dist |
|---|---|---|---|---|---|---|---|---|
| 7760 Sandy Ridge Dr #226 Reunion, FL | 5.0 | 4.5 | 2630 | $3,400 | $1.29 | 74d | 1 | 0.04mi |
| 7760 Sandy Ridge Dr #222 Reunion, FL | 5.0 | 4.5 | 2630 | $2,700 | $1.03 | 115d | 1 | 0.04mi |
| 1217 Reunion Village Blvd Reunion, FL | 6.0 | 5.0 | 3291 | $5,450 | $1.66 | 10d | 1 | 0.16mi |
| 7770 Sandy Ridge Dr #224 Reunion, FL | 5.0 | 4.5 | 2630 | $3,000 | $1.14 | 26d | 1 | 0.17mi |
| 7770 Sandy Ridge Dr #225 Reunion, FL | 5.0 | 4.5 | 2630 | $2,999 | $1.14 | 10d | 1 | 0.17mi |
| 7740 Sandy Ridge Dr Reunion, FL | 3.0–5.0 | 2.5–4.5 | 2065 | $4,500 | $2.18 | 157d | 5 | 0.22mi |
| 7740 Sandy Ridge Dr Reunion, FL | 3.0–5.0 | 3.0–4.5 | 2065 | $4,300 | $2.08 | 10d | 3 | 0.22mi |
| 7740 Sandy Ridge Dr Reunion, FL | 5.0 | 4.0–4.5 | 2630 | $3,650 | $1.39 | 48d | 3 | 0.22mi |
| 7740 Sandy Ridge Dr Reunion, FL | 3.0–5.0 | 3.0–4.5 | 2065 | $4,300 | $2.08 | 3d | 4 | 0.22mi |
| 7740 Sandy Ridge Dr Reunion, FL | 5.0 | 4.0–4.5 | 2630 | $3,750 | $1.43 | 105d | 3 | 0.22mi |
| 7740 Sandy Ridge Dr Unit 1511194P Kissimmee, FL | 3.0–5.0 | 2.0–4.0 | 2599 | $8,730 | $3.36 | 0d | 2 | 0.23mi |
| 7867 Poplin St Kissimmee, FL | 6.0 | 5.0 | 3291 | $5,500 | $1.67 | 105d | 1 | 0.24mi |
| 7867 Poplin St Kissimmee, FL | 6.0 | 5.0 | 3291 | $5,500 | $1.67 | 164d | 1 | 0.24mi |
| 7867 Poplin St Kissimmee, FL | 6.0 | 5.0 | 3291 | $4,000 | $1.22 | 103d | 1 | 0.24mi |
| 7854 Poplin St Kissimmee, FL | 6.0 | 5.0 | 3275 | $4,899 | $1.50 | 148d | 1 | 0.27mi |
| 855 Golden Bear Dr Unit 1036618P Kissimmee, FL | 5.0 | 4.0 | 3218 | $5,824 | $1.81 | 74d | 1 | 0.33mi |
| 834 Golden Bear Dr Unit 1304296P Kissimmee, FL | 5.0 | 5.5 | 3519 | $7,978 | $2.27 | 143d | 1 | 0.36mi |
| 7676 Somersworth Dr Kissimmee, FL | 4.0 | 3.5 | 2158 | $2,950 | $1.37 | 10d | 1 | 0.39mi |
| 7745 Somersworth Dr Kissimmee, FL | 4.0 | 2.5 | 2080 | $3,650 | $1.75 | 145d | 1 | 0.48mi |
| 1101 Castle Pines Ct Unit 1541759P Kissimmee, FL | 5.0 | 5.5 | 3196 | $7,978 | $2.50 | 127d | 1 | 0.52mi |
| 1105 Castle Pines Ct Unit 1029869P Kissimmee, FL | 5.0 | 4.0 | 3153 | $6,967 | $2.21 | 1d | 1 | 0.52mi |
| 1399 Greenfield Loop Kissimmee, FL | 4.0 | 2.5 | 1817 | $2,950 | $1.62 | 2d | 1 | 0.52mi |
| 7796 Somersworth Dr Kissimmee, FL | 4.0 | 2.5 | 2089 | $3,600 | $1.72 | 10d | 1 | 0.54mi |
| 1355 Greenfield Loop Kissimmee, FL | 4.0 | 2.5 | 1817 | $3,100 | $1.71 | 10d | 1 | 0.54mi |
| 1080 Castle Pines Ct Unit 1524598P Kissimmee, FL | 5.0 | 5.0 | 3196 | $5,575 | $1.74 | 87d | 1 | 0.54mi |
| 1164 Castle Pines Ct Unit 1564823P Kissimmee, FL | 5.0 | 5.0 | 3153 | $5,493 | $1.74 | 51d | 1 | 0.58mi |
| 860 Assembly Ct Reunion, FL | 4.0 | 2.5 | 1862 | $2,095 | $1.13 | 53d | 1 | 0.59mi |
| 860 Assembly Ct Reunion, FL | 4.0 | 2.5 | 1862 | $1,970 | $1.06 | 3d | 1 | 0.59mi |
| 7589 Assembly Ln Reunion, FL | 4.0 | 2.5 | 1862 | $2,100 | $1.13 | 2d | 1 | 0.62mi |
| 909 Desert Mountain Ct Unit 1524600P Kissimmee, FL | 6.0 | 5.0 | 3293 | $5,713 | $1.73 | 9d | 1 | 0.64mi |
| 835 Assembly Ct Unit 1236826P Kissimmee, FL | 4.0 | 2.0 | 1851 | $5,220 | $2.82 | 2d | 1 | 0.65mi |
| 823 Assembly Ct Reunion, FL | 4.0 | 2.5 | 1822 | $1,995 | $1.09 | 10d | 1 | 0.66mi |
| 1509 Fairview Cir Unit 1051139P Kissimmee, FL | 5.0 | 5.0 | 3035 | $4,435 | $1.46 | 50d | 1 | 0.68mi |
| 7950 Delwin Ln Reunion, FL | 4.0 | 2.5 | 2080 | $3,000 | $1.44 | 3d | 1 | 0.72mi |
| 7740 Linkside Loop Reunion, FL | 4.0 | 3.0 | 2296 | $2,595 | $1.13 | 161d | 1 | 0.79mi |
| 7740 Linkside Loop Unit 7740 Kissimmee, FL | 4.0 | 2.5 | 2296 | $2,595 | $1.13 | 157d | 1 | 0.79mi |
| 1419 Fairview Cir Unit 1467670P Kissimmee, FL | 5.0 | 5.0 | 3304 | $3,570 | $1.08 | 2d | 1 | 0.81mi |
| 7736 Linkside Loop Reunion, FL | 6.0 | 6.0 | 3451 | $4,300 | $1.25 | 145d | 1 | 0.82mi |
| 284 Southfield St Kissimmee, FL | 5.0 | 5.0 | 2574 | $4,800 | $1.86 | 74d | 1 | 0.82mi |
| 7755 Westland Dr Kissimmee, FL | 4.0 | 3.0 | 2363 | $3,795 | $1.61 | 53d | 1 | 0.87mi |
Property features AI
Finance
- Other
- Total monthly fees listed as $877Total annual fees listed as $10,524
- Financial info
- CDD present
- HOA & community
- HOA: Artemis LifestylesMonthly HOA fee $813 (includes 24-hour guard, cable TV, pool, insurance, internet, grounds maintenance, water)Monthly condo fee $64Community amenities: Fitness center, golf, golf carts allowed, playground, poolPets allowed
Exterior
- Utilities
- Public waterPublic sewerCable availableElectricity availableWater available
- Home design
- Residential condominiumCompleted conditionTwo storiesFaces eastSecond-floor unit
- Construction
- Stucco constructionOther roof typeSlab foundationNew construction
- Exterior features
- Asphalt road accessNo waterfront
Interior
- Kitchen
- CooktopDishwasherMicrowave
- Bedrooms
- 5 bedrooms
- Flooring
- CarpetTile
- Bathrooms
- 4 full baths1 half bath
- Heating & cooling
- Central heatingCentral air conditioning
- Interior features
- Ceiling fansHigh ceilingsThermostat
- Laundry & utility
- WasherDryerNo dedicated laundry room listed
HOA detail $877/mo · $10,524/yr condo
- Assessments
- None detected in remarks — confirm with the listing agent.
Listing history 35 events
-
2026-07-14days on market $436,900 Active 102 DOM
-
2026-07-13days on market $436,900 Active 101 DOM
-
2026-07-13days on market $436,900 Active 100 DOM
-
2026-07-11days on market $436,900 Active 99 DOM
-
2026-07-10days on market $436,900 Active 98 DOM
-
2026-07-10days on market $436,900 Active 97 DOM
-
2026-07-07days on market $436,900 Active 95 DOM
-
2026-07-06days on market $436,900 Active 94 DOM
-
2026-07-05days on market $436,900 Active 93 DOM
-
2026-07-04days on market $436,900 Active 91 DOM
-
2026-07-02days on market $436,900 Active 90 DOM
-
2026-07-01days on market $436,900 Active 89 DOM
-
2026-06-30days on market $436,900 Active 88 DOM
-
2026-06-29days on market $436,900 Active 87 DOM
-
2026-06-28days on market $436,900 Active 86 DOM
-
2026-06-27days on market $436,900 Active 85 DOM
-
2026-06-26days on market $436,900 Active 84 DOM
-
2026-06-24days on market $436,900 Active 82 DOM
-
2026-06-22days on market $436,900 Active 80 DOM
-
2026-06-21days on market $436,900 Active 79 DOM
-
2026-06-18days on market $436,900 Active 76 DOM
-
2026-06-17days on market $436,900 Active 75 DOM
-
2026-06-16days on market $436,900 Active 74 DOM
-
2026-06-15days on market $436,900 Active 73 DOM
-
2026-06-13days on market $436,900 Active 71 DOM
-
2026-06-13days on market $436,900 Active 70 DOM
-
2026-06-09days on market $436,900 Active 67 DOM
-
2026-06-08days on market $436,900 Active 66 DOM
-
2026-06-07days on market $436,900 Active 65 DOM
-
2026-06-04days on market $436,900 Active 62 DOM
-
2026-06-03days on market $436,900 Active 61 DOM
-
2026-06-02pricedays on market $436,900 Active 60 DOM
-
2026-06-02days on market $462,900 Active 59 DOM
-
2026-05-31days on market $462,900 Active 58 DOM
-
2026-04-03$462,900 Active
ⓘ Source: listings_history table (triggers on properties + properties_extension) + one-shot
backfill from property_details.listing_events for pre-trigger history.
Tax reassessment forecast FL · Resets to sale price
- Current annual tax
- $10,992 · $916/mo
- Projected year-2 tax
- $10,992 · $916/mo
- Expected delta
- $0/yr ($0/mo · 0.0%)
ⓘ Screening estimate from a state-policy table — verify with the county assessor before closing.
Climate risk First Street
- Flood 1/10 Low FEMA zone X · 0% chance over 30 yrs
- Wildfire 2/10 Low
- Heat 8/10 Severe
- Air quality 1/10 Low 0 unhealthy d/yr today · 0 by 30 yrs out
Nearby sold comps map
Loading sold comps map…
Walkable amenities ~0.75 mi
Loading nearby amenities…
Taxation est. · year 1
- Rental income
- $47,093
- − Mortgage interest
- −$24,473
- − Property taxes
- −$10,992
- − Insurance
- −$2,184
- − Repairs & maintenance
- −$3,767
- − Management
- −$3,767
- − HOA
- −$10,524
- − Depreciation
- −$12,710
- Taxable loss
- −$21,325
- Est. tax savings @ 24.0%
- +$5,118
- After-tax cash flow
- $-8,872/yr
For passive investors: Depreciation is non-cash, so a rental often shows a tax loss while cash-flowing — sheltering income. Rental losses are passive: they offset passive income freely, and up to $25,000/yr can offset ordinary (W-2) income if you actively participate and your MAGI is under $100k (phasing out to $0 by $150k); unused losses carry forward. On sale, claimed depreciation is recaptured at up to 25%, and gains may owe capital-gains tax (a 1031 exchange can defer both). Figures are a year-1 estimate at your 24.0% rate — not tax advice; consult a CPA.
Condition & rehab AI · 12 photos
This modern, move-in-ready 5-bedroom, 2-story condo in Spectrum+ at Reunion Resort is in excellent condition with no visible repairs needed. It offers a high ROI with updates that can further increase its value for both resale and rental.
Value-add opportunities
- Both Painting the exterior and interior walls — Fresh paint can enhance curb appeal and interior aesthetics. ↑
- Both Updating the flooring to hardwood or tile — Hardwood or tile flooring can increase both resale and rental value. ↑
- Both Upgrading the kitchen appliances — Modern appliances can attract more buyers and renters. ↑
- Both Adding smart home features — Smart home features can increase both resale and rental value by making the home more convenient and energy-efficient. ↑
Zoned Schools
Schools (NCES district)
- District
- Osceola
- NCES district ID
- 1201470
- Math proficiency
- 39% ▼ -9.00%
- Reading proficiency
- 45% ▼ -4.00%
- Median HH income
- $45,528
- Composite
- 35.7/100
- National rank
- #4865
- State rank
- #60 of 73 in FL
Livability — Four Corners
- Score
- 69/100
- State rank
- #453
- US rank
- #8218
Category grades
Schools grade is shown separately in the Schools card above.
Census & demographics
- Census place
- Four Corners, FL
- County
- Osceola County · 447,624 people
- City population
- 27,422
- Metro
- Orlando-Kissimmee-Sanford, FL
- Population (ZIP)
- 30,859
- Household income
- $77,755
- Rent vs Own
- Severe rent burden
- 11% of renters
Population outlook (Osceola County) Hauer SSP2
- Today (2025)
- 447,624 people
- By 2030
- 511,823 · +14.3%
- By 2040
- 642,986 · +43.6%
- By 2050
- 774,552 · +73.0%
- By 2075
- 1,078,144 · +140.9%
- By 2100
- 1,269,660 · +183.6%
Race, ethnicity, and origin ACS 2023
- Neighborhood character
- Diverse neighborhood (Simpson 0.59)
- Race & ethnicity
- White 58% Hispanic / Latino 26% Two or more races 16% Black 6% Asian 3%
- Hispanic origin (detail)
- Mexican 2% Puerto Rican 7% Cuban 2% Dominican 2%
- Languages at home
- 70% English-only · Spanish 21% Other Indo-European 4% Russian/Polish/Slavic 1%
Political lean MEDSL · Osceola
- 2024 margin
- Toss-up / Even · D 48.7% · R 50.2% · Other 1.1%
- 2008→2024 swing
- -21.2pp toward R · 2008: 19.7pp · 2024: -1.4pp
- All cycles
- 2024: R+1.4 2020: D+13.8 2016: D+25.0 2012: D+24.5 2008: D+19.7
Not yet ingested
- Civics
- —
Market trends
- HPI YoY
- ▼ -87.29%
- Current HPI
- 176.0826
- Rent YoY
- ▼ -3.99%
- Metro
- Orlando-Kissimmee-Sanford, FL
- State GDP YoY
- ▲ 3.28%
- F500 in state
- 36
Industry mix (Fortune 500 HQ in FL)
| Industry | F500 HQs | Revenue |
|---|---|---|
| Industrial Technology | 2 | $29B |
|
||
| Insurance | 2 | $17B |
|
||
| Retail | 1 | $60B |
|
||
| Technology Distribution | 1 | $58B |
|
||
| Homebuilding | 1 | $35B |
|
||
| Technology Manufacturing | 1 | $35B |
|
||
Price history
-5.6% since first listed2 events — show timeline
- 2026-06-02 Price Changed $436,900 Stellar MLS as Distributed by MLS Grid
- 2026-04-03 Listed $462,900 Stellar MLS as Distributed by MLS Grid
Property tax history
+256.2%/yrLatest (2025): $10,992 · +256.2% YoY. Source: county tax records.
Cash-flow waterfall
monthlySold comps — $/sqft
last 12 mo · ≤1 miLoading sold comps…