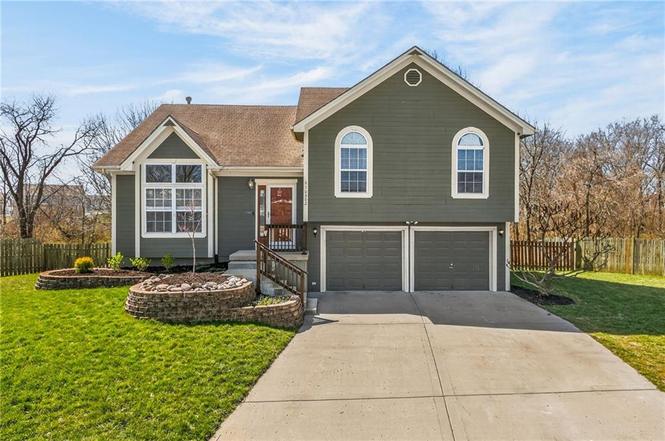
10502 N Wallace Ave · Kansas City, MO
Flood risk 1/10 · Minimal
- FEMA flood zone
- X (unshaded)
- Chance of flooding over 30 yrs
- 0.0%
- Est. flood insurance / yr
- $473 – $860
Fire risk 4/10 · Minor
- Est. fire insurance / yr
- $1,054 – $1,958
Heat risk 4/10 · Minor
- Hot days now (above 105°F)
- 7 days/yr
- Hot days in 30 yrs
- 17 days/yr
Wind risk 2/10 · Minimal
- Chance of severe wind over 30 yrs
- —
Air-quality risk 3/10 · Minor
- Unhealthy air days now
- 3 days/yr
- Unhealthy air days in 30 yrs
- 4 days/yr
Risk factors via First Street. Map © Google.
Why this score? — see what drove the F grade
The composite is a weighted blend of 9 inputs, each scored 0–100. Each bar is that input's sub-score; the figure is the points it added to the 100-point composite (weight × sub-score).
- Cash flow +10.4/30.0
- Rent growth +4.9/5.0
- Schools +4.5/10.0
- Livability +3.9/5.0
- DSCR +3.0/10.0
- 1% rule +2.5/10.0
- Condition / age +2.5/5.0
- ARV discount +0.0/15.0
- Appreciation +0.0/10.0
$340,000
🖨 Deal sheet 📄 Offer letter ✓ Due diligence
Listing remarks MLS
SUPER CUTE, SPACIOUS, SPLIT LEVEL floor plan. HARDWOOD FLOORS throughout with Pottery Barn colors. Nicely appointed kitchen with loads of counterspace. Large master bedroom with ensuite bath. Nice family room & bath in walk-out lower level - plus, storage in the sub-basement. Primo lot on back of cul-de-sac, backing to trees. Great location. Great schools. AWESOME HOUSE!
Key facts
- 0.27 acre lot
- 2 garage spots
- Built 2002
Neighborhood map
What this means for you Summary
Snapshot
- This is a 3-bed/2.0-bath single-family listed at $340k.
Deal economics
- At list price, monthly cash flow is $-183 ($-2k/yr) — negative.
- To cash-flow at today's rent, offer at most $308k (9.5% below list).
- To meet the 1% rule (rent ≥ 1% of price), the offer needs to be $255k (25.0% below list).
- Recommended offer: $255k (25.0% below list) — sets the bar for 1% rule.
- Cap rate 5.6% vs local median 3.9% in Kansas City — top-decile yield for the area; either an underpriced asset or a hidden risk that comps aren't pricing in. Stress-test before assuming the spread holds.
Location & tenants
- Location reads 78/100 on livability (#28 in MO, #2,671 nationally) — a middle-class / working-renter tenant base. Strengths: amenities A+, commute A+, cost of living A+; Watch: crime F.
- Liberty 53 (suburban): math 41% / reading 59% proficiency, ranked #24 of 324 in MO (top 7%) — acceptable for families but not a draw, mixed tenant base, ~2y average lease; only 15% free/reduced lunch — higher-income household profile.
- Zoned schools: Kellybrook Elem School (math 39% / reading 47%, grade F, #473 of 1,115 statewide, top 43%, 522 students, 28% FRL); Liberty North High School (math 25% / reading 75%, grade D+, #116 of 521 statewide, top 22%, 2,326 students, 18% FRL).
- Market conditions: Rents rising fast (+9.5%/yr); 240 active listings in the ZIP; high-income renter base; 341 units permitted in Clay County in 2024 (40 in 5+ unit buildings).
Forward outlook
- Local home prices are declining (-3.0%/yr); year-one equity from $2k of loan paydown is wiped out by about $10k of value loss. Plan a longer hold.
- Clay County population projected at +24% by 2050 — long-run rental-demand tailwind backs the buy-and-hold thesis.
Negotiation context
- Only 2 days on market — expect competitive offers; lowballing is unlikely to land.
- 6 sale attempts since 26y ago with the ask held roughly flat each time — persistent listings suggest the price (not the market) is what's stuck; bring a comps-based counter.
Questions for the listing agent
- What do current leases actually rent for vs. the listed asking? Can we see a recent rent roll and the last 12 months of T-12 income?
- Is there a deadline driving the sale (1031 exchange, divorce, estate, relocation)? That informs how much negotiation room exists.
- Crime grade is F in this area — have there been break-ins, vandalism, or insurance claims at this property in the last 3 years? What carrier currently insures it and at what premium?
- The area grade is low — what's the realistic commute time and amenity access for the typical tenant pool here? Any planned neighborhood developments (good or bad) we should know about?
- What's the average days-on-market for RENTAL listings here right now (not sales)? A rising rental-DOM trend means longer vacancies and softer asking-rent achievability than the comps imply.
- What's the recent tenant-quality profile in this submarket — average credit score on applications, eviction rate, late-payment / NSF rate, and stable-employment percentage? A property-management company in the area should have these aggregated.
- How much new for-sale + rental construction is in the pipeline within 1–3 miles? Heavy new supply typically softens prices + rents 12–24 months out; constrained supply supports both.
Investment metrics
- 1% rule
- 0.75% ✗
- Cap rate
- 5.65%
- Cash-on-cash
- -2.31%
- DSCR
- 0.90
- GRM
- 11.1
CMA / ARV
- ARV (on-the-fly)
- $286,790
- Comps found
- 5
Show comp detail 5 sales within ~0.75 mi
| Address | Dist | Beds/Ba | Sqft | Sold | Price | $/sf | Match |
|---|---|---|---|---|---|---|---|
| 7905 NE 106th Ter | 0.39mi | 3/2.0 | 1,200 (+1%) | 17mo | $289,000 | $241 | 66 |
| 11009 N Lewis Ave | 0.54mi | 3/2.0 | 1,150 (-3%) | 9mo | $145,000 | $126 | 62 |
| 9038 NE 103rd Ter | 0.63mi | 2/2.0 (-1) | 1,176 (-1%) | 16mo | $299,900 | $255 | 50 |
| 11031 N Ditman Ct | 0.67mi | 3/2.0 | 1,360 (+14%) | 6mo | $325,000 | $239 | 40 |
| 8008 NE 110th Ter | 0.69mi | 3/3.0 | 1,362 (+14%) | 16mo | $365,000 | $268 | 27 |
Match score weights: distance 35% · size 25% · config 20% · recency 20%. Top-matched comps best support the ARV.
Projected returns pro-forma
-3.0% appreciation · 8.0% rent growth · sell at horizon
- IRR
- -15.1%
- Equity multiple
- 0.44×
- Total profit
- $-53,350
- Equity at exit
- $50,695
- IRR
- -0.0%
- Equity multiple
- 1.00×
- Total profit
- $-384
- Equity at exit
- $29,397
Cash invested: $95,200 (down + closing). Projections, not guarantees.
Landlord ↔ Tenant lean methodology
- Overall (STATE)
- 81 Strongly Landlord-Friendly
- State Missouri
- 81 Strongly Landlord-Friendly · R+10
- County
- — inherits STATE
- City
- — inherits STATE
ZIP-level market 64157
- Home prices YoY
- -18.1%
- Rents YoY
- 9.5%
- Active inventory
- 240
- Price-to-rent
- 11.1×
Monthly cashflow live
- Estimated rent
- $2,550 medium interval (Pro) →
- Mortgage (P&I)
- −$1,783
- Tax from tax record
- −$273 /mo · $3,275/yr
- Insurance
- −$142
- HOA
- −$0
- Vacancy / Maint / Mgmt
- −$535
- Net cashflow
- $-183
Break-even live
UW: 25.0% down · 7.5% · 30yr · 1.5% tax · 5.0% vac · 8.0% maint · 8.0% mgmt
Financing live
Cash to close
- Down payment
- $85,000
- Closing costs
- $10,200
- Reserves months
- —
- Total cash needed
- —
Loan-product check · same deal, 3 products live
Conventional
25% down · 7.5% · 30yr
- Down + closing
- —
- Monthly P&I
- —
- Monthly cashflow
- —
- DSCR
- —
- Eligible?
- —
Personal DTI + credit; lowest rate.
DSCR
20% down · 8.5% · 30yr
- Down + closing
- —
- Monthly P&I
- —
- Monthly cashflow
- —
- DSCR
- —
- Eligible?
- —
No personal income docs; deal must DSCR.
Hard money
10% down · 12.0% · 12mo
- Down + closing
- —
- Monthly P&I
- —
- Monthly cashflow
- —
- DSCR
- —
- Eligible?
- —
Short-term bridge; refi at stabilization.
Listing history 18 events
-
2026-03-29status Pending
-
2026-03-27$340,000 Active
-
2026-03-07historical $340,000
-
2017-10-31soldstatus
-
2017-10-30soldstatus Sold 379-char remark
Show marketing remark (379 chars)
SUPER CUTE, SPACIOUS, SPLIT LEVEL floor plan. HARDWOOD FLOORS throughout with Pottery Barn colors. Nicely appointed kitchen with loads of counterspace. Large master bedroom with ensuite bath. Nice family room & bath in walk-out lower level - plus, storage in the sub-basement. Primo lot on back of cul-de-sac, backing to trees. Great location. Great schools. AWESOME HOUSE!
-
2017-10-10status Pending 379-char remark
Show marketing remark (379 chars)
SUPER CUTE, SPACIOUS, SPLIT LEVEL floor plan. HARDWOOD FLOORS throughout with Pottery Barn colors. Nicely appointed kitchen with loads of counterspace. Large master bedroom with ensuite bath. Nice family room & bath in walk-out lower level - plus, storage in the sub-basement. Primo lot on back of cul-de-sac, backing to trees. Great location. Great schools. AWESOME HOUSE!
-
2017-09-18historical Contingent - Accepting Backup Offers 379-char remark
Show marketing remark (379 chars)
SUPER CUTE, SPACIOUS, SPLIT LEVEL floor plan. HARDWOOD FLOORS throughout with Pottery Barn colors. Nicely appointed kitchen with loads of counterspace. Large master bedroom with ensuite bath. Nice family room & bath in walk-out lower level - plus, storage in the sub-basement. Primo lot on back of cul-de-sac, backing to trees. Great location. Great schools. AWESOME HOUSE!
-
2017-09-15$180,000 Active 379-char remark
Show marketing remark (379 chars)
SUPER CUTE, SPACIOUS, SPLIT LEVEL floor plan. HARDWOOD FLOORS throughout with Pottery Barn colors. Nicely appointed kitchen with loads of counterspace. Large master bedroom with ensuite bath. Nice family room & bath in walk-out lower level - plus, storage in the sub-basement. Primo lot on back of cul-de-sac, backing to trees. Great location. Great schools. AWESOME HOUSE!
-
2012-12-26soldstatus
-
2012-12-20soldstatus 284-char remark
Show marketing remark (284 chars)
WONDERFUL BACK OF CUL-DE-SAC LOCATION IN LIBERTY NORTH HIGH SCHOOL DSTR * LARGE FENCED YARD BACKS TO GREEN SPACE * 9' CEILINGS AND HARDWOOD FLOORS THRU-OUT * FINISHED WALKOUT LL W/ 1/2 BATH PLUS SUB BASEMNT FOR STORAGE * POTTERY BARN COLORS * NEW ROOF & EXTERIOR PAINT! SHOW IT!
-
2012-10-19$149,900 284-char remark
Show marketing remark (284 chars)
WONDERFUL BACK OF CUL-DE-SAC LOCATION IN LIBERTY NORTH HIGH SCHOOL DSTR * LARGE FENCED YARD BACKS TO GREEN SPACE * 9' CEILINGS AND HARDWOOD FLOORS THRU-OUT * FINISHED WALKOUT LL W/ 1/2 BATH PLUS SUB BASEMNT FOR STORAGE * POTTERY BARN COLORS * NEW ROOF & EXTERIOR PAINT! SHOW IT!
-
2010-05-14historical
-
2010-01-13$158,600
-
2005-06-23soldstatus
-
2005-06-22soldstatus
-
2005-04-21$159,900
-
2001-05-09soldstatus
-
2000-06-22$140,000
ⓘ Source: listings_history table (triggers on properties + properties_extension) + one-shot
backfill from property_details.listing_events for pre-trigger history.
Tax reassessment forecast MO · Resets to sale price
- Current annual tax
- $3,275 · $273/mo
- Projected year-2 tax
- $3,298 · $275/mo
- Expected delta
- +$23/yr (+$2/mo · 0.7%)
ⓘ Screening estimate from a state-policy table — verify with the county assessor before closing.
Climate risk First Street
- Flood 1/10 Low FEMA zone X (unshaded) · 0% chance over 30 yrs
- Wildfire 4/10 Moderate
- Heat 4/10 Moderate 7 d/yr ≥105°F today · 17 d/yr by 30 yrs out
- Wind 2/10 Low
- Air quality 3/10 Moderate 3 unhealthy d/yr today · 4 by 30 yrs out
Nearby sold comps map
Loading sold comps map…
Walkable amenities ~0.75 mi
Loading nearby amenities…
Taxation est. · year 1
- Rental income
- $30,596
- − Mortgage interest
- −$19,045
- − Property taxes
- −$3,275
- − Insurance
- −$1,700
- − Repairs & maintenance
- −$2,448
- − Management
- −$2,448
- − Depreciation
- −$9,891
- Taxable loss
- −$8,210
- Est. tax savings @ 24.0%
- +$1,970
- After-tax cash flow
- $-229/yr
For passive investors: Depreciation is non-cash, so a rental often shows a tax loss while cash-flowing — sheltering income. Rental losses are passive: they offset passive income freely, and up to $25,000/yr can offset ordinary (W-2) income if you actively participate and your MAGI is under $100k (phasing out to $0 by $150k); unused losses carry forward. On sale, claimed depreciation is recaptured at up to 25%, and gains may owe capital-gains tax (a 1031 exchange can defer both). Figures are a year-1 estimate at your 24.0% rate — not tax advice; consult a CPA.
Schools (NCES district)
- District
- Liberty 53
- NCES district ID
- 2918540
- Math proficiency
- 41% ▼ -9.00%
- Reading proficiency
- 59% ▼ -3.00%
- Median HH income
- $78,226
- Composite
- 45.41/100
- National rank
- #2624
- State rank
- #24 of 324 in MO
Livability — Kansas City
- Score
- 78/100
- State rank
- #28
- US rank
- #2671
Category grades
Schools grade is shown separately in the Schools card above.
Census & demographics
- Census place
- Kansas City, MO
- County
- Clay County · 220,651 people
- City population
- 439,467
- Metro
- Kansas City, MO-KS
- Population (ZIP)
- 23,030
- Household income
- $149,526
- Rent vs Own
- Severe rent burden
- 87.0
Population outlook (Clay County) Hauer SSP2
- Today (2025)
- 266,022 people
- By 2030
- 280,057 · +5.3%
- By 2040
- 306,153 · +15.1%
- By 2050
- 328,630 · +23.5%
- By 2075
- 375,182 · +41.0%
- By 2100
- 392,861 · +47.7%
Race, ethnicity, and origin ACS 2023
- Neighborhood character
- Predominantly White (82%)
- Race & ethnicity
- White 82% Asian 7% Two or more races 6% Hispanic / Latino 5% Black 3%
- Common ancestry
- Slovak 3% Italian 2% Lithuanian 2%
- Foreign-born
- 6% · Canada, Vietnam, China
- Languages at home
- 92% English-only · Spanish 3% Other Asian/Pacific 2% Vietnamese 1%
Political lean MEDSL · Clay
- 2024 margin
- Lean R (+5.6) · D 46.4% · R 52.0% · Other 1.6%
- 2008→2024 swing
- -4.9pp toward R · 2008: -0.7pp · 2024: -5.6pp
- All cycles
- 2024: R+5.6 2020: R+4.1 2016: R+11.1 2012: R+8.4 2008: R+0.7
Not yet ingested
- Civics
- —
Market trends
- HPI YoY
- ▼ -43.38%
- Current HPI
- 195.9921
- Rent YoY
- ▲ 9.50%
- Metro
- Kansas City, MO-KS
- State GDP YoY
- ▲ 1.84%
- F500 in state
- 20
Industry mix (Fortune 500 HQ in MO)
| Industry | F500 HQs | Revenue |
|---|---|---|
| Healthcare | 1 | $163B |
|
||
| Insurance | 1 | $21B |
|
||
| Industrial Technology | 1 | $17B |
|
||
| Retail | 1 | $16B |
|
||
| Industrial Distribution | 1 | $10B |
|
||
| Utilities | 1 | $9B |
|
||
Price history
+142.9% since first listed18 events — show timeline
- 2026-03-29 Pending — Heartland MLS as Distributed by MLS Grid
- 2026-03-27 Listed $340,000 Heartland MLS as Distributed by MLS Grid
- 2026-03-07 Coming Soon $340,000 Heartland MLS as Distributed by MLS Grid
- 2017-10-31 Sold (Public Records) — Public Records
- 2017-10-30 Sold (MLS) — Heartland MLS as Distributed by MLS Grid
- 2017-10-10 Pending — Heartland MLS as Distributed by MLS Grid
- 2017-09-18 Contingent — Heartland MLS as Distributed by MLS Grid
- 2017-09-15 Listed $180,000 Heartland MLS as Distributed by MLS Grid
- 2012-12-26 Sold (Public Records) — Public Records
- 2012-12-20 Sold (MLS) — Heartland MLS as Distributed by MLS Grid
- 2012-10-19 Listed $149,900 Heartland MLS as Distributed by MLS Grid
- 2010-05-14 Listing Removed — Heartland MLS as Distributed by MLS Grid
- 2010-01-13 Listed $158,600 Heartland MLS as Distributed by MLS Grid
- 2005-06-23 Sold (Public Records) — Public Records
- 2005-06-22 Sold (MLS) — Heartland MLS as Distributed by MLS Grid
- 2005-04-21 Listed $159,900 Heartland MLS as Distributed by MLS Grid
- 2001-05-09 Sold (MLS) — Heartland MLS as Distributed by MLS Grid
- 2000-06-22 Listed $140,000 Heartland MLS as Distributed by MLS Grid
Property tax history
+3.7%/yrLatest (2025): $3,275 · +8.5% YoY. Source: county tax records.
Cash-flow waterfall
monthlySold comps — $/sqft
last 12 mo · ≤1 miLoading sold comps…