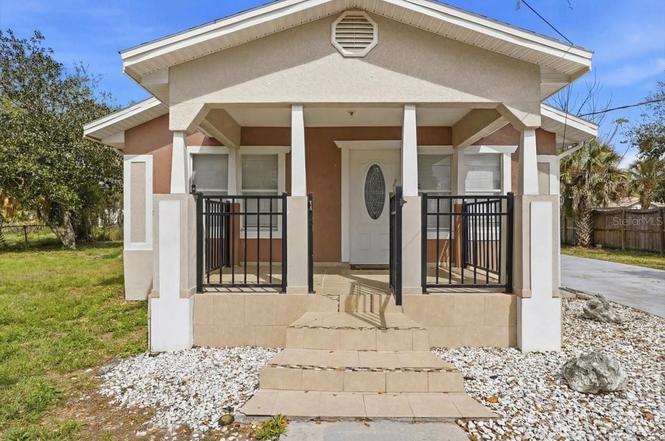
2628 Fletcher Ave · Lakeland, FL
Flood risk 1/10 · Minimal
- FEMA flood zone
- X (unshaded)
- Chance of flooding over 30 yrs
- 0.0%
- Est. flood insurance / yr
- $507 – $1,088
Fire risk 3/10 · Minor
- Est. fire insurance / yr
- $947 – $1,759
Heat risk 9/10 · Severe
- Hot days now (above 108°F)
- 7 days/yr
- Hot days in 30 yrs
- 24 days/yr
Wind risk 9/10 · Severe
- Chance of severe wind over 30 yrs
- 99.0%
Air-quality risk 2/10 · Minimal
- Unhealthy air days now
- 1 days/yr
- Unhealthy air days in 30 yrs
- 2 days/yr
Risk factors via First Street. Map © Google.
Why this score? — see what drove the D+ grade
The composite is a weighted blend of 9 inputs, each scored 0–100. Each bar is that input's sub-score; the figure is the points it added to the 100-point composite (weight × sub-score).
- Cash flow +15.5/30.0
- ARV discount +7.5/15.0
- Appreciation +5.9/10.0
- DSCR +4.8/10.0
- Livability +3.9/5.0
- Schools +3.5/10.0
- 1% rule +3.4/10.0
- Rent growth +2.5/5.0
- Condition / age +2.5/5.0
$180,000
🖨 Deal sheet 📄 Offer letter ✓ Due diligence
Listing remarks
Two (2) Extra bonus room!! Welcome to 2628 Fletcher Ave in the heart of Eaton Park! This charming 2-bedroom, 1-bath home offers fresh updates including modern vinyl flooring and plenty of natural light throughout. The spacious layout provides comfortable living, while the oversized backyard is perfect for entertaining, pets, or creating your own outdoor oasis. With minor upgrades already completed, this home is move-in ready yet leaves room for you to add your personal touch. Conveniently located near shopping, dining, and major roadways, this property combines comfort, value, and an excellent location. Outside, the expansive backyard is a true highlight, offering endless opportunities for
Key facts
- Move-in ready
- Natural light
- Excellent location
Tags
Property features AI
Finance
- Other: Property type: Residential, Single Family Residence; Zoning: R-3; Lot size approximately 0.34 acres (about 1/4 to less than 1/2 acre); Living area reported as 969 square feet (building area 1,006 sq ft); Directions available to property
- Financial info: Tax information available but excluded
- HOA & community: No HOA
Exterior
- Parking: Parking details not specified
- Security: No security features listed
- Utilities: Public water; Public sewer; Other utilities (unspecified)
- Home design: Single-family residence; One story; East-facing
- Construction: Block construction; Shingle roof; Block foundation; Built on one level
- Exterior features: Balcony; Other exterior features (unspecified); Asphalt road access
Interior
- Kitchen: Range; Microwave; Refrigerator; Dishwasher not listed
- Bedrooms: 2 bedrooms
- Flooring: Laminate flooring
- Bathrooms: 1 full bathroom
- Heating & cooling: No heating system listed; Central air conditioning
- Interior features: No notable interior features listed
- Laundry & utility: Inside laundry with Washer and Dryer
Neighborhood map
What this means for you Summary
Snapshot
- This is a 2-bed/1.0-bath single-family listed at $180k.
Deal economics
- At list price, monthly cash flow is $72 ($863/yr) — positive.
- The deal already cash-flows at list — no discount required.
- To meet the 1% rule (rent ≥ 1% of price), the offer needs to be $151k (16.3% below list).
- Recommended offer: $151k (16.3% below list) — sets the bar for 1% rule.
Location & tenants
- Location reads 77/100 on livability (#206 in FL, #3,179 nationally) — a middle-class / working-renter tenant base. Strengths: cost of living A+, housing A+, health & safety A+; Watch: employment D+, amenities F, commute F.
- Polk (suburban): math 39% / reading 43% proficiency, ranked #62 of 73 in FL (top 85%) — families likely to look elsewhere, expect single-tenant / working-renter base with shorter leases.
- Market conditions: 3 active listings in the ZIP; 20 comparable units currently listed for rent nearby; rentals at typical pace (median 15d on market — plan ~3-4 weeks tenant-placement turnaround); 10,384 units permitted in Polk County in 2024 (1,716 in 5+ unit buildings).
Forward outlook
- In year one you build about $4k of equity ($1k loan paydown + $3k appreciation (1.8% local appreciation)).
- Polk County population projected at +33% by 2050 — long-run rental-demand tailwind backs the buy-and-hold thesis.
- At projected returns (1.8% appreciation + 3.0% rent growth), your $50k cash investment doubles in ~8 years — after that, you're playing with house money.
- By year 8, paydown + projected appreciation supports a ~$34k cash-out refi (75% LTV) — recoverable capital for the next deal without selling this one.
Negotiation context
- It's been on market 277 days — a 12% lower offer ($158k) is reasonable based on typical stale-listing flexibility.
- 3 sale attempts since 19y ago; this cycle's ask has dropped $50k (22%) from the opening price — seller is motivated, your offer sets the floor, not the list.
Risks & watch-outs
- Watch-outs: built in 1951 — expect roof / HVAC / electrical / plumbing capex.
- Climate carrying-cost: severe wind risk, 99% chance of damaging wind over 30y; extreme-heat days projected 7→24/yr by 2055 (HVAC capex compounding) — expect insurance premiums to compound above CPI over the hold.
Questions for the listing agent
- It's been on market 277 days. Have you received any prior offers? Is the seller open to a 16% concession, seller financing, or rate buy-down credit?
- Built in 1951 — when were the roof, HVAC, electrical panel, plumbing, and water heater last replaced?
- Why hasn't it sold? Are there any deal-killer items the seller is aware of (foundation, flood, title, zoning, code violations)?
- Is there a deadline driving the sale (1031 exchange, divorce, estate, relocation)? That informs how much negotiation room exists.
- The area grade is low — what's the realistic commute time and amenity access for the typical tenant pool here? Any planned neighborhood developments (good or bad) we should know about?
- What's the average days-on-market for RENTAL listings here right now (not sales)? A rising rental-DOM trend means longer vacancies and softer asking-rent achievability than the comps imply.
- What's the recent tenant-quality profile in this submarket — average credit score on applications, eviction rate, late-payment / NSF rate, and stable-employment percentage? A property-management company in the area should have these aggregated.
- How much new for-sale + rental construction is in the pipeline within 1–3 miles? Heavy new supply typically softens prices + rents 12–24 months out; constrained supply supports both.
Investment metrics
- 1% rule
- 0.84% ✗
- Cap rate
- 6.77%
- Cash-on-cash
- 1.71%
- DSCR
- 1.08
- GRM
- 10.0
CMA / ARV
No comps found within radius.
Projected returns pro-forma
1.78% appreciation · 3.0% rent growth · sell at horizon
- IRR
- 5.5%
- Equity multiple
- 1.29×
- Total profit
- $14,826
- Equity at exit
- $68,823
- IRR
- 9.2%
- Equity multiple
- 2.21×
- Total profit
- $61,210
- Equity at exit
- $97,462
Cash invested: $50,400 (down + closing). Projections, not guarantees.
Landlord ↔ Tenant lean methodology
- Overall (STATE)
- 87 Strongly Landlord-Friendly
- State Florida
- 87 Strongly Landlord-Friendly · R+3
- County
- — inherits STATE
- City
- — inherits STATE
ZIP-level market 33840
- Home prices YoY
- 1.9%
- Active inventory
- 3
- Price-to-rent
- 10.0×
Monthly cashflow live
- Estimated rent
- $1,507 high interval (Pro) →
- Mortgage (P&I)
- −$944
- Tax from tax record
- −$100 /mo · $1,195/yr
- Insurance
- −$75
- HOA
- −$0
- Vacancy / Maint / Mgmt
- −$316
- Net cashflow
- $72
Break-even live
UW: 25.0% down · 7.5% · 30yr · 1.5% tax · 5.0% vac · 8.0% maint · 8.0% mgmt
Financing live
Cash to close
- Down payment
- $45,000
- Closing costs
- $5,400
- Reserves months
- —
- Total cash needed
- —
Loan-product check · same deal, 3 products live
Conventional
25% down · 7.5% · 30yr
- Down + closing
- —
- Monthly P&I
- —
- Monthly cashflow
- —
- DSCR
- —
- Eligible?
- —
Personal DTI + credit; lowest rate.
DSCR
20% down · 8.5% · 30yr
- Down + closing
- —
- Monthly P&I
- —
- Monthly cashflow
- —
- DSCR
- —
- Eligible?
- —
No personal income docs; deal must DSCR.
Hard money
10% down · 12.0% · 12mo
- Down + closing
- —
- Monthly P&I
- —
- Monthly cashflow
- —
- DSCR
- —
- Eligible?
- —
Short-term bridge; refi at stabilization.
Rent comps 20 comps
| Address | Beds | Baths | Sqft | Rent | $/sqft | DOM | Units | Dist |
|---|---|---|---|---|---|---|---|---|
| 2919 Maine Ave Lakeland, FL | 3.0 | 1.0 | 1134 | $1,275 | $1.12 | 14d | 1 | 0.39mi |
| 1922 Crystal Grove Dr #1922 Lakeland, FL | 2.0 | 2.0 | 1014 | $1,547 | $1.53 | 23d | 1 | 0.71mi |
| 3061 Crystal Hills Dr Lakeland, FL | 2.0 | 2.0 | 720 | $1,400 | $1.94 | 23d | 1 | 0.73mi |
| 1969 Crystal Grove Dr Lakeland, FL | 2.0 | 1.0–2.0 | 576 | $1,415 | $2.46 | 3d | 8 | 0.79mi |
| 2524 Kiwanis Ave Lakeland, FL | 3.0 | 1.5 | 1468 | $1,670 | $1.14 | 12d | 1 | 0.85mi |
| 1803 Venus St Lakeland, FL | 3.0 | 2.0 | 1259 | $1,645 | $1.31 | 3d | 1 | 0.86mi |
| 2402 Kiwanis Ave Unit 1258725P Lakeland, FL | 3.0 | 1.0 | 1194 | $3,262 | $2.73 | 14d | 1 | 0.89mi |
| 2020 E Edgewood Dr Lakeland, FL | 2.0 | 1.5 | 1200 | $1,395 | $1.16 | 3d | 1 | 1.02mi |
| 2025 Sylvester Rd Unit N109 Lakeland, FL | 2.0 | 2.0 | 1099 | $1,750 | $1.59 | 3d | 1 | 1.02mi |
| 3306 Peachtree Hill Rd Lakeland, FL | 2.0 | 1.0 | 742 | $1,195 | $1.61 | 14d | 1 | 1.05mi |
| 3321 Peachtree Hill Rd Lakeland, FL | 3.0 | 2.0 | 960 | $1,475 | $1.54 | 14d | 1 | 1.07mi |
| 2025 Sylvester Rd Lakeland, FL | 1.0–2.0 | 1.0–2.0 | 1099 | $1,850 | $1.68 | 23d | 2 | 1.09mi |
| 1505 Goodyear Ave Unit 17 Lakeland, FL | 2.0 | 1.0 | 792 | $950 | $1.20 | 23d | 1 | 1.14mi |
| 2830 Skyview Dr Lakeland, FL | 2.0 | 1.0 | 850 | $1,175 | $1.38 | 23d | 1 | 1.15mi |
| 2839 8 Iron Dr Unit 2841 Lakeland, FL | 2.0 | 1.5 | 900 | $1,397 | $1.55 | 23d | 1 | 1.17mi |
| 1920 E Edgewood Dr Lakeland, FL | 2.0 | 1.0–2.0 | 831 | $1,388 | $1.67 | 3d | 2 | 1.21mi |
| 3021 Balfour Ave Lakeland, FL | 2.0 | 1.0 | 816 | $1,275 | $1.56 | 3d | 1 | 1.22mi |
| 2929 Nine Iron Dr Lakeland, FL | 2.0 | 1.0 | 850 | $875 | $1.03 | 3d | 1 | 1.29mi |
| 1323 Tom Watson Rd Lakeland, FL | 2.0 | 1.0 | 800 | $1,350 | $1.69 | 23d | 1 | 1.45mi |
| 4116 Winding Vine Dr Lakeland, FL | 2.0 | 2.5 | 1224 | $1,499 | $1.22 | 3d | 1 | 1.49mi |
Listing history 21 events
-
2026-06-18days on market $180,000 Active 277 DOM
-
2026-06-17days on market $180,000 Active 276 DOM
-
2026-06-16days on market $180,000 Active 275 DOM
-
2026-06-15days on market $180,000 Active 274 DOM
-
2026-06-13days on market $180,000 Active 272 DOM
-
2026-06-10days on market $180,000 Active 270 DOM
-
2026-06-09days on market $180,000 Active 269 DOM
-
2026-06-08days on market $180,000 Active 268 DOM
-
2026-06-07days on market $180,000 Active 267 DOM
-
2026-06-05days on market $180,000 Active 265 DOM
-
2026-06-03days on market $180,000 Active 263 DOM
-
2026-06-01days on market $180,000 Active 262 DOM
-
2026-05-31days on market $180,000 Active 261 DOM
-
2026-04-28price $180,000
-
2026-03-17status Active
-
2026-02-23historical
-
2025-12-03price $200,000
-
2025-11-04price $220,000
-
2025-08-21$229,990 Active
-
2008-01-31historical
-
2007-08-01$59,995
ⓘ Source: listings_history table (triggers on properties + properties_extension) + one-shot
backfill from property_details.listing_events for pre-trigger history.
Tax reassessment forecast FL · Resets to sale price
- Current annual tax
- $1,195 · $100/mo
- Projected year-2 tax
- $1,494 · $124/mo
- Expected delta
- +$299/yr (+$25/mo · 25.1%)
ⓘ Screening estimate from a state-policy table — verify with the county assessor before closing.
Climate risk First Street
- Flood 1/10 Low FEMA zone X (unshaded) · 0% chance over 30 yrs
- Wildfire 3/10 Moderate
- Heat 9/10 Extreme 7 d/yr ≥108°F today · 24 d/yr by 30 yrs out
- Wind 9/10 Extreme 99% chance of damaging wind over 30 yrs
- Air quality 2/10 Low 1 unhealthy d/yr today · 2 by 30 yrs out
Nearby sold comps map
Loading sold comps map…
Walkable amenities ~0.75 mi
Loading nearby amenities…
Taxation est. · year 1
- Rental income
- $18,083
- − Mortgage interest
- −$10,083
- − Property taxes
- −$1,195
- − Insurance
- −$900
- − Repairs & maintenance
- −$1,447
- − Management
- −$1,447
- − Depreciation
- −$5,236
- Taxable loss
- −$2,224
- Est. tax savings @ 24.0%
- +$534
- After-tax cash flow
- $1,397/yr
For passive investors: Depreciation is non-cash, so a rental often shows a tax loss while cash-flowing — sheltering income. Rental losses are passive: they offset passive income freely, and up to $25,000/yr can offset ordinary (W-2) income if you actively participate and your MAGI is under $100k (phasing out to $0 by $150k); unused losses carry forward. On sale, claimed depreciation is recaptured at up to 25%, and gains may owe capital-gains tax (a 1031 exchange can defer both). Figures are a year-1 estimate at your 24.0% rate — not tax advice; consult a CPA.
Schools (NCES district)
- District
- Polk
- NCES district ID
- 1201590
- Math proficiency
- 39% ▼ -11.00%
- Reading proficiency
- 43% ▼ -4.00%
- Median HH income
- $43,979
- Composite
- 34.74/100
- National rank
- #5132
- State rank
- #62 of 73 in FL
Livability — Lakeland
- Score
- 77/100
- State rank
- #206
- US rank
- #3179
Category grades
Schools grade is shown separately in the Schools card above.
Census & demographics
No demographic data for this ZIP.
Market trends
- HPI YoY
- ▲ 1.78%
- Current HPI
- 94.1521
- Rent YoY
- —
- Metro
- —
- State GDP YoY
- ▲ 3.28%
- F500 in state
- 36
Industry mix (Fortune 500 HQ in FL)
| Industry | F500 HQs | Revenue |
|---|---|---|
| Industrial Technology | 2 | $29B |
|
||
| Insurance | 2 | $17B |
|
||
| Retail | 1 | $60B |
|
||
| Technology Distribution | 1 | $58B |
|
||
| Homebuilding | 1 | $35B |
|
||
| Technology Manufacturing | 1 | $35B |
|
||
Price history
+200.0% since first listed8 events — show timeline
- 2026-04-28 Price Changed $180,000 Stellar MLS as Distributed by MLS Grid
- 2026-03-17 Relisted — Stellar MLS as Distributed by MLS Grid
- 2026-02-23 Listing Removed — Stellar MLS as Distributed by MLS Grid
- 2025-12-03 Price Changed $200,000 Stellar MLS as Distributed by MLS Grid
- 2025-11-04 Price Changed $220,000 Stellar MLS as Distributed by MLS Grid
- 2025-08-21 Listed $229,990 Stellar MLS as Distributed by MLS Grid
- 2008-01-31 Listing Removed — Stellar MLS as Distributed by MLS Grid
- 2007-08-01 Listed $59,995 Stellar MLS as Distributed by MLS Grid
Property tax history
+9.8%/yrLatest (2025): $1,195 · -39.4% YoY. Source: county tax records.
Cash-flow waterfall
monthlySold comps — $/sqft
last 12 mo · ≤1 miLoading sold comps…