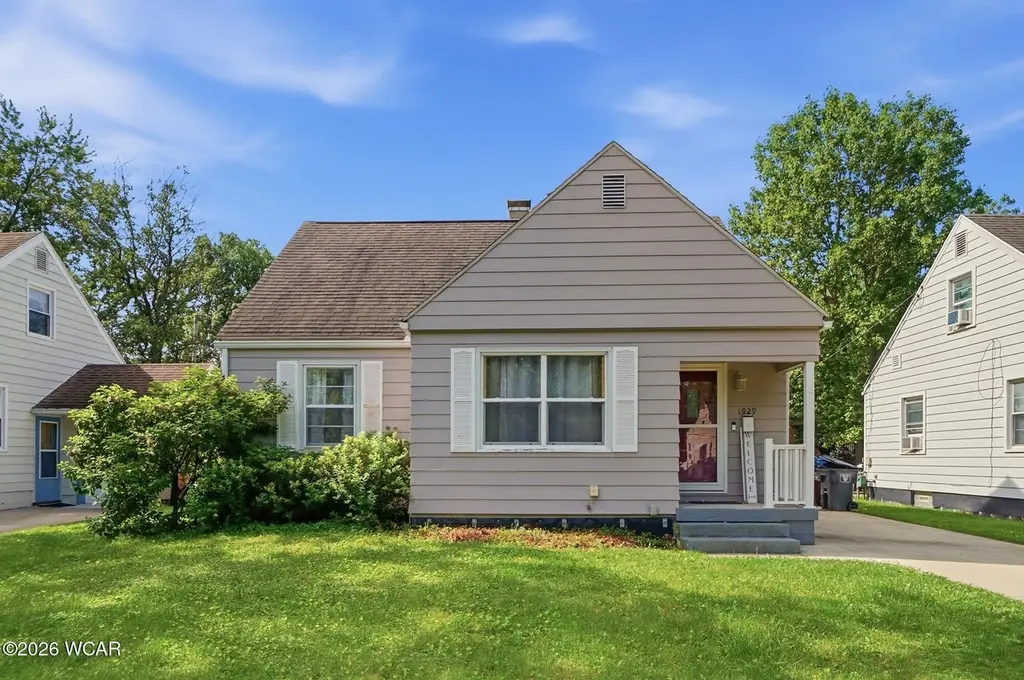
1929 W Wayne St · Lima, OH
Flood risk 4/10 · Minor
- FEMA flood zone
- X (unshaded)
- Chance of flooding over 30 yrs
- 0.22%
- Est. flood insurance / yr
- $473 – $860
Fire risk 1/10 · Minimal
- Est. fire insurance / yr
- $713 – $1,323
Heat risk 3/10 · Minor
- Hot days now (above 100°F)
- 7 days/yr
- Hot days in 30 yrs
- 18 days/yr
Wind risk 2/10 · Minimal
- Chance of severe wind over 30 yrs
- —
Air-quality risk 2/10 · Minimal
- Unhealthy air days now
- 1 days/yr
- Unhealthy air days in 30 yrs
- 2 days/yr
Risk factors via First Street. Map © Google.
Why this score? — see what drove the D- grade
The composite is a weighted blend of 9 inputs, each scored 0–100. Each bar is that input's sub-score; the figure is the points it added to the 100-point composite (weight × sub-score).
- Cash flow +15.7/30.0
- DSCR +4.8/10.0
- ARV discount +3.9/15.0
- 1% rule +3.6/10.0
- Livability +3.2/5.0
- Schools +2.6/10.0
- Rent growth +2.5/5.0
- Condition / age +2.5/5.0
- Appreciation +0.0/10.0
$179,900
🖨 Deal sheet (PDF) 📄 Offer letter ✓ Due diligence
Listing remarks MLS
Welcome to 1929 West Wayne Street! This 3 bedroom 1.5 bath home features an updated kitchen, updated bathrooms, newer flooring and has been very well maintained. Full basement, 1 car detached garage with covered patio and a fenced-in backyard. Call to set up a tour today!, Under 1 Acre
Key facts
- Fenced in backyard
- Full basement
- Covered patio
Tags
Property features AI
Exterior
- Parking: Detached garage (1 car)
- Utilities: Public water; Public sewer
- Home design: Single-family residence; Residential property
- Construction: Block foundation
- Exterior features: Residential zoning
Interior
- Kitchen: Dishwasher
- Bedrooms: 6 total rooms (bedroom count not specified)
- Bathrooms: 1 full bathroom; 1 half bathroom
- Heating & cooling: Forced air heating; Central air conditioning
- Interior features: Dishwasher; Full basement
Neighborhood map
What this means for you Summary
Snapshot
- This is a 2-bed/1.0-bath single-family listed at $180k.
Deal economics
- At list price, monthly cash flow is $79 ($943/yr) — positive.
- The deal already cash-flows at list — no discount required.
- To meet the 1% rule (rent ≥ 1% of price), the offer needs to be $154k (14.3% below list).
- Recommended offer: $154k (14.3% below list) — sets the bar for 1% rule.
Location & tenants
- Location reads 64/100 on livability (#787 in OH) — a middle-class / working-renter tenant base. Strengths: cost of living A+, housing A+, health & safety A-; Watch: crime F, amenities F, commute F.
- Lima City (urban): math 29% / reading 36% proficiency, ranked #575 of 656 in OH (top 88%) — families likely to look elsewhere, expect single-tenant / working-renter base with shorter leases; 83% free/reduced lunch — lower-income household profile, screen leases tightly.
- Zoned schools: Heritage Elementary School (math 42% / reading 32%, grade F, #1,087 of 1,584 statewide, top 70%, 421 students, 0% FRL); Lima West Middle School (math 22% / reading 24%, grade F, #600 of 654 statewide, top 92%, 352 students, 0% FRL); Lima Senior High School (math 16% / reading 42%, grade F, #627 of 781 statewide, top 81%, 1,013 students, 0% FRL) — zoned schools average 0% FRL vs 83% district-wide (83 pts lower); this property's tenant base skews higher-income than the district average.
- Market conditions: 107 active listings in the ZIP; 5 comparable units currently listed for rent nearby; rentals lingering (median 46d on market — plan ~5-8 weeks vacancy on turnover, expect pricing pressure); 100% of comp listings sitting > 30 days — soft ceiling on asking rent; 88 units permitted in Allen County in 2024 (0 in 5+ unit buildings).
Forward outlook
- Local home prices are declining (-3.0%/yr); year-one equity from $1k of loan paydown is wiped out by about $5k of value loss. Plan a longer hold.
- Allen County population projected at -14% by 2050 — secular population decline; favor cash flow + early exit over multi-decade hold.
Negotiation context
- Only 10 days on market — expect competitive offers; lowballing is unlikely to land.
- 2 sale attempts since 5y ago with the ask held roughly flat each time — persistent listings suggest the price (not the market) is what's stuck; bring a comps-based counter.
- Current owner paid $124k; 46% above their basis — modest negotiation headroom, anchor on the comps not their cost.
Risks & watch-outs
- Watch-outs: built in 1952 — expect roof / HVAC / electrical / plumbing capex.
Questions for the listing agent
- Built in 1952 — when were the roof, HVAC, electrical panel, plumbing, and water heater last replaced?
- Is there a deadline driving the sale (1031 exchange, divorce, estate, relocation)? That informs how much negotiation room exists.
- Crime grade is F in this area — have there been break-ins, vandalism, or insurance claims at this property in the last 3 years? What carrier currently insures it and at what premium?
- The area grade is low — what's the realistic commute time and amenity access for the typical tenant pool here? Any planned neighborhood developments (good or bad) we should know about?
- What's the average days-on-market for RENTAL listings here right now (not sales)? A rising rental-DOM trend means longer vacancies and softer asking-rent achievability than the comps imply.
- What's the recent tenant-quality profile in this submarket — average credit score on applications, eviction rate, late-payment / NSF rate, and stable-employment percentage? A property-management company in the area should have these aggregated.
- How much new for-sale + rental construction is in the pipeline within 1–3 miles? Heavy new supply typically softens prices + rents 12–24 months out; constrained supply supports both.
Investment metrics
- 1% rule
- 0.86% ✗
- Cap rate
- 6.82%
- Cash-on-cash
- 1.87%
- DSCR
- 1.08
- GRM
- 9.7
CMA / ARV
- ARV (on-the-fly)
- $166,600
- Comps found
- 12
Show comp detail 12 sales within ~0.75 mi
| Address | Dist | Beds/Ba | Sqft | Sold | Price | $/sf | Match |
|---|---|---|---|---|---|---|---|
| 1607 W Wayne St | 0.26mi | 2/1.5 | 1,176 (-4%) | 1mo | $125,000 | $106 | 79 |
| 1716 Oakland Pkwy Pkwy | 0.18mi | 2/2.5 | 1,265 (+3%) | 2mo | $198,500 | $157 | 78 |
| 2011 W Wayne St | 0.11mi | 3/1.0 (+1) | 1,114 (-9%) | 1mo | $184,900 | $166 | 74 |
| 1810 Rice Ave | 0.40mi | 3/1.0 (+1) | 1,221 (-0%) | 4mo | $105,500 | $86 | 73 |
| 705 Cornell Dr | 0.37mi | 2/2.0 | 1,264 (+3%) | 1mo | $231,000 | $183 | 73 |
| 660 Columbia Dr | 0.55mi | 3/1.5 (+1) | 1,209 (-1%) | 1mo | $159,900 | $132 | 64 |
| 1605 Hazel Ave | 0.45mi | 2/2.0 | 1,140 (-7%) | 2mo | $160,000 | $140 | 62 |
| 910 N Dale Dr | 0.50mi | 2/1.0 | 1,323 (+8%) | 2mo | $153,000 | $116 | 61 |
| 2250 Kunneke Ave | 0.74mi | 3/1.0 (+1) | 1,154 (-6%) | 3mo | $165,000 | $143 | 48 |
| 1407 Latham Ave | 0.68mi | 3/1.0 (+1) | 1,066 (-13%) | 2mo | $130,000 | $122 | 40 |
| 1245 Latham Ave | 0.74mi | 3/1.0 (+1) | 1,066 (-13%) | 2mo | $145,000 | $136 | 38 |
| 1032 Woodland Dr | 0.69mi | 3/2.0 (+1) | 1,404 (+15%) | 1mo | $125,000 | $89 | 33 |
Match score weights: distance 35% · size 25% · config 20% · recency 20%. Top-matched comps best support the ARV.
Projected returns pro-forma
-3.0% appreciation · 3.0% rent growth · sell at horizon
- IRR
- -13.4%
- Equity multiple
- 0.52×
- Total profit
- $-24,185
- Equity at exit
- $26,824
- IRR
- -4.5%
- Equity multiple
- 0.71×
- Total profit
- $-14,778
- Equity at exit
- $15,554
Cash invested: $50,372 (down + closing). Projections, not guarantees.
Landlord ↔ Tenant lean methodology
- Overall (STATE)
- 73 Landlord-Friendly
- State Ohio
- 73 Landlord-Friendly · R+6
- County
- — inherits STATE
- City
- — inherits STATE
ZIP-level market 45805
- Active inventory
- 107
- Price-to-rent
- 9.7×
Monthly cashflow live
- Estimated rent
- $1,542 high interval (Pro) →
- Mortgage (P&I)
- −$943
- Tax from tax record
- −$121 /mo · $1,451/yr
- Insurance
- −$75
- HOA
- −$0
- Vacancy / Maint / Mgmt
- −$324
- Net cashflow
- $79
Break-even live
Sensitivity live
| Price | -10% $180 | -5% $130 | +0% $79 | +5% $28 | +10% $-23 |
|---|---|---|---|---|---|
| Rent | -10% $-43 | -5% $18 | +0% $79 | +5% $140 | +10% $200 |
| Rate | -1.0pp $169 | -0.5pp $124 | base $79 | +0.5pp $32 | +1.0pp $-15 |
UW: 25.0% down · 7.5% · 30yr · 1.5% tax · 5.0% vac · 8.0% maint · 8.0% mgmt
Financing live
Cash to close
- Down payment
- $44,975
- Closing costs
- $5,397
- Reserves months
- —
- Total cash needed
- —
Loan-product check · same deal, 3 products live
Conventional
25% down · 7.5% · 30yr
- Down + closing
- —
- Monthly P&I
- —
- Monthly cashflow
- —
- DSCR
- —
- Eligible?
- —
Personal DTI + credit; lowest rate.
DSCR
20% down · 8.5% · 30yr
- Down + closing
- —
- Monthly P&I
- —
- Monthly cashflow
- —
- DSCR
- —
- Eligible?
- —
No personal income docs; deal must DSCR.
Hard money
10% down · 12.0% · 12mo
- Down + closing
- —
- Monthly P&I
- —
- Monthly cashflow
- —
- DSCR
- —
- Eligible?
- —
Short-term bridge; refi at stabilization.
Rent comps 5 comps
| Address | Beds | Baths | Sqft | Rent | $/sqft | DOM | Units | Dist |
|---|---|---|---|---|---|---|---|---|
| 1436 W High St Lima, OH | 2.0 | 1.0 | 1205 | $895 | $0.74 | 45d | 1 | 0.48mi |
| 405 N Kenilworth Ave Lima, OH | 3.0 | 1.0 | 1352 | $1,795 | $1.33 | 45d | 1 | 0.60mi |
| 608 S Primrose Pl Lima, OH | 3.0 | 2.0 | 1200 | $2,500 | $2.08 | 45d | 1 | 0.74mi |
| 1014 W Market St Apt 3 Lima, OH | 2.0 | 1.0 | 800 | $1,400 | $1.75 | 45d | 1 | 0.86mi |
| 420 N Baxter St Lima, OH | 3.0 | 2.0 | 1386 | $1,200 | $0.87 | 45d | 1 | 1.29mi |
Listing history 8 events
-
2026-06-22days on market $179,900 Active 10 DOM
-
2026-06-19days on market $179,900 Active 7 DOM
-
2026-06-18days on market $179,900 Active 6 DOM
-
2026-06-17days on market $179,900 Active 5 DOM
-
2026-06-16days on market $179,900 Active 4 DOM
-
2026-06-15days on market $179,900 Active 3 DOM
-
2026-06-13remarks 699-char remark
-
2026-06-13$179,900 Active 1 DOM
ⓘ Source: listings_history table (triggers on properties + properties_extension) + one-shot
backfill from property_details.listing_events for pre-trigger history.
Tax reassessment forecast OH · Partial reset (capped growth)
- Current annual tax
- $1,451 · $121/mo
- Projected year-2 tax
- $2,129 · $177/mo
- Expected delta
- +$678/yr (+$56/mo · 46.7%)
ⓘ Screening estimate from a state-policy table — verify with the county assessor before closing.
Climate risk First Street
- Flood 4/10 Moderate FEMA zone X (unshaded) · 22% chance over 30 yrs
- Wildfire 1/10 Low
- Heat 3/10 Moderate 7 d/yr ≥100°F today · 18 d/yr by 30 yrs out
- Wind 2/10 Low
- Air quality 2/10 Low 1 unhealthy d/yr today · 2 by 30 yrs out
Nearby sold comps map
Loading sold comps map…
Walkable amenities ~0.75 mi
Loading nearby amenities…
Taxation est. · year 1
- Rental income
- $18,500
- − Mortgage interest
- −$10,077
- − Property taxes
- −$1,451
- − Insurance
- −$900
- − Repairs & maintenance
- −$1,480
- − Management
- −$1,480
- − Depreciation
- −$5,233
- Taxable loss
- −$2,121
- Est. tax savings @ 24.0%
- +$509
- After-tax cash flow
- $1,452/yr
For passive investors: Depreciation is non-cash, so a rental often shows a tax loss while cash-flowing — sheltering income. Rental losses are passive: they offset passive income freely, and up to $25,000/yr can offset ordinary (W-2) income if you actively participate and your MAGI is under $100k (phasing out to $0 by $150k); unused losses carry forward. On sale, claimed depreciation is recaptured at up to 25%, and gains may owe capital-gains tax (a 1031 exchange can defer both). Figures are a year-1 estimate at your 24.0% rate — not tax advice; consult a CPA.
Schools (NCES district)
- District
- Lima City
- NCES district ID
- 3904422
- Math proficiency
- 29% ▼ -13.00%
- Reading proficiency
- 36% ▼ -6.00%
- Median HH income
- $29,685
- Composite
- 26.31/100
- National rank
- #7243
- State rank
- #575 of 656 in OH
Livability — Lima
- Score
- 64/100
- State rank
- #787
- US rank
- #14288
Category grades
Schools grade is shown separately in the Schools card above.
Census & demographics
- Census place
- Lima, OH
- County
- Allen · 98,169 people
- City population
- 21,739
- Metro
- Lima, OH
- Population (ZIP)
- 24,746
- Household income
- $65,954
- Rent vs Own
- Severe rent burden
- 8.0
Population outlook (Allen County) Hauer SSP2
- Today (2025)
- 100,321 people
- By 2030
- 97,693 · -2.6%
- By 2040
- 91,802 · -8.5%
- By 2050
- 86,152 · -14.1%
- By 2075
- 73,659 · -26.6%
- By 2100
- 58,716 · -41.5%
Race, ethnicity, and origin ACS 2023
- Neighborhood character
- Predominantly White (74%)
- Race & ethnicity
- White 74% Black 15% Two or more races 6% Hispanic / Latino 4% Asian 1%
- Common ancestry
- Italian 2% Slovak 2% Romanian 2%
- Foreign-born
- 2% · Canada, Vietnam
- Languages at home
- 96% English-only · Spanish 1% Vietnamese 1%
Political lean MEDSL · Allen
- 2024 margin
- Solid R (+44.1) · D 27.5% · R 71.6%
- 2008→2024 swing
- -23.4pp toward R · 2008: -20.7pp · 2024: -44.1pp
- All cycles
- 2024: R+44.1 2020: R+39.5 2016: R+38.2 2012: R+25.7 2008: R+20.7
Not yet ingested
- Civics
- —
Market trends
- HPI YoY
- ▼ -156.78%
- Current HPI
- 210.6397
- Rent YoY
- —
- Metro
- —
- State GDP YoY
- ▲ 1.98%
- F500 in state
- 48
Industry mix (Fortune 500 HQ in OH)
| Industry | F500 HQs | Revenue |
|---|---|---|
| Insurance | 3 | $145B |
|
||
| Industrial Machinery | 3 | $49B |
|
||
| Financial Services | 3 | $24B |
|
||
| Consumer Goods | 2 | $93B |
|
||
| Aerospace / Defense | 2 | $47B |
|
||
| Utilities | 2 | $33B |
|
||
Price history
+313.6% since first listed6 events — show timeline
- 2026-06-11 Listed $179,900 WCARE
- 2021-05-24 Sold (Public Records) $123,600 Public Records
- 2021-05-24 Sold (MLS) $123,600 WCARE
- 2021-04-10 Listed $105,000 WCARE
- 2018-09-24 Sold (Public Records) $86,000 Public Records
- 1991-05-30 Sold (Public Records) $43,500 Public Records
Property tax history
+3.0%/yrLatest (2025): $1,451 · +0.0% YoY. Source: county tax records.
Cash-flow waterfall
monthlySold comps — $/sqft
last 12 mo · ≤1 miLoading sold comps…