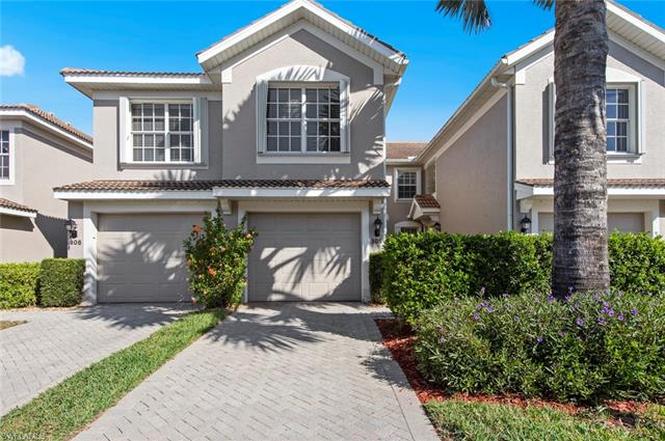
11031 Mill Creek Way #305 · Fort Myers, FL
Flood risk 1/10 · Minimal
- FEMA flood zone
- AE
- Chance of flooding over 30 yrs
- 0.0%
- Est. flood insurance / yr
- $1,737 – $8,500
Fire risk 4/10 · Minor
- Est. fire insurance / yr
- $947 – $1,759
Heat risk 10/10 · Severe
- Hot days now (above 107°F)
- 7 days/yr
- Hot days in 30 yrs
- 32 days/yr
Wind risk 10/10 · Severe
- Chance of severe wind over 30 yrs
- 99.0%
Air-quality risk 2/10 · Minimal
- Unhealthy air days now
- 1 days/yr
- Unhealthy air days in 30 yrs
- 1 days/yr
Risk factors via First Street. Map © Google.
Why this score? — see what drove the C+ grade
The composite is a weighted blend of 9 inputs, each scored 0–100. Each bar is that input's sub-score; the figure is the points it added to the 100-point composite (weight × sub-score).
- Cash flow +24.2/30.0
- 1% rule +9.4/10.0
- DSCR +7.8/10.0
- ARV discount +7.5/15.0
- Livability +4.3/5.0
- Schools +4.1/10.0
- Rent growth +2.6/5.0
- Condition / age +2.5/5.0
- Appreciation +0.0/10.0
$315,000
🖨 Deal sheet (PDF) 📄 Offer letter ✓ Due diligence
Listing remarks
Luxury Living at Colonial Country Club! Experience the best of Southwest Florida living in this beautifully appointed 2-bedroom, 2-bath upper-level residence, ideally located within one of Fort Myers’ most sought-after gated communities. One of the community’s most desirable layouts, the Cormorant features a split-bedroom floorplan for maximum privacy, soaring volume ceilings, and abundant natural light that creates a bright, open, and inviting atmosphere. Offered TURNKEY, this residence is beautifully appointed with custom furnishings, stylish tile flooring in the main living areas, and plush carpeting in the bedrooms—ready for you to move right in and start enjoying the
Key facts
- Tropical lake view
- Upgraded kitchen
- Tropical landscaping
Tags
Property features AI
Finance
- Other: Property is part of a large complex with many units and two floors per building; Development name: Mill Creek (sub-condo P4)
- Financial info: Total annual recurring community fees listed; One-time community fees listed
- HOA & community: Mandatory HOA; Quarterly HOA fee; Master annual HOA fee applies; Professional management; HOA maintenance includes: cable, internet/WiFi, lawn/land maintenance, irrigation water, pest control (exterior), reserve, security, street lights/maintenance, trash removal, water, manager, legal/accounting, fidelity bond; Community amenities: community pool, community spa/hot tub, exercise/fitness center (attended), full service spa, golf course (golf bundled), putting green, restaurant, business center, library, hobby room, community room, BBQ/picnic, bike and jog path, bocce court, pickleball, tennis court, sidewalk, vehicle wash area, underground utilities, private membership options
Exterior
- Parking: Covered deeded parking; Paved driveway; Guest parking available; Attached 1-car garage
- Security: Gated community; Community security listed in HOA services
- Utilities: Central water (assessment paid); Central sewer (assessment paid); Cable available
- Home design: Residential property; Low-rise building (1–3 stories); 2-story home; Rear exposure faces north; Located in Colonial Country Club development; Zero lot line
- Construction: Concrete block construction; Tile roof; Built in 2003
- Exterior features: Tennis court; Shutters; Stucco exterior; Single-hung windows
Interior
- Kitchen: Pantry; Electric cooktop; Microwave; Dishwasher; Disposal; Refrigerator/freezer
- Bedrooms: 3 bedrooms; Master bedroom upstairs; Split bedroom floor plan
- Flooring: Laminate; Tile
- Bathrooms: 2 full bathrooms; Master bath with dual sinks and shower (no tub)
- Heating & cooling: Central electric heat; Central electric cooling; Ceiling fans
- Interior features: Built-in cabinets; Cable prewire / high-speed available; Foyer; French doors; Pantry; Smoke detectors; Walk-in closet; Den / study; Screened lanai/porch; Turnkey furnished
- Laundry & utility: Laundry in residence; Washer and dryer included; Auto garage door
Neighborhood map
What this means for you Summary
Snapshot
- This is a 2-bed/2.0-bath condo listed at $315k.
Deal economics
- At list price, monthly cash flow is $202 ($2k/yr) — positive.
- The deal already cash-flows at list — no discount required.
- Meets the 1% rule at list price ($5k rent vs $315k).
- Recommended offer: $277k (12.0% below list) — sets the bar for market timing.
- Cap rate 8.7% vs local median 3.3% in Fort Myers — top-decile yield for the area; either an underpriced asset or a hidden risk that comps aren't pricing in. Stress-test before assuming the spread holds.
Location & tenants
- Location reads 86/100 on livability (#14 in FL, #383 nationally) — a professional / high-income tenant draw. Strengths: amenities A+, commute A+, housing A+.
- Lee (suburban): math 47% / reading 50% proficiency, ranked #42 of 73 in FL (top 58%) — families likely to look elsewhere, expect single-tenant / working-renter base with shorter leases.
- Zoned schools: Veterans Park Academy For The Arts (math 41% / reading 45%, grade F, #1,366 of 2,144 statewide, top 64%, 2,133 students, 36% FRL); Oak Hammock Middle School (math 43% / reading 41%, grade D-, #340 of 571 statewide, top 61%, 1,563 students, 56% FRL); Lehigh Senior High School (math 23% / reading 45%, grade F, #394 of 667 statewide, top 60%, 2,476 students, 57% FRL).
- Market conditions: Rents flat; 821 active listings in the ZIP; 40 comparable units currently listed for rent nearby; rentals at typical pace (median 25d on market — plan ~3-4 weeks tenant-placement turnaround); high-income renter base; 15,411 units permitted in Lee County in 2024 (4,686 in 5+ unit buildings).
- At $4,541/mo this rent would consume 49% of the median local household income ($110k/yr) (locally 276% of renters already pay >50% of income on rent) — very limited rent-growth headroom before tenants either downsize or default.
Forward outlook
- Local home prices are declining (-3.0%/yr); year-one equity from $2k of loan paydown is wiped out by about $9k of value loss. Plan a longer hold.
- Lee County population projected at +44% by 2050 — long-run rental-demand tailwind backs the buy-and-hold thesis.
Negotiation context
- It's been on market 170 days — a 12% lower offer ($277k) is reasonable based on typical stale-listing flexibility.
- 4 sale attempts since 2y ago with the ask held roughly flat each time — persistent listings suggest the price (not the market) is what's stuck; bring a comps-based counter.
- Current owner paid $140k; list at $315k implies a 125% gain — meaningful room to come down on a strong offer.
Risks & watch-outs
- Watch-outs: flood insurance adds $427/mo; HOA is 20% of rent.
- Climate carrying-cost: in FEMA flood zone AE (mandatory federal flood insurance); severe wind risk, 99% chance of damaging wind over 30y; extreme-heat days projected 7→32/yr by 2055 (HVAC capex compounding) — expect insurance premiums to compound above CPI over the hold.
Questions for the listing agent
- It's been on market 170 days. Have you received any prior offers? Is the seller open to a 12% concession, seller financing, or rate buy-down credit?
- What's the actual annual flood-insurance premium (NFIP or private), and is the property in a SFHA with mandatory coverage?
- What does the HOA fee cover, when was the last increase, and are there any pending special assessments or reserve-fund shortfalls?
- Any open or pending special assessments — roof, HVAC, plumbing, elevator, façade? What's the per-unit balance and payoff schedule, and is the seller paying it off at close or rolling it to the buyer?
- Why hasn't it sold? Are there any deal-killer items the seller is aware of (foundation, flood, title, zoning, code violations)?
- Is there a deadline driving the sale (1031 exchange, divorce, estate, relocation)? That informs how much negotiation room exists.
- What's the average days-on-market for RENTAL listings here right now (not sales)? A rising rental-DOM trend means longer vacancies and softer asking-rent achievability than the comps imply.
- What's the recent tenant-quality profile in this submarket — average credit score on applications, eviction rate, late-payment / NSF rate, and stable-employment percentage? A property-management company in the area should have these aggregated.
- How much new apartment / multifamily construction is in the pipeline within 1–3 miles? Heavy new supply (>2% of stock underway) typically softens rents 12–24 months out; light construction supports rent growth.
Investment metrics
- 1% rule
- 1.44% ✓
- Cap rate
- 8.69%
- Cash-on-cash
- 8.56%
- DSCR
- 1.38
- GRM
- 5.8
CMA / ARV
No comps found within radius.
Projected returns pro-forma
-3.0% appreciation · 0.37% rent growth · sell at horizon
- IRR
- -16.3%
- Equity multiple
- 0.44×
- Total profit
- $-49,054
- Equity at exit
- $46,968
- IRR
- -17.1%
- Equity multiple
- 0.22×
- Total profit
- $-68,408
- Equity at exit
- $27,235
Cash invested: $88,200 (down + closing). Projections, not guarantees.
Landlord ↔ Tenant lean methodology
- Overall (STATE)
- 87 Strongly Landlord-Friendly
- State Florida
- 87 Strongly Landlord-Friendly · R+3
- County
- — inherits STATE
- City
- — inherits STATE
ZIP-level market 33913
- Home prices YoY
- -10.3%
- Rents YoY
- 0.4%
- Active inventory
- 821
- Price-to-rent
- 5.8×
Monthly cashflow live
- Estimated rent
- $4,541 high interval (Pro) →
- Mortgage (P&I)
- −$1,652
- Tax from tax record
- −$259 /mo · $3,109/yr
- Insurance
- −$131
- Flood insurance flood zone
- −$427 /mo · $5,118/yr
- HOA
- −$916
- Vacancy / Maint / Mgmt
- −$954
- Net cashflow
- $202
Break-even live
Sensitivity live
| Price | -10% $381 | -5% $291 | +0% $202 | +5% $113 | +10% $24 |
|---|---|---|---|---|---|
| Rent | -10% $-156 | -5% $23 | +0% $202 | +5% $382 | +10% $561 |
| Rate | -1.0pp $361 | -0.5pp $282 | base $202 | +0.5pp $121 | +1.0pp $38 |
UW: 25.0% down · 7.5% · 30yr · 1.5% tax · 5.0% vac · 8.0% maint · 8.0% mgmt
Financing live
Cash to close
- Down payment
- $78,750
- Closing costs
- $9,450
- Reserves months
- —
- Total cash needed
- —
Loan-product check · same deal, 3 products live
Conventional
25% down · 7.5% · 30yr
- Down + closing
- —
- Monthly P&I
- —
- Monthly cashflow
- —
- DSCR
- —
- Eligible?
- —
Personal DTI + credit; lowest rate.
DSCR
20% down · 8.5% · 30yr
- Down + closing
- —
- Monthly P&I
- —
- Monthly cashflow
- —
- DSCR
- —
- Eligible?
- —
No personal income docs; deal must DSCR.
Hard money
10% down · 12.0% · 12mo
- Down + closing
- —
- Monthly P&I
- —
- Monthly cashflow
- —
- DSCR
- —
- Eligible?
- —
Short-term bridge; refi at stabilization.
Rent comps 40 comps
| Address | Beds | Baths | Sqft | Rent | $/sqft | DOM | Units | Dist |
|---|---|---|---|---|---|---|---|---|
| 11033 Mill Creek Way #202 Fort Myers, FL | 2.0 | 2.0 | 1379 | $5,400 | $3.92 | 25d | 1 | 0.01mi |
| 10020 Horse Creek Rd Fort Myers, FL | 2.0 | 2.0 | 1692 | $2,500 | $1.48 | 25d | 1 | 0.05mi |
| 11029 Mill Creek Way #405 Fort Myers, FL | 2.0 | 2.0 | 1749 | $2,500 | $1.43 | 25d | 1 | 0.05mi |
| 10112 Colonial Country Club Blvd #209 Fort Myers, FL | 2.0 | 2.0 | 1530 | $5,000 | $3.27 | 25d | 1 | 0.07mi |
| 10111 Colonial Country Club Blvd #2308 Fort Myers, FL | 2.0 | 2.0 | 1309 | $2,000 | $1.53 | 13d | 1 | 0.08mi |
| 10121 Colonial Country Club Blvd #1802 Fort Myers, FL | 2.0 | 2.0 | 1530 | $4,800 | $3.14 | 4d | 1 | 0.17mi |
| 10128 Colonial Country Club Blvd #602 Fort Myers, FL | 2.0 | 2.0 | 1530 | $4,600 | $3.01 | 25d | 1 | 0.19mi |
| 10130 Colonial Country Club Blvd #707 Fort Myers, FL | 2.0 | 2.0 | 1116 | $4,900 | $4.39 | 25d | 1 | 0.22mi |
| 11041 Iron Horse Way Fort Myers, FL | 2.0 | 2.0 | 1692 | $4,000 | $2.36 | 25d | 1 | 0.27mi |
| 11075 Lancewood St Fort Myers, FL | 3.0 | 2.0 | 1575 | $2,300 | $1.46 | 17d | 1 | 0.30mi |
| 11075 Lancewood St Fort Myers, FL | 3.0 | 2.0 | 1575 | $2,300 | $1.46 | 25d | 1 | 0.30mi |
| 11012 Mill Creek Way #2205 Fort Myers, FL | 2.0 | 2.0 | 1749 | $5,500 | $3.14 | 25d | 1 | 0.30mi |
| 11011 Mill Creek Way #1307 Fort Myers, FL | 2.0 | 2.0 | 1379 | $5,000 | $3.63 | 25d | 1 | 0.33mi |
| 9918 Horse Creek Rd Fort Myers, FL | 3.0 | 2.0 | 1510 | $2,200 | $1.46 | 25d | 1 | 0.36mi |
| 10602 Camarelle Cir Fort Myers, FL | 2.0 | 2.0 | 1690 | $5,500 | $3.25 | 25d | 1 | 0.39mi |
| 9667 Hemingway Ln Unit 3107 Fort Myers, FL | 2.0 | 2.0 | 1209 | $4,900 | $4.05 | 25d | 1 | 0.41mi |
| 9661 Hemingway Ln #3207 Fort Myers, FL | 2.0 | 2.0 | 1300 | $3,900 | $3.00 | 4d | 1 | 0.41mi |
| 9639 Hemingway Ln #3505 Fort Myers, FL | 2.0 | 2.0 | 1234 | $4,800 | $3.89 | 25d | 1 | 0.42mi |
| 10280 Crepe Jasmine Ln Unit 1546286P Fort Myers, FL | 3.0 | 2.0 | 1571 | $4,526 | $2.88 | 17d | 1 | 0.46mi |
| 10514 Bella Vista Dr Fort Myers, FL | 3.0 | 2.0 | 1823 | $6,500 | $3.57 | 25d | 1 | 0.51mi |
| 9582 Hemingway Ln #3402 Fort Myers, FL | 2.0 | 2.0 | 1382 | $5,500 | $3.98 | 25d | 1 | 0.56mi |
| 9582 Hemingway Ln #3403 Fort Myers, FL | 2.0 | 2.0 | 1385 | $5,400 | $3.90 | 16d | 1 | 0.56mi |
| 9582 Hemingway Ln #3403 Fort Myers, FL | 2.0 | 2.0 | 1385 | $5,400 | $3.90 | 25d | 1 | 0.56mi |
| 10053 Majestic Ave Fort Myers, FL | 2.0 | 2.0 | 1692 | $7,400 | $4.37 | 25d | 1 | 0.64mi |
| 10063 Majestic Ave Fort Myers, FL | 2.0 | 2.0 | 1692 | $7,100 | $4.20 | 25d | 1 | 0.65mi |
| 10518 Avila Cir Fort Myers, FL | 2.0 | 2.0 | 1466 | $6,500 | $4.43 | 25d | 1 | 0.67mi |
| 10518 Avila Cir Fort Myers, FL | 2.0 | 2.0 | 1466 | $6,500 | $4.43 | 4d | 1 | 0.67mi |
| 10700 Palazzo Way #201 Fort Myers, FL | 2.0 | 2.0 | 1390 | $5,000 | $3.60 | 23d | 1 | 0.72mi |
| 10711 Palazzo Way Fort Myers, FL | 2.0 | 2.0 | 1257 | $3,900 | $3.10 | 17d | 2 | 0.75mi |
| 10711 Palazzo Way Unit 203 Fort Myers, FL | 2.0 | 2.0 | 1257 | $5,300 | $4.22 | 23d | 1 | 0.75mi |
| 10751 Palazzo Way #103 Fort Myers, FL | 2.0 | 2.0 | 1235 | $5,000 | $4.05 | 25d | 1 | 0.80mi |
| 11225 Lithgow Ln Fort Myers, FL | 2.0 | 2.0 | 2153 | $8,000 | $3.72 | 25d | 1 | 0.85mi |
| 11541 Stonecreek Cir Fort Myers, FL | 3.0 | 3.0 | 2147 | $3,300 | $1.54 | 25d | 1 | 0.85mi |
| 10018 Oakhurst Way Fort Myers, FL | 3.0 | 2.0 | 1512 | $2,975 | $1.97 | 25d | 1 | 0.87mi |
| 10535 Carolina Willow Dr Fort Myers, FL | 3.0 | 2.0 | 1290 | $2,300 | $1.78 | 23d | 1 | 0.88mi |
| 10791 Palazzo Way #301 Fort Myers, FL | 2.0 | 2.0 | 1390 | $5,300 | $3.81 | 25d | 1 | 0.92mi |
| 10025 Oakhurst Way Fort Myers, FL | 2.0 | 2.0 | 1504 | $7,100 | $4.72 | 25d | 1 | 0.92mi |
| 10510 Amiata Way #302 Fort Myers, FL | 2.0 | 2.0 | 1245 | $4,900 | $3.94 | 25d | 1 | 0.94mi |
| 11280 Reflection Isles Blvd Fort Myers, FL | 3.0 | 2.0 | 1670 | $3,500 | $2.10 | 25d | 1 | 0.97mi |
| 10530 Amiata Way #103 Fort Myers, FL | 2.0 | 2.0 | 1248 | $2,200 | $1.76 | 25d | 1 | 0.99mi |
HOA detail condo
- Monthly dues
- $916 · $10,992/yr
- Likely covers
- security
- Assessments
- None detected in remarks — confirm with the listing agent.
Listing history 23 events
-
2026-06-22days on market $315,000 Active 170 DOM
-
2026-06-17days on market $315,000 Active 166 DOM
-
2026-06-16days on market $315,000 Active 165 DOM
-
2026-06-15days on market $315,000 Active 164 DOM
-
2026-06-13days on market $315,000 Active 162 DOM
-
2026-06-10days on market $315,000 Active 159 DOM
-
2026-06-09days on market $315,000 Active 158 DOM
-
2026-06-07days on market $315,000 Active 156 DOM
-
2026-06-02days on market $315,000 Active 151 DOM
-
2026-06-01days on market $315,000 Active 150 DOM
-
2026-06-01days on market $315,000 Active 149 DOM
-
2026-02-05price $315,000
-
2026-01-02$325,000 Active
-
2025-08-21price $298,000
-
2025-05-30price $315,000
-
2025-03-25$325,000 Active
-
2025-02-05historical $1,900
-
2025-02-03$1,900
-
2024-12-13historical
-
2024-07-09$339,900 Active
-
2011-06-27soldstatus $140,000
-
2011-05-31soldstatus $140,000
-
2005-11-15soldstatus $345,000
ⓘ Source: listings_history table (triggers on properties + properties_extension) + one-shot
backfill from property_details.listing_events for pre-trigger history.
Tax reassessment forecast FL · Resets to sale price
- Current annual tax
- $3,109 · $259/mo
- Projected year-2 tax
- $3,109 · $259/mo
- Expected delta
- $0/yr ($0/mo · 0.0%)
ⓘ Screening estimate from a state-policy table — verify with the county assessor before closing.
Climate risk First Street
- Flood 1/10 Low FEMA zone AE · 0% chance over 30 yrs
- Wildfire 4/10 Moderate
- Heat 10/10 Extreme 7 d/yr ≥107°F today · 32 d/yr by 30 yrs out
- Wind 10/10 Extreme 99% chance of damaging wind over 30 yrs
- Air quality 2/10 Low 1 unhealthy d/yr today · 1 by 30 yrs out
Nearby sold comps map
Loading sold comps map…
Walkable amenities ~0.75 mi
Loading nearby amenities…
Taxation est. · year 1
- Rental income
- $54,488
- − Mortgage interest
- −$17,645
- − Property taxes
- −$3,109
- − Insurance
- −$6,694
- − Repairs & maintenance
- −$4,359
- − Management
- −$4,359
- − HOA
- −$10,992
- − Depreciation
- −$9,164
- Taxable loss
- −$1,833
- Est. tax savings @ 24.0%
- +$440
- After-tax cash flow
- $2,868/yr
For passive investors: Depreciation is non-cash, so a rental often shows a tax loss while cash-flowing — sheltering income. Rental losses are passive: they offset passive income freely, and up to $25,000/yr can offset ordinary (W-2) income if you actively participate and your MAGI is under $100k (phasing out to $0 by $150k); unused losses carry forward. On sale, claimed depreciation is recaptured at up to 25%, and gains may owe capital-gains tax (a 1031 exchange can defer both). Figures are a year-1 estimate at your 24.0% rate — not tax advice; consult a CPA.
Schools (NCES district)
- District
- Lee
- NCES district ID
- 1201080
- Math proficiency
- 47% ▼ -11.00%
- Reading proficiency
- 50% ▼ -4.00%
- Median HH income
- $49,518
- Composite
- 41.49/100
- National rank
- #3458
- State rank
- #42 of 73 in FL
Livability — Fort Myers
- Score
- 86/100
- State rank
- #14
- US rank
- #383
Category grades
Schools grade is shown separately in the Schools card above.
Census & demographics
- Census place
- Fort Myers, FL
- County
- Lee County · 788,662 people
- City population
- 278,598
- Metro
- Cape Coral-Fort Myers, FL
- Population (ZIP)
- 31,538
- Household income
- $110,373
- Rent vs Own
- Severe rent burden
- 276.0
Population outlook (Lee County) Hauer SSP2
- Today (2025)
- 871,946 people
- By 2030
- 955,468 · +9.6%
- By 2040
- 1,113,587 · +27.7%
- By 2050
- 1,256,891 · +44.1%
- By 2075
- 1,560,270 · +78.9%
- By 2100
- 1,726,848 · +98.0%
Race, ethnicity, and origin ACS 2023
- Neighborhood character
- Predominantly White (74%)
- Race & ethnicity
- White 74% Hispanic / Latino 13% Two or more races 11% Black 5% Asian 2%
- Hispanic origin (detail)
- Mexican 3% Puerto Rican 3% Cuban 2%
- Common ancestry
- Romanian 5% Lithuanian 3% Slovak 2%
- Foreign-born
- 14% · Canada, Vietnam, China
- Languages at home
- 84% English-only · Spanish 10% Other Indo-European 2% French/Haitian/Cajun 2%
Political lean MEDSL · Lee
- 2024 margin
- Strong R (+28.4) · D 35.5% · R 63.9%
- 2008→2024 swing
- -18.0pp toward R · 2008: -10.4pp · 2024: -28.4pp
- All cycles
- 2024: R+28.4 2020: R+19.2 2016: R+20.4 2012: R+16.6 2008: R+10.4
Not yet ingested
- Civics
- —
Market trends
- HPI YoY
- ▼ -25.45%
- Current HPI
- 221.7115
- Rent YoY
- ▲ 0.37%
- Metro
- Cape Coral-Fort Myers, FL
- State GDP YoY
- ▲ 3.28%
- F500 in state
- 36
Industry mix (Fortune 500 HQ in FL)
| Industry | F500 HQs | Revenue |
|---|---|---|
| Industrial Technology | 2 | $29B |
|
||
| Insurance | 2 | $17B |
|
||
| Retail | 1 | $60B |
|
||
| Technology Distribution | 1 | $58B |
|
||
| Homebuilding | 1 | $35B |
|
||
| Technology Manufacturing | 1 | $35B |
|
||
Price history
-8.7% since first listed12 events — show timeline
- 2026-02-05 Price Changed $315,000 BEARMLS
- 2026-01-02 Listed $325,000 BEARMLS
- 2025-08-21 Price Changed $298,000 BEARMLS
- 2025-05-30 Price Changed $315,000 BEARMLS
- 2025-03-25 Listed $325,000 BEARMLS
- 2025-02-05 Rental Removed $1,900 FORTMLS
- 2025-02-03 Listed for Rent $1,900 FORTMLS
- 2024-12-13 Listing Removed — FORTMLS
- 2024-07-09 Listed $339,900 FORTMLS
- 2011-06-27 Sold (Public Records) $140,000 Public Records
- 2011-05-31 Sold (MLS) $140,000 FORTMLS
- 2005-11-15 Sold (Public Records) $345,000 Public Records
Property tax history
+1.0%/yrLatest (2025): $3,109 · +2.1% YoY. Source: county tax records.
Cash-flow waterfall
monthlySold comps — $/sqft
last 12 mo · ≤1 miLoading sold comps…