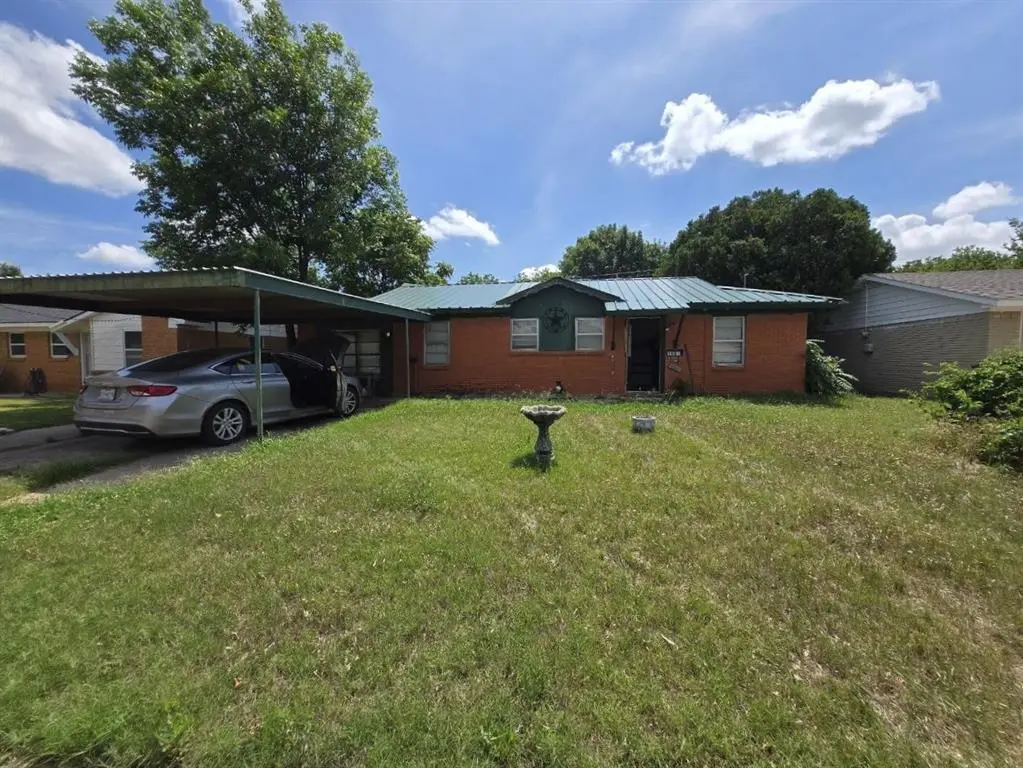
1607 Covington St · Wichita Falls, TX
Flood risk 1/10 · Minimal
- FEMA flood zone
- X (unshaded)
- Chance of flooding over 30 yrs
- 0.0%
- Est. flood insurance / yr
- $507 – $1,088
Fire risk 8/10 · Major
- Est. fire insurance / yr
- $1,222 – $2,270
Heat risk 7/10 · Major
- Hot days now (above 109°F)
- 7 days/yr
- Hot days in 30 yrs
- 19 days/yr
Wind risk 4/10 · Minor
- Chance of severe wind over 30 yrs
- 9.0%
Air-quality risk 1/10 · Minimal
- Unhealthy air days now
- 0 days/yr
- Unhealthy air days in 30 yrs
- 0 days/yr
Risk factors via First Street. Map © Google.
Why this score? — see what drove the B+ grade
The composite is a weighted blend of 9 inputs, each scored 0–100. Each bar is that input's sub-score; the figure is the points it added to the 100-point composite (weight × sub-score).
- Cash flow +30.0/30.0
- ARV discount +15.0/15.0
- 1% rule +10.0/10.0
- DSCR +10.0/10.0
- Livability +3.5/5.0
- Schools +3.4/10.0
- Rent growth +3.2/5.0
- Condition / age +2.5/5.0
- Appreciation +0.0/10.0
$79,900
🖨 Deal sheet (PDF) 📄 Offer letter ✓ Due diligence
Listing remarks
Bring your vision and creativity to this 3-bedroom, 1-bath home offering 1,267 square feet of potential. Whether you're an investor, first-time buyer looking for a project, or someone dreaming of customizing a home to fit your style, this property is full of possibilities. With a functional floor plan and solid square footage, there's plenty of room to reimagine the space and make it your own. While the home could use some TLC, the potential is undeniable for those willing to roll up their sleeves and add their personal touch. If you've been searching for a property with character, potential, and the opportunity to build equity, this could be the perfect fit. Bring your imagination and see
Key facts
- 7,187 sq ft lot
- 2 parking spots
- Built 1966
Property features AI
Finance
- Other: Property subtype: Single Family Residence; Subdivision: Sunset Terrace 2; County: Wichita; Country: United States
- Financial info: Listing terms: Cash or Conventional
- HOA & community: No association
Exterior
- Parking: Covered parking for 2 vehicles; 2-car carport; Driveway
- Utilities: City water; City sewer; Cable available; Electric service
- Home design: Single-family residence; One story; Residential property
- Construction: Brick construction; Composition roof; Slab foundation; Built in 1966
- Exterior features: Interior lot; All-weather road access
Interior
- Kitchen: Electric range
- Bedrooms: Primary bedroom (Level 1) — approx. 12 x 14; Bedroom (Level 1) — approx. 11 x 9; Bedroom (Level 1) — approx. 10 x 10
- Flooring: Laminate flooring
- Bathrooms: 1 full bathroom
- Interior features: Cable TV available; One living area; One dining area; 4 total rooms
- Laundry & utility: Washer hookup
Neighborhood map
What this means for you Summary
Snapshot
- This is a 3-bed/1.0-bath single-family listed at $80k.
Deal economics
- At list price, monthly cash flow is $348 ($4k/yr) — positive.
- The deal already cash-flows at list — no discount required.
- Meets the 1% rule at list price ($1k rent vs $80k).
- Recommended offer: $79k (1.5% below list) — sets the bar for market timing.
- Cap rate 11.5% vs local median 4.7% in Wichita Falls — top-decile yield for the area; either an underpriced asset or a hidden risk that comps aren't pricing in. Stress-test before assuming the spread holds.
Location & tenants
- Location reads 69/100 on livability (#437 in TX) — a middle-class / working-renter tenant base. Strengths: cost of living A+, housing A+; Watch: health & safety C-, employment D+, crime D.
- City View ISD (urban): math 40% / reading 39% proficiency, ranked #429 of 826 in TX (top 52%) — families likely to look elsewhere, expect single-tenant / working-renter base with shorter leases.
- Zoned schools: City View El (math 39% / reading 37%, grade F, #1,709 of 4,322 statewide, top 40%, 502 students, 78% FRL) — zoned schools average 78% FRL vs 56% district-wide (21 pts higher); higher-poverty schools than district average — tighter screening recommended.
- Market conditions: Rents rising (+2.8%/yr); 114 active listings in the ZIP; 5 comparable units currently listed for rent nearby; rentals lingering (median 45d on market — plan ~5-8 weeks vacancy on turnover, expect pricing pressure); 100% of comp listings sitting > 30 days — soft ceiling on asking rent; 231 units permitted in Wichita County in 2024 (10 in 5+ unit buildings).
- This rent runs 33% of the median local income ($47k/yr) — at the standard rent-burdened threshold; future hikes will face affordability resistance.
Forward outlook
- Local home prices are declining (-3.0%/yr); year-one equity from $552 of loan paydown is wiped out by about $2k of value loss. Plan a longer hold.
- Wichita County population projected to shrink 7% by 2050 — rents likely to lag national; underwrite the cash flow, not the appreciation.
- At projected returns (-3.0% appreciation + 2.8% rent growth), your $22k cash investment doubles in ~7 years — after that, you're playing with house money.
Negotiation context
- It's been on market 15 days — a 2% lower offer ($79k) is reasonable based on typical stale-listing flexibility.
Risks & watch-outs
- Watch-outs: property tax is 3.1% of price.
- Climate carrying-cost: severe wildfire risk; extreme-heat days projected 7→19/yr by 2055 (HVAC capex compounding) — expect insurance premiums to compound above CPI over the hold.
Questions for the listing agent
- Built in 1966 — when were the roof, HVAC, electrical panel, plumbing, and water heater last replaced?
- Property tax is high relative to price — has the assessment been appealed recently, and will the sale trigger a re-assessment?
- Is there a deadline driving the sale (1031 exchange, divorce, estate, relocation)? That informs how much negotiation room exists.
- Schools are D-rated, which usually means shorter tenancies and higher turnover. Who's the typical renter profile here, and what's been the actual vacancy rate?
- Crime grade is D in this area — have there been break-ins, vandalism, or insurance claims at this property in the last 3 years? What carrier currently insures it and at what premium?
- What's the average days-on-market for RENTAL listings here right now (not sales)? A rising rental-DOM trend means longer vacancies and softer asking-rent achievability than the comps imply.
- What's the recent tenant-quality profile in this submarket — average credit score on applications, eviction rate, late-payment / NSF rate, and stable-employment percentage? A property-management company in the area should have these aggregated.
- How much new for-sale + rental construction is in the pipeline within 1–3 miles? Heavy new supply typically softens prices + rents 12–24 months out; constrained supply supports both.
Investment metrics
- 1% rule
- 1.60% ✓
- Cap rate
- 11.52%
- Cash-on-cash
- 18.67%
- DSCR
- 1.83
- GRM
- 5.2
CMA / ARV
- ARV (on-the-fly)
- $104,058
- Comps found
- 3
Show comp detail 3 sales within ~0.75 mi
| Address | Dist | Beds/Ba | Sqft | Sold | Price | $/sf | Match |
|---|---|---|---|---|---|---|---|
| 1432 Deville St | 0.36mi | 3/1.0 | 1,218 (-4%) | 10mo | $145,000 | $119 | 68 |
| 1406 E Cortez Dr | 0.36mi | 3/1.0 | 1,196 (-6%) | 12mo | $89,900 | $75 | 64 |
| 4300 Viewpark | 0.40mi | 3/2.0 | 1,153 (-9%) | 21mo | $94,900 | $82 | 44 |
Match score weights: distance 35% · size 25% · config 20% · recency 20%. Top-matched comps best support the ARV.
Projected returns pro-forma
-3.0% appreciation · 2.81% rent growth · sell at horizon
- IRR
- 10.3%
- Equity multiple
- 1.41×
- Total profit
- $9,066
- Equity at exit
- $11,913
- IRR
- 19.3%
- Equity multiple
- 2.60×
- Total profit
- $35,795
- Equity at exit
- $6,908
Cash invested: $22,372 (down + closing). Projections, not guarantees.
Landlord ↔ Tenant lean methodology
- Overall (STATE)
- 87 Strongly Landlord-Friendly
- State Texas
- 87 Strongly Landlord-Friendly · R+5
- County
- — inherits STATE
- City
- — inherits STATE
ZIP-level market 76306
- Home prices YoY
- -30.1%
- Rents YoY
- 2.8%
- Active inventory
- 114
- Price-to-rent
- 5.2×
Monthly cashflow live
- Estimated rent
- $1,275 high interval (Pro) →
- Mortgage (P&I)
- −$419
- Tax from tax record
- −$206 /mo · $2,477/yr
- Insurance
- −$33
- HOA
- −$0
- Vacancy / Maint / Mgmt
- −$268
- Net cashflow
- $348
Break-even live
Sensitivity live
| Price | -10% $393 | -5% $371 | +0% $348 | +5% $326 | +10% $303 |
|---|---|---|---|---|---|
| Rent | -10% $247 | -5% $298 | +0% $348 | +5% $398 | +10% $449 |
| Rate | -1.0pp $388 | -0.5pp $368 | base $348 | +0.5pp $327 | +1.0pp $306 |
UW: 25.0% down · 7.5% · 30yr · 1.5% tax · 5.0% vac · 8.0% maint · 8.0% mgmt
Financing live
Cash to close
- Down payment
- $19,975
- Closing costs
- $2,397
- Reserves months
- —
- Total cash needed
- —
Loan-product check · same deal, 3 products live
Conventional
25% down · 7.5% · 30yr
- Down + closing
- —
- Monthly P&I
- —
- Monthly cashflow
- —
- DSCR
- —
- Eligible?
- —
Personal DTI + credit; lowest rate.
DSCR
20% down · 8.5% · 30yr
- Down + closing
- —
- Monthly P&I
- —
- Monthly cashflow
- —
- DSCR
- —
- Eligible?
- —
No personal income docs; deal must DSCR.
Hard money
10% down · 12.0% · 12mo
- Down + closing
- —
- Monthly P&I
- —
- Monthly cashflow
- —
- DSCR
- —
- Eligible?
- —
Short-term bridge; refi at stabilization.
Rent comps 5 comps
| Address | Beds | Baths | Sqft | Rent | $/sqft | DOM | Units | Dist |
|---|---|---|---|---|---|---|---|---|
| 1450 Kinsale Ct Wichita Falls, TX | 3.0 | 1.0 | 1146 | $1,300 | $1.13 | 45d | 1 | 0.32mi |
| 115 Becky Dr Unit 115 Wichita Falls, TX | 3.0 | 2.0 | 924 | $875 | $0.95 | 45d | 1 | 0.98mi |
| 1200 Ridgeway Dr Wichita Falls, TX | 1.0–3.0 | 1.0–2.0 | 889 | $1,025 | $1.15 | 45d | 5 | 1.00mi |
| 2801 Roanoke Dr Unit B Wichita Falls, TX | 3.0 | 2.0 | 876 | $990 | $1.13 | 45d | 1 | 1.01mi |
| 38 Blair House Ln Wichita Falls, TX | 3.0 | 2.0 | 1088 | $875 | $0.80 | 45d | 1 | 1.46mi |
Listing history 13 events
-
2026-06-21days on market $79,900 Active 15 DOM
-
2026-06-19days on market $79,900 Active 13 DOM
-
2026-06-18days on market $79,900 Active 12 DOM
-
2026-06-17days on market $79,900 Active 11 DOM
-
2026-06-16days on market $79,900 Active 10 DOM
-
2026-06-15days on market $79,900 Active 9 DOM
-
2026-06-14days on market $79,900 Active 7 DOM
-
2026-06-13pricedays on market $79,900 Active 6 DOM
-
2026-06-10days on market $84,900 Active 4 DOM
-
2026-06-09days on market $84,900 Active 3 DOM
-
2026-06-08days on market $84,900 Active 2 DOM
-
2026-06-07remarks 699-char remark
-
2026-06-07$84,900 Active 1 DOM
ⓘ Source: listings_history table (triggers on properties + properties_extension) + one-shot
backfill from property_details.listing_events for pre-trigger history.
Tax reassessment forecast TX · Resets to sale price
- Current annual tax
- $2,477 · $206/mo
- Projected year-2 tax
- $2,477 · $206/mo
- Expected delta
- $0/yr ($0/mo · 0.0%)
ⓘ Screening estimate from a state-policy table — verify with the county assessor before closing.
Climate risk First Street
- Flood 1/10 Low FEMA zone X (unshaded) · 0% chance over 30 yrs
- Wildfire 8/10 Severe
- Heat 7/10 Severe 7 d/yr ≥109°F today · 19 d/yr by 30 yrs out
- Wind 4/10 Moderate 9% chance of damaging wind over 30 yrs
- Air quality 1/10 Low 0 unhealthy d/yr today · 0 by 30 yrs out
Nearby sold comps map
Loading sold comps map…
Walkable amenities ~0.75 mi
Loading nearby amenities…
Taxation est. · year 1
- Rental income
- $15,294
- − Mortgage interest
- −$4,476
- − Property taxes
- −$2,477
- − Insurance
- −$400
- − Repairs & maintenance
- −$1,224
- − Management
- −$1,224
- − Depreciation
- −$2,324
- Taxable income
- $3,170
- Est. tax owed @ 24.0%
- −$761
- After-tax cash flow
- $3,417/yr
For passive investors: Depreciation is non-cash, so a rental often shows a tax loss while cash-flowing — sheltering income. Rental losses are passive: they offset passive income freely, and up to $25,000/yr can offset ordinary (W-2) income if you actively participate and your MAGI is under $100k (phasing out to $0 by $150k); unused losses carry forward. On sale, claimed depreciation is recaptured at up to 25%, and gains may owe capital-gains tax (a 1031 exchange can defer both). Figures are a year-1 estimate at your 24.0% rate — not tax advice; consult a CPA.
Schools (NCES district)
- District
- City View ISD
- NCES district ID
- 4814130
- Math proficiency
- 40% ▲ 3.00%
- Reading proficiency
- 39% ▬ 0.00%
- Median HH income
- $46,360
- Composite
- 33.74/100
- National rank
- #5372
- State rank
- #429 of 826 in TX
Livability — Wichita Falls
- Score
- 69/100
- State rank
- #437
- US rank
- #8940
Category grades
Schools grade is shown separately in the Schools card above.
Census & demographics
- Census place
- Wichita Falls, TX
- County
- Wichita County · 95,694 people
- City population
- 95,694
- Metro
- Wichita Falls, TX
- Population (ZIP)
- 13,963
- Household income
- $46,957
- Rent vs Own
- Severe rent burden
- 235.0
Population outlook (Wichita County) Hauer SSP2
- Today (2025)
- 129,638 people
- By 2030
- 128,366 · -1.0%
- By 2040
- 124,466 · -4.0%
- By 2050
- 120,499 · -7.0%
- By 2075
- 113,884 · -12.2%
- By 2100
- 101,818 · -21.5%
Race, ethnicity, and origin ACS 2023
- Neighborhood character
- Diverse neighborhood (Simpson 0.59)
- Race & ethnicity
- White 58% Hispanic / Latino 21% Black 16% Two or more races 9% Asian 2%
- Hispanic origin (detail)
- Mexican 18% Cuban 1%
- Common ancestry
- Italian 2% Serbian 1% Slovak 1%
- Foreign-born
- 6% · Canada
- Languages at home
- 88% English-only · Spanish 8% Tagalog/Filipino 1%
Political lean MEDSL · Wichita
- 2024 margin
- Solid R (+44.0) · D 27.5% · R 71.5%
- 2008→2024 swing
- -5.2pp toward R · 2008: -38.9pp · 2024: -44.0pp
- All cycles
- 2024: R+44.0 2020: R+41.1 2016: R+49.7 2012: R+47.1 2008: R+38.9
Not yet ingested
- Civics
- —
Market trends
- HPI YoY
- ▼ -71.29%
- Current HPI
- 165.6314
- Rent YoY
- ▲ 2.81%
- Metro
- Wichita Falls, TX
- State GDP YoY
- ▲ 3.95%
- F500 in state
- 110
Industry mix (Fortune 500 HQ in TX)
| Industry | F500 HQs | Revenue |
|---|---|---|
| Energy | 16 | $1,198B |
|
||
| Technology | 5 | $198B |
|
||
| Engineering / Construction | 4 | $72B |
|
||
| Energy Services | 3 | $60B |
|
||
| Utilities | 3 | $41B |
|
||
| Healthcare | 2 | $330B |
|
||
Price history
2 events — show timeline
- 2026-06-05 Listed $84,900 NTREIS
- 2006-11-13 Sold (Public Records) — Public Records
Property tax history
+4.5%/yrLatest (2025): $2,477 · +2.3% YoY. Source: county tax records.
Cash-flow waterfall
monthlySold comps — $/sqft
last 12 mo · ≤1 miLoading sold comps…