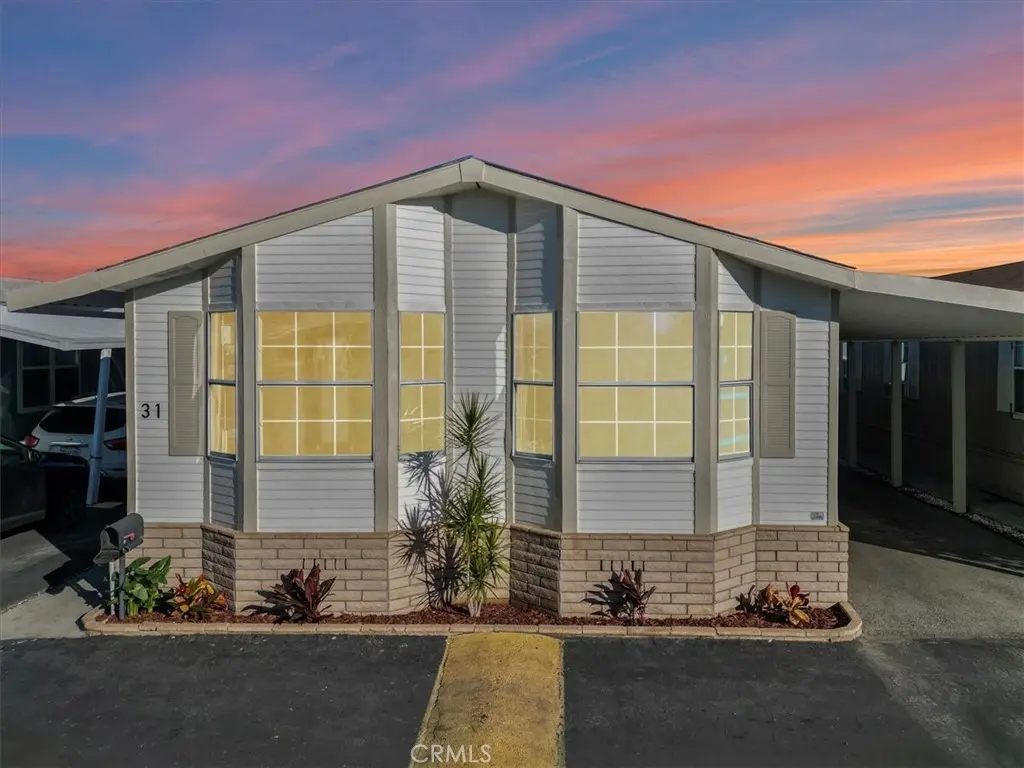
9080 Bloomfield #31 · Cypress, CA
Flood risk 1/10 · Minimal
- FEMA flood zone
- X
- Chance of flooding over 30 yrs
- 0.0%
- Est. flood insurance / yr
- $507 – $1,088
Fire risk 1/10 · Minimal
- Est. fire insurance / yr
- $659 – $1,223
Heat risk 5/10 · Moderate
- Hot days now (above 89°F)
- 7 days/yr
- Hot days in 30 yrs
- 24 days/yr
Wind risk 1/10 · Minimal
- Chance of severe wind over 30 yrs
- —
Air-quality risk 5/10 · Moderate
- Unhealthy air days now
- 7 days/yr
- Unhealthy air days in 30 yrs
- 9 days/yr
Risk factors via First Street. Map © Google.
Why this score? — see what drove the B grade
The composite is a weighted blend of 9 inputs, each scored 0–100. Each bar is that input's sub-score; the figure is the points it added to the 100-point composite (weight × sub-score).
- Cash flow +30.0/30.0
- 1% rule +10.0/10.0
- DSCR +10.0/10.0
- Schools +6.2/10.0
- ARV discount +5.6/15.0
- Livability +3.7/5.0
- Rent growth +2.9/5.0
- Condition / age +2.5/5.0
- Appreciation +0.0/10.0
$185,000
🖨 Deal sheet (PDF) 📄 Offer letter ✓ Due diligence
Listing remarks
Located at 9080 Bloomfield Ave. , Space 31, Cypress, CA 90630, this remodeled 3-bedroom, 2-bathroom manufactured home in Lincoln Center Mobile Estates offers a bright open-concept layout, high ceilings, skylights, updated finishes, and move-in-ready appeal. Interior features include new flooring throughout, fresh interior and exterior paint, a spacious great room with fireplace and statement lighting, and an updated kitchen with center island, stainless-steel stove and microwave, and included appliances. The primary suite includes an updated bathroom with walk-in shower and dual shower heads. The secondary bathroom features an oversized vanity and tub/shower combination. Additional features
Key facts
- 30.41 acre lot
- Community pool
- Built 2000
Property features AI
Finance
- Other: Manager approval required for residency; Pets allowed with size, breed and number restrictions
- HOA & community: Land lease community (land lease payment applies); Land lease amount: $2,600
Exterior
- Parking: Located in Lincoln Center park
- Utilities: Public sewer; District/public water
- Home design: Single-story mobile home (model CL-5224A); Double body type; Mobile home remains on lot; Entry facing ground level
- Construction: Mobile home approximately 12 ft wide by 52 ft long; Seller-provided year built and living area information
- Exterior features: Community association pool; Street lighting in neighborhood
Interior
- Kitchen: Free-standing range; Dishwasher; Open kitchen to family room; Kitchen island
- Bedrooms: All bedrooms located on the ground floor
- Bathrooms: 2 full bathrooms; Shower-in-tub(s)
- Heating & cooling: Central heating (central furnace); Central air conditioning
- Interior features: One-level home; All bedrooms on ground floor; Main entry at ground level
- Laundry & utility: Laundry inside the home
Neighborhood map
What this means for you Summary
Snapshot
- This is a 3-bed/2.0-bath manufactured listed at $185k.
Deal economics
- At list price, monthly cash flow is $1k ($17k/yr) — positive.
- The deal already cash-flows at list — no discount required.
- Meets the 1% rule at list price ($3k rent vs $185k).
- Recommended offer: $174k (6.0% below list) — sets the bar for market timing.
- Cap rate 15.7% vs local median 2.2% in Cypress — top-decile yield for the area; either an underpriced asset or a hidden risk that comps aren't pricing in. Stress-test before assuming the spread holds.
Location & tenants
- Location reads 74/100 on livability (#141 in CA, #4,900 nationally) — a middle-class / working-renter tenant base. Strengths: schools A+, employment A+, commute A; Watch: health & safety D, cost of living F.
- Cypress Elementary (suburban): math 67% / reading 69% proficiency, ranked #117 of 1,400 in CA (top 8%) — acceptable for families but not a draw, mixed tenant base, ~2y average lease.
- Market conditions: Rents rising (+1.7%/yr); 70 active listings in the ZIP; 33 comparable units currently listed for rent nearby; rentals leasing fast (median 11d on market — plan ~1-2 weeks tenant-placement turnaround); high-income renter base; 6,974 units permitted in Orange County in 2024 (3,839 in 5+ unit buildings).
- This rent runs 32% of the median local income ($130k/yr) — at the standard rent-burdened threshold; future hikes will face affordability resistance.
Forward outlook
- Local home prices are declining (-3.0%/yr); year-one equity from $1k of loan paydown is wiped out by about $6k of value loss. Plan a longer hold.
- Orange County population projected at +14% by 2050 — modest demand growth; plan on rents tracking national, not racing it.
- At projected returns (-3.0% appreciation + 1.7% rent growth), your $52k cash investment doubles in ~4 years — after that, you're playing with house money.
Negotiation context
- It's been on market 75 days — a 6% lower offer ($174k) is reasonable based on typical stale-listing flexibility.
- 2 sale attempts; this cycle's ask has dropped $25k (12%) from the opening price — seller is motivated, your offer sets the floor, not the list.
Risks & watch-outs
- Climate carrying-cost: extreme-heat days projected 7→24/yr by 2055 (HVAC capex compounding) — expect insurance premiums to compound above CPI over the hold.
Questions for the listing agent
- It's been on market 75 days. Have you received any prior offers? Is the seller open to a 6% concession, seller financing, or rate buy-down credit?
- Why hasn't it sold? Are there any deal-killer items the seller is aware of (foundation, flood, title, zoning, code violations)?
- Is there a deadline driving the sale (1031 exchange, divorce, estate, relocation)? That informs how much negotiation room exists.
- Schools are A-rated — typically a magnet for longer-tenancy family renters. What's the average tenant stay here, and is there a school-zone premium baked into asking?
- What's the average days-on-market for RENTAL listings here right now (not sales)? A rising rental-DOM trend means longer vacancies and softer asking-rent achievability than the comps imply.
- What's the recent tenant-quality profile in this submarket — average credit score on applications, eviction rate, late-payment / NSF rate, and stable-employment percentage? A property-management company in the area should have these aggregated.
- How much new for-sale + rental construction is in the pipeline within 1–3 miles? Heavy new supply typically softens prices + rents 12–24 months out; constrained supply supports both.
Investment metrics
- 1% rule
- 1.87% ✓
- Cap rate
- 15.72%
- Cash-on-cash
- 33.66%
- DSCR
- 2.50
- GRM
- 4.5
CMA / ARV
- ARV (on-the-fly)
- $177,330
- Comps found
- 12
Show comp detail 12 sales within ~0.75 mi
| Address | Dist | Beds/Ba | Sqft | Sold | Price | $/sf | Match |
|---|---|---|---|---|---|---|---|
| 9080 Bloomfield Ave #230 | 0.00mi | 3/2.0 | 1,272 (-1%) | 1mo | $159,900 | $126 | 97 |
| 9080 Bloomfield Ave #209 | 0.00mi | 3/2.0 | 1,248 (-3%) | 3mo | $129,000 | $103 | 93 |
| 9080 Bloomfield Ave #193 | 0.00mi | 3/2.0 | 1,248 (-3%) | 10mo | $165,000 | $132 | 87 |
| 9080 Bloomfield Ave #122 | 0.00mi | 3/2.0 | 1,248 (-3%) | 10mo | $168,000 | $135 | 87 |
| 9080 Bloomfield Ave #237 | 0.00mi | 3/2.0 | 1,408 (+10%) | 4mo | $130,000 | $92 | 80 |
| 9080 Bloomfield Ave #22 | 0.00mi | 4/2.0 (+1) | 1,344 (+5%) | 10mo | $185,000 | $138 | 79 |
| 22221 Bloomfield Ave #47 | 0.26mi | 2/2.0 (-1) | 1,344 (+5%) | 1mo | $275,000 | $205 | 74 |
| 22221 Bloomfield #11 | 0.26mi | 2/2.0 (-1) | 1,344 (+5%) | 3mo | $200,000 | $149 | 72 |
| 9080 Bloomfield Ave #272 | 0.00mi | 3/2.0 | 1,122 (-13%) | 11mo | $185,000 | $165 | 70 |
| 9080 Bloomfield Ave #141 | 0.00mi | 4/2.0 (+1) | 1,431 (+11%) | 8mo | $155,000 | $108 | 69 |
| 9080 Bloomfield Ave #77 | 0.09mi | 3/2.0 | 1,100 (-14%) | 4mo | $168,000 | $153 | 68 |
| 9080 Bloomfield Ave #192 | 0.12mi | 3/2.0 | 1,434 (+12%) | 11mo | $218,000 | $152 | 66 |
Match score weights: distance 35% · size 25% · config 20% · recency 20%. Top-matched comps best support the ARV.
Projected returns pro-forma
-3.0% appreciation · 1.69% rent growth · sell at horizon
- IRR
- 27.5%
- Equity multiple
- 2.12×
- Total profit
- $58,120
- Equity at exit
- $27,584
- IRR
- 34.2%
- Equity multiple
- 3.93×
- Total profit
- $152,007
- Equity at exit
- $15,995
Cash invested: $51,800 (down + closing). Projections, not guarantees.
Landlord ↔ Tenant lean methodology
- Overall (STATE)
- 18 Strongly Tenant-Friendly
- State California
- 18 Strongly Tenant-Friendly · D+13
- County
- — inherits STATE
- City
- — inherits STATE
ZIP-level market 90630
- Rents YoY
- 1.7%
- Active inventory
- 70
- Price-to-rent
- 4.5×
Monthly cashflow live
- Estimated rent
- $3,458 high interval (Pro) →
- Mortgage (P&I)
- −$970
- Tax est. 1.5%
- −$231 /mo · $2,775/yr
- Insurance
- −$77
- HOA
- −$0
- Vacancy / Maint / Mgmt
- −$726
- Net cashflow
- $1,453
Break-even live
Sensitivity live
| Price | -10% $1,581 | -5% $1,517 | +0% $1,453 | +5% $1,389 | +10% $1,325 |
|---|---|---|---|---|---|
| Rent | -10% $1,180 | -5% $1,316 | +0% $1,453 | +5% $1,590 | +10% $1,726 |
| Rate | -1.0pp $1,546 | -0.5pp $1,500 | base $1,453 | +0.5pp $1,405 | +1.0pp $1,356 |
UW: 25.0% down · 7.5% · 30yr · 1.5% tax · 5.0% vac · 8.0% maint · 8.0% mgmt
Financing live
Cash to close
- Down payment
- $46,250
- Closing costs
- $5,550
- Reserves months
- —
- Total cash needed
- —
Loan-product check · same deal, 3 products live
Conventional
25% down · 7.5% · 30yr
- Down + closing
- —
- Monthly P&I
- —
- Monthly cashflow
- —
- DSCR
- —
- Eligible?
- —
Personal DTI + credit; lowest rate.
DSCR
20% down · 8.5% · 30yr
- Down + closing
- —
- Monthly P&I
- —
- Monthly cashflow
- —
- DSCR
- —
- Eligible?
- —
No personal income docs; deal must DSCR.
Hard money
10% down · 12.0% · 12mo
- Down + closing
- —
- Monthly P&I
- —
- Monthly cashflow
- —
- DSCR
- —
- Eligible?
- —
Short-term bridge; refi at stabilization.
Rent comps 33 comps
| Address | Beds | Baths | Sqft | Rent | $/sqft | DOM | Units | Dist |
|---|---|---|---|---|---|---|---|---|
| 4455 Casa Grande Cir Cypress, CA | 1.0–2.0 | 1.0–1.5 | 811 | $2,837 | $3.50 | 2d | 6 | 0.20mi |
| 4550 Lincoln Ave Cypress, CA | 1.0–2.0 | 1.0–2.0 | 860 | $3,225 | $3.75 | 2d | 3 | 0.36mi |
| 8381 E Blithedale St Long Beach, CA | 3.0 | 2.0 | 1314 | $3,600 | $2.74 | 2d | 1 | 0.50mi |
| 12750 Centralia St Lakewood, CA | 2.0 | 1.0–1.5 | 1056 | $3,350 | $3.17 | 4d | 2 | 0.52mi |
| 12750 Centralia St #43 Lakewood, CA | 2.0 | 1.5 | 1056 | $3,500 | $3.31 | 18d | 1 | 0.55mi |
| 9424 Ethel St Cypress, CA | 3.0 | 2.5 | 1780 | $4,300 | $2.42 | 16d | 1 | 0.65mi |
| 9306 Gregory St Cypress, CA | 3.0 | 2.5 | 1840 | $4,500 | $2.45 | 19d | 1 | 0.66mi |
| 22003 Belshire Ave #9 Hawaiian Gardens, CA | 2.0 | 2.0 | 1140 | $2,900 | $2.54 | 44d | 1 | 0.66mi |
| 4801 Merten Ave Cypress, CA | 3.0 | 2.0 | 1500 | $3,875 | $2.58 | 2d | 1 | 0.70mi |
| 4812 Grace Ave Unit C Cypress, CA | 2.0 | 2.0 | 900 | $2,395 | $2.66 | 13d | 1 | 0.80mi |
| 8120 E Turbo St Long Beach, CA | 3.0 | 1.5 | 1120 | $3,900 | $3.48 | 44d | 1 | 0.81mi |
| 8561 Belmont St Unit 6 Cypress, CA | 3.0 | 2.5 | 1265 | $3,695 | $2.92 | 2d | 1 | 0.85mi |
| 8561 Belmont St Unit 7 Cypress, CA | 3.0 | 2.0 | 1320 | $4,145 | $3.14 | 11d | 1 | 0.85mi |
| 20817 Ely Ave Lakewood, CA | 3.0 | 1.0 | 1102 | $3,550 | $3.22 | 2d | 1 | 0.98mi |
| 21526 Juan Ave Hawaiian Gardens, CA | 2.0 | 2.0 | 1200 | $3,000 | $2.50 | 25d | 1 | 0.99mi |
| 4646 Larwin Ave Cypress, CA | 4.0 | 2.5 | 1562 | $3,800 | $2.43 | 2d | 1 | 1.01mi |
| 12050 226th St Hawaiian Gardens, CA | 3.0 | 2.0 | 1063 | $3,100 | $2.92 | 44d | 1 | 1.03mi |
| 12610 Vandemere St Lakewood, CA | 3.0 | 2.0 | 1056 | $8,250 | $7.81 | 2d | 1 | 1.05mi |
| 10403 Stratton Ct Cypress, CA | 4.0 | 2.5 | 1327 | $3,600 | $2.71 | 44d | 1 | 1.21mi |
| 12350 Del Amo Blvd Lakewood, CA | 1.0–3.0 | 1.0–2.0 | 866 | $3,173 | $3.66 | 3d | 27 | 1.24mi |
| 5475 Villa Way #34 Cypress, CA | 3.0 | 2.5 | 1374 | $3,600 | $2.62 | 3d | 1 | 1.24mi |
| 5477 Twin Lakes Dr Cypress, CA | 2.0 | 1.0 | 1156 | $2,495 | $2.16 | 2d | 1 | 1.25mi |
| 4002 Bryant Ct Cypress, CA | 3.0 | 1.5 | 1046 | $3,400 | $3.25 | 22d | 1 | 1.25mi |
| 10002 Saint Stephen Cir Cypress, CA | 3.0 | 1.5 | 1205 | $3,700 | $3.07 | 18d | 1 | 1.25mi |
| 5524 Camp St Cypress, CA | 4.0 | 3.0 | 1613 | $4,200 | $2.60 | 2d | 1 | 1.29mi |
| 8626 Watson St Unit 8650-E Cypress, CA | 2.0 | 1.0 | 900 | $2,350 | $2.61 | 11d | 1 | 1.29mi |
| 8626 Watson St Unit 8644 Cypress, CA | 2.0 | 1.0 | 900 | $2,450 | $2.72 | 2d | 1 | 1.29mi |
| 8791 Walker St Cypress, CA | 1.0–2.0 | 1.0 | 830 | $2,535 | $3.05 | 2d | 8 | 1.30mi |
| 12022 207th St Lakewood, CA | 3.0 | 2.0 | 1088 | $3,950 | $3.63 | 8d | 1 | 1.31mi |
| 12022 207th St Lakewood, CA | 3.0 | 2.0 | 1088 | $3,950 | $3.63 | 25d | 1 | 1.31mi |
| 21525 Pioneer Blvd Lakewood, CA | 2.0 | 2.0 | 910 | $2,595 | $2.85 | 44d | 1 | 1.37mi |
| 20726 Seine Ave Lakewood, CA | 3.0 | 2.0 | 1354 | $3,400 | $2.51 | 21d | 1 | 1.41mi |
| 20810 Arline Ave Apt 14 Lakewood, CA | 2.0 | 1.5 | 896 | $2,495 | $2.78 | 44d | 1 | 1.47mi |
Listing history 21 events
-
2026-06-18days on market $185,000 Active 75 DOM
-
2026-06-17days on market $185,000 Active 74 DOM
-
2026-06-16days on market $185,000 Active 73 DOM
-
2026-06-16price $185,000 Active 72 DOM
-
2026-06-15days on market $189,900 Active 72 DOM
-
2026-06-13days on market $189,900 Active 70 DOM
-
2026-06-13days on market $189,900 Active 69 DOM
-
2026-06-09days on market $189,900 Active 66 DOM
-
2026-06-08days on market $189,900 Active 65 DOM
-
2026-06-07days on market $189,900 Active 64 DOM
-
2026-06-04days on market $189,900 Active 61 DOM
-
2026-06-03days on market $189,900 Active 60 DOM
-
2026-06-02days on market $189,900 Active 59 DOM
-
2026-06-01days on market $189,900 Active 58 DOM
-
2026-05-31days on market $189,900 Active 57 DOM
-
2026-05-22price $195,000
-
2026-05-15price $197,000
-
2026-05-02price $199,900
-
2026-04-04$210,000 Active
-
2026-03-13historical
-
2025-11-29$210,000 Active
ⓘ Source: listings_history table (triggers on properties + properties_extension) + one-shot
backfill from property_details.listing_events for pre-trigger history.
Climate risk First Street
- Flood 1/10 Low FEMA zone X · 0% chance over 30 yrs
- Wildfire 1/10 Low
- Heat 5/10 Major 7 d/yr ≥89°F today · 24 d/yr by 30 yrs out
- Wind 1/10 Low
- Air quality 5/10 Major 7 unhealthy d/yr today · 9 by 30 yrs out
Nearby sold comps map
Loading sold comps map…
Walkable amenities ~0.75 mi
Loading nearby amenities…
Taxation est. · year 1
- Rental income
- $41,492
- − Mortgage interest
- −$10,363
- − Property taxes
- −$2,775
- − Insurance
- −$925
- − Repairs & maintenance
- −$3,319
- − Management
- −$3,319
- − Depreciation
- −$5,382
- Taxable income
- $15,408
- Est. tax owed @ 24.0%
- −$3,698
- After-tax cash flow
- $13,738/yr
For passive investors: Depreciation is non-cash, so a rental often shows a tax loss while cash-flowing — sheltering income. Rental losses are passive: they offset passive income freely, and up to $25,000/yr can offset ordinary (W-2) income if you actively participate and your MAGI is under $100k (phasing out to $0 by $150k); unused losses carry forward. On sale, claimed depreciation is recaptured at up to 25%, and gains may owe capital-gains tax (a 1031 exchange can defer both). Figures are a year-1 estimate at your 24.0% rate — not tax advice; consult a CPA.
Schools (NCES district)
- District
- Cypress Elementary
- NCES district ID
- 0610440
- Math proficiency
- 67% ▲ 1.00%
- Reading proficiency
- 69% ▲ 1.00%
- Median HH income
- $83,769
- Composite
- 62.21/100
- National rank
- #1446
- State rank
- #117 of 1400 in CA
Livability — Cypress
- Score
- 74/100
- State rank
- #141
- US rank
- #4900
Category grades
Schools grade is shown separately in the Schools card above.
Census & demographics
- Census place
- Cypress, CA
- County
- Orange County · 3,096,323 people
- City population
- 49,318
- Metro
- Los Angeles-Long Beach-Anaheim, CA
- Population (ZIP)
- 49,318
- Household income
- $130,154
- Rent vs Own
- Severe rent burden
- 1431.0
Population outlook (Orange County) Hauer SSP2
- Today (2025)
- 3,477,456 people
- By 2030
- 3,613,117 · +3.9%
- By 2040
- 3,835,945 · +10.3%
- By 2050
- 3,968,736 · +14.1%
- By 2075
- 4,097,053 · +17.8%
- By 2100
- 3,903,633 · +12.3%
Race, ethnicity, and origin ACS 2023
- Neighborhood character
- Highly diverse neighborhood (Simpson 0.71)
- Race & ethnicity
- Asian 37% White 31% Hispanic / Latino 22% Two or more races 14% Black 3%
- Hispanic origin (detail)
- Mexican 15%
- Common ancestry
- Lithuanian 2% Iranian 1% Italian 1%
- Foreign-born
- 31% · South Korea, Canada, China
- Languages at home
- 57% English-only · Spanish 12% Korean 11% Chinese 5%
Political lean MEDSL · Orange
- 2024 margin
- Toss-up / Even · D 49.7% · R 47.1% · Other 3.2%
- 2008→2024 swing
- +5.2pp toward D · 2008: -2.6pp · 2024: 2.6pp
- All cycles
- 2024: D+2.6 2020: D+9.0 2016: D+7.7 2012: R+8.3 2008: R+2.6
Not yet ingested
- Civics
- —
Market trends
- HPI YoY
- ▼ -870.99%
- Current HPI
- 402.6083
- Rent YoY
- ▲ 1.69%
- Metro
- Los Angeles-Long Beach-Anaheim, CA
- State GDP YoY
- ▲ 3.21%
- F500 in state
- 116
Industry mix (Fortune 500 HQ in CA)
| Industry | F500 HQs | Revenue |
|---|---|---|
| Technology | 27 | $1,492B |
|
||
| Financial Services | 3 | $174B |
|
||
| Retail | 3 | $44B |
|
||
| Insurance | 3 | $26B |
|
||
| Media / Entertainment | 2 | $115B |
|
||
| Pharmaceuticals / Biotech | 2 | $62B |
|
||
Price history
-7.1% since first listed6 events — show timeline
- 2026-05-22 Price Changed $195,000 CRMLS
- 2026-05-15 Price Changed $197,000 CRMLS
- 2026-05-02 Price Changed $199,900 CRMLS
- 2026-04-04 Listed $210,000 CRMLS
- 2026-03-13 Listing Removed — CRMLS
- 2025-11-29 Listed $210,000 CRMLS
Property tax history
-3.2%/yrLatest (2025): $313 · +2.5% YoY. Source: county tax records.
Cash-flow waterfall
monthlySold comps — $/sqft
last 12 mo · ≤1 miLoading sold comps…