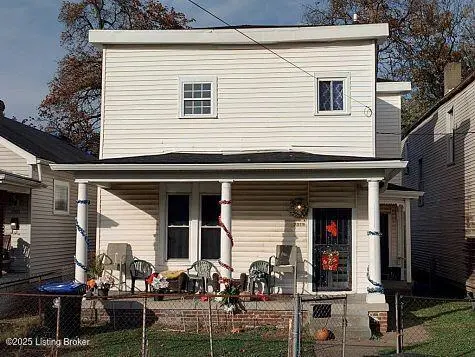
2319 Duncan St · Louisville, KY
Flood risk 1/10 · Minimal
- FEMA flood zone
- X (unshaded)
- Chance of flooding over 30 yrs
- 0.0%
- Est. flood insurance / yr
- $507 – $1,088
Fire risk 1/10 · Minimal
- Est. fire insurance / yr
- $839 – $1,559
Heat risk 5/10 · Moderate
- Hot days now (above 105°F)
- 7 days/yr
- Hot days in 30 yrs
- 20 days/yr
Wind risk 2/10 · Minimal
- Chance of severe wind over 30 yrs
- 1.0%
Air-quality risk 2/10 · Minimal
- Unhealthy air days now
- 1 days/yr
- Unhealthy air days in 30 yrs
- 2 days/yr
Risk factors via First Street. Map © Google.
Why this score? — see what drove the A grade
The composite is a weighted blend of 9 inputs, each scored 0–100. Each bar is that input's sub-score; the figure is the points it added to the 100-point composite (weight × sub-score).
- Cash flow +30.0/30.0
- ARV discount +15.0/15.0
- 1% rule +10.0/10.0
- DSCR +10.0/10.0
- Appreciation +10.0/10.0
- Livability +3.2/5.0
- Rent growth +2.6/5.0
- Condition / age +2.5/5.0
- Schools +2.3/10.0
$85,000
🖨 Deal sheet (PDF) 📄 Offer letter ✓ Due diligence
Key facts
- 6,046 sq ft lot
- Built 1900
- Listed 92 days
Property features AI
Finance
- HOA & community: No association fee
Exterior
- Utilities: Electricity connected
- Home design: Traditional single-family residence; 2 stories; Built in 1900
- Construction: Wood frame construction; Shingle roof
- Exterior features: Lot dimensions approximately 31 x 190
Interior
- Kitchen: Kitchen on the first floor
- Bedrooms: 5 bedrooms total; 1 bedroom on the first floor; 4 bedrooms on the second floor
- Bathrooms: 1 full bathroom; No half bathrooms
- Interior features: 8 total rooms; No basement; No fireplaces
- Laundry & utility: No first-floor laundry
Neighborhood map
What this means for you Summary
Snapshot
- This is a 5-bed/1.0-bath single-family listed at $85k.
Deal economics
- At list price, monthly cash flow is $813 ($10k/yr) — positive.
- The deal already cash-flows at list — no discount required.
- Meets the 1% rule at list price ($2k rent vs $85k).
- Recommended offer: $77k (9.0% below list) — sets the bar for market timing.
- Cap rate 17.8% vs local median 5.0% in Louisville — top-decile yield for the area; either an underpriced asset or a hidden risk that comps aren't pricing in. Stress-test before assuming the spread holds.
Location & tenants
- Location reads 63/100 on livability (#333 in KY) — a middle-class / working-renter tenant base. Strengths: cost of living A+, housing A+; Watch: employment C-, health & safety D+, schools D-.
- Jefferson County (urban): math 19% / reading 35% proficiency, ranked #121 of 165 in KY (top 73%) — low school quality limits family demand, transient renter base, plan for 1-2y turnover.
- Market conditions: Rents flat; 140 active listings in the ZIP; 4 comparable units currently listed for rent nearby; rentals at typical pace (median 18d on market — plan ~3-4 weeks tenant-placement turnaround); lower-income renter base — watch delinquency; 2,836 units permitted in Jefferson County in 2024 (1,558 in 5+ unit buildings).
Forward outlook
- In year one you build about $9k of equity ($588 loan paydown + $8k appreciation (10.0% local appreciation)).
- Jefferson County population projected at +13% by 2050 — modest demand growth; plan on rents tracking national, not racing it.
- At projected returns (10.0% appreciation + 0.5% rent growth), your $24k cash investment doubles in ~2 years — after that, you're playing with house money.
- By year 4, paydown + projected appreciation supports a ~$32k cash-out refi (75% LTV) — recoverable capital for the next deal without selling this one.
Negotiation context
- It's been on market 92 days — a 9% lower offer ($77k) is reasonable based on typical stale-listing flexibility.
- 5 sale attempts since 10y ago; this cycle's ask has dropped $25k (23%) from the opening price — seller is motivated, your offer sets the floor, not the list.
- Current owner paid $22k; list at $85k implies a 295% gain — meaningful room to come down on a strong offer.
Risks & watch-outs
- Watch-outs: built in 1900 — expect roof / HVAC / electrical / plumbing capex.
- Climate carrying-cost: extreme-heat days projected 7→20/yr by 2055 (HVAC capex compounding) — expect insurance premiums to compound above CPI over the hold.
Questions for the listing agent
- It's been on market 92 days. Have you received any prior offers? Is the seller open to a 9% concession, seller financing, or rate buy-down credit?
- Built in 1900 — when were the roof, HVAC, electrical panel, plumbing, and water heater last replaced?
- Why hasn't it sold? Are there any deal-killer items the seller is aware of (foundation, flood, title, zoning, code violations)?
- Is there a deadline driving the sale (1031 exchange, divorce, estate, relocation)? That informs how much negotiation room exists.
- Schools are D-rated, which usually means shorter tenancies and higher turnover. Who's the typical renter profile here, and what's been the actual vacancy rate?
- Crime grade is F in this area — have there been break-ins, vandalism, or insurance claims at this property in the last 3 years? What carrier currently insures it and at what premium?
- What's the average days-on-market for RENTAL listings here right now (not sales)? A rising rental-DOM trend means longer vacancies and softer asking-rent achievability than the comps imply.
- What's the recent tenant-quality profile in this submarket — average credit score on applications, eviction rate, late-payment / NSF rate, and stable-employment percentage? A property-management company in the area should have these aggregated.
- How much new for-sale + rental construction is in the pipeline within 1–3 miles? Heavy new supply typically softens prices + rents 12–24 months out; constrained supply supports both.
Investment metrics
- 1% rule
- 2.00% ✓
- Cap rate
- 17.78%
- Cash-on-cash
- 41.02%
- DSCR
- 2.82
- GRM
- 4.2
CMA / ARV
- ARV (on-the-fly)
- $163,200
- Comps found
- 7
Show comp detail 7 sales within ~0.75 mi
| Address | Dist | Beds/Ba | Sqft | Sold | Price | $/sf | Match |
|---|---|---|---|---|---|---|---|
| 2535 Duncan St | 0.22mi | 5/2.0 | 2,100 (-4%) | 10mo | $170,000 | $81 | 72 |
| 2013 Bank St | 0.38mi | 4/2.0 (-1) | 2,126 (-2%) | 2mo | $36,500 | $17 | 68 |
| 2628 Bank St | 0.50mi | 4/2.0 (-1) | 2,166 (-0%) | 2mo | $165,500 | $76 | 66 |
| 2523 Saint Xavier St | 0.34mi | 4/1.0 (-1) | 1,894 (-13%) | 9mo | $30,000 | $16 | 50 |
| 2424 Saint Xavier St | 0.26mi | 4/2.5 (-1) | 1,921 (-12%) | 19mo | $190,650 | $99 | 42 |
| 2513 W Chestnut St | 0.75mi | 4/2.0 (-1) | 2,108 (-3%) | 14mo | $144,000 | $68 | 40 |
| 2036 Portland Ave | 0.47mi | 5/1.5 | 1,890 (-13%) | 18mo | $141,300 | $75 | 39 |
Match score weights: distance 35% · size 25% · config 20% · recency 20%. Top-matched comps best support the ARV.
Projected returns pro-forma
10.0% appreciation · 0.51% rent growth · sell at horizon
- IRR
- 54.4%
- Equity multiple
- 4.95×
- Total profit
- $93,941
- Equity at exit
- $76,575
- IRR
- 47.0%
- Equity multiple
- 10.59×
- Total profit
- $228,276
- Equity at exit
- $165,136
Cash invested: $23,800 (down + closing). Projections, not guarantees.
Landlord ↔ Tenant lean methodology
- Overall (STATE)
- 83 Strongly Landlord-Friendly
- State Kentucky
- 83 Strongly Landlord-Friendly · R+16
- County
- — inherits STATE
- City
- — inherits STATE
ZIP-level market 40212
- Home prices YoY
- 11.0%
- Rents YoY
- 0.5%
- Active inventory
- 140
- Price-to-rent
- 4.2×
Monthly cashflow live
- Estimated rent
- $1,699 medium interval (Pro) →
- Mortgage (P&I)
- −$446
- Tax from tax record
- −$48 /mo · $570/yr
- Insurance
- −$35
- HOA
- −$0
- Vacancy / Maint / Mgmt
- −$357
- Net cashflow
- $813
Break-even live
Sensitivity live
| Price | -10% $862 | -5% $838 | +0% $813 | +5% $789 | +10% $765 |
|---|---|---|---|---|---|
| Rent | -10% $679 | -5% $746 | +0% $813 | +5% $881 | +10% $948 |
| Rate | -1.0pp $856 | -0.5pp $835 | base $813 | +0.5pp $791 | +1.0pp $769 |
UW: 25.0% down · 7.5% · 30yr · 1.5% tax · 5.0% vac · 8.0% maint · 8.0% mgmt
Financing live
Cash to close
- Down payment
- $21,250
- Closing costs
- $2,550
- Reserves months
- —
- Total cash needed
- —
Loan-product check · same deal, 3 products live
Conventional
25% down · 7.5% · 30yr
- Down + closing
- —
- Monthly P&I
- —
- Monthly cashflow
- —
- DSCR
- —
- Eligible?
- —
Personal DTI + credit; lowest rate.
DSCR
20% down · 8.5% · 30yr
- Down + closing
- —
- Monthly P&I
- —
- Monthly cashflow
- —
- DSCR
- —
- Eligible?
- —
No personal income docs; deal must DSCR.
Hard money
10% down · 12.0% · 12mo
- Down + closing
- —
- Monthly P&I
- —
- Monthly cashflow
- —
- DSCR
- —
- Eligible?
- —
Short-term bridge; refi at stabilization.
Rent comps 4 comps
| Address | Beds | Baths | Sqft | Rent | $/sqft | DOM | Units | Dist |
|---|---|---|---|---|---|---|---|---|
| 205 N 26th St Louisville, KY | 5.0 | 2.0 | 1538 | $1,700 | $1.11 | 24d | 1 | 0.28mi |
| 2319 W Muhammad Ali Blvd Louisville, KY | 4.0 | 1.0 | 1644 | $1,300 | $0.79 | 16d | 1 | 0.56mi |
| 858 S 23rd St Louisville, KY | 5.0 | 1.0 | 2228 | $2,100 | $0.94 | 17d | 1 | 1.26mi |
| 820 Hazel St Louisville, KY | 4.0 | 2.0 | 1872 | $1,395 | $0.75 | 3d | 1 | 1.46mi |
Listing history 32 events
-
2026-06-18days on market $85,000 Active 92 DOM
-
2026-06-17days on market $85,000 Active 91 DOM
-
2026-06-16days on market $85,000 Active 90 DOM
-
2026-06-15days on market $85,000 Active 89 DOM
-
2026-06-13days on market $85,000 Active 87 DOM
-
2026-06-10days on market $85,000 Active 84 DOM
-
2026-06-09days on market $85,000 Active 83 DOM
-
2026-06-08days on market $85,000 Active 82 DOM
-
2026-06-07days on market $85,000 Active 81 DOM
-
2026-06-03days on market $85,000 Active 77 DOM
-
2026-06-02days on market $85,000 Active 76 DOM
-
2026-06-01days on market $85,000 Active 75 DOM
-
2026-05-31days on market $85,000 Active 74 DOM
-
2026-05-04price $85,000
-
2026-04-28price $90,000
-
2026-04-23price $95,000
-
2026-04-14price $100,000
-
2026-03-18$110,000 Active
-
2025-09-30historical
-
2025-08-18$115,000 Active
-
2025-07-09historical
-
2025-07-03$125,000 Active
-
2020-11-06soldstatus $21,500 Closed
-
2020-10-18historical Active Under Contract
-
2020-10-14$30,000 Active
-
2017-01-06historical
-
2016-04-07$40,000 Active
-
2016-04-07price $24,999
-
2016-04-07price $24,998
-
2016-04-07price $19,899
-
2016-04-07price $19,900
-
2016-04-07price $25,000
ⓘ Source: listings_history table (triggers on properties + properties_extension) + one-shot
backfill from property_details.listing_events for pre-trigger history.
Tax reassessment forecast KY · Resets to sale price
- Current annual tax
- $570 · $48/mo
- Projected year-2 tax
- $731 · $61/mo
- Expected delta
- +$161/yr (+$13/mo · 28.2%)
ⓘ Screening estimate from a state-policy table — verify with the county assessor before closing.
Climate risk First Street
- Flood 1/10 Low FEMA zone X (unshaded) · 0% chance over 30 yrs
- Wildfire 1/10 Low
- Heat 5/10 Major 7 d/yr ≥105°F today · 20 d/yr by 30 yrs out
- Wind 2/10 Low 100% chance of damaging wind over 30 yrs
- Air quality 2/10 Low 1 unhealthy d/yr today · 2 by 30 yrs out
Nearby sold comps map
Loading sold comps map…
Walkable amenities ~0.75 mi
Loading nearby amenities…
Taxation est. · year 1
- Rental income
- $20,388
- − Mortgage interest
- −$4,761
- − Property taxes
- −$570
- − Insurance
- −$425
- − Repairs & maintenance
- −$1,631
- − Management
- −$1,631
- − Depreciation
- −$2,473
- Taxable income
- $8,896
- Est. tax owed @ 24.0%
- −$2,135
- After-tax cash flow
- $7,627/yr
For passive investors: Depreciation is non-cash, so a rental often shows a tax loss while cash-flowing — sheltering income. Rental losses are passive: they offset passive income freely, and up to $25,000/yr can offset ordinary (W-2) income if you actively participate and your MAGI is under $100k (phasing out to $0 by $150k); unused losses carry forward. On sale, claimed depreciation is recaptured at up to 25%, and gains may owe capital-gains tax (a 1031 exchange can defer both). Figures are a year-1 estimate at your 24.0% rate — not tax advice; consult a CPA.
Schools (NCES district)
- District
- Jefferson County
- NCES district ID
- 2102990
- Math proficiency
- 19% ▼ -17.00%
- Reading proficiency
- 35% ▼ -11.00%
- Median HH income
- $47,885
- Composite
- 23.45/100
- National rank
- #7884
- State rank
- #121 of 165 in KY
Livability — Louisville
- Score
- 63/100
- State rank
- #333
- US rank
- #15887
Category grades
Schools grade is shown separately in the Schools card above.
Census & demographics
- Census place
- Louisville, KY
- County
- Jefferson County · 790,184 people
- City population
- 769,292
- Metro
- Louisville/Jefferson County, KY-IN
- Population (ZIP)
- 14,661
- Household income
- $35,753
- Rent vs Own
- Severe rent burden
- 1148.0
Population outlook (Jefferson County) Hauer SSP2
- Today (2025)
- 823,112 people
- By 2030
- 849,343 · +3.2%
- By 2040
- 895,696 · +8.8%
- By 2050
- 933,630 · +13.4%
- By 2075
- 1,028,262 · +24.9%
- By 2100
- 1,072,675 · +30.3%
Race, ethnicity, and origin ACS 2023
- Neighborhood character
- Majority Black (60%)
- Race & ethnicity
- Black 60% White 37% Two or more races 2% Hispanic / Latino 1%
- Common ancestry
- Slovak 1% Lithuanian 1% Iranian 1%
- Foreign-born
- 1% · Canada
- Languages at home
- 98% English-only · Spanish 1%
Political lean MEDSL · Jefferson
- 2024 margin
- D (+16.6) · D 57.4% · R 40.9% · Other 1.7%
- 2008→2024 swing
- +4.5pp toward D · 2008: 12.0pp · 2024: 16.6pp
- All cycles
- 2024: D+16.6 2020: D+20.1 2016: D+13.3 2012: D+11.1 2008: D+12.0
Not yet ingested
- Civics
- —
Market trends
- HPI YoY
- ▲ 29.02%
- Current HPI
- 293.2624
- Rent YoY
- ▲ 0.51%
- Metro
- Louisville/Jefferson County, KY-IN
- State GDP YoY
- ▲ 1.81%
- F500 in state
- 4
Industry mix (Fortune 500 HQ in KY)
| Industry | F500 HQs | Revenue |
|---|---|---|
| Healthcare | 1 | $118B |
|
||
| Food / Beverage | 1 | $7B |
|
||
Price history
+240.0% since first listed19 events — show timeline
- 2026-05-04 Price Changed $85,000 Metro Search MLS
- 2026-04-28 Price Changed $90,000 Metro Search MLS
- 2026-04-23 Price Changed $95,000 Metro Search MLS
- 2026-04-14 Price Changed $100,000 Metro Search MLS
- 2026-03-18 Listed $110,000 Metro Search MLS
- 2025-09-30 Listing Removed — Metro Search MLS
- 2025-08-18 Listed $115,000 Metro Search MLS
- 2025-07-09 Listing Removed — Metro Search MLS
- 2025-07-03 Listed $125,000 Metro Search MLS
- 2020-11-06 Sold (MLS) $21,500 Metro Search MLS
- 2020-10-18 Contingent — Metro Search MLS
- 2020-10-14 Listed $30,000 Metro Search MLS
- 2017-01-06 Listing Removed — Metro Search MLS
- 2016-04-07 Listed $40,000 Metro Search MLS
- 2016-04-07 Price Changed $25,000 Metro Search MLS
- 2016-04-07 Price Changed $19,900 Metro Search MLS
- 2016-04-07 Price Changed $19,899 Metro Search MLS
- 2016-04-07 Price Changed $24,998 Metro Search MLS
- 2016-04-07 Price Changed $24,999 Metro Search MLS
Property tax history
+23.8%/yrLatest (2025): $570 · -1.9% YoY. Source: county tax records.
Cash-flow waterfall
monthlySold comps — $/sqft
last 12 mo · ≤1 miLoading sold comps…