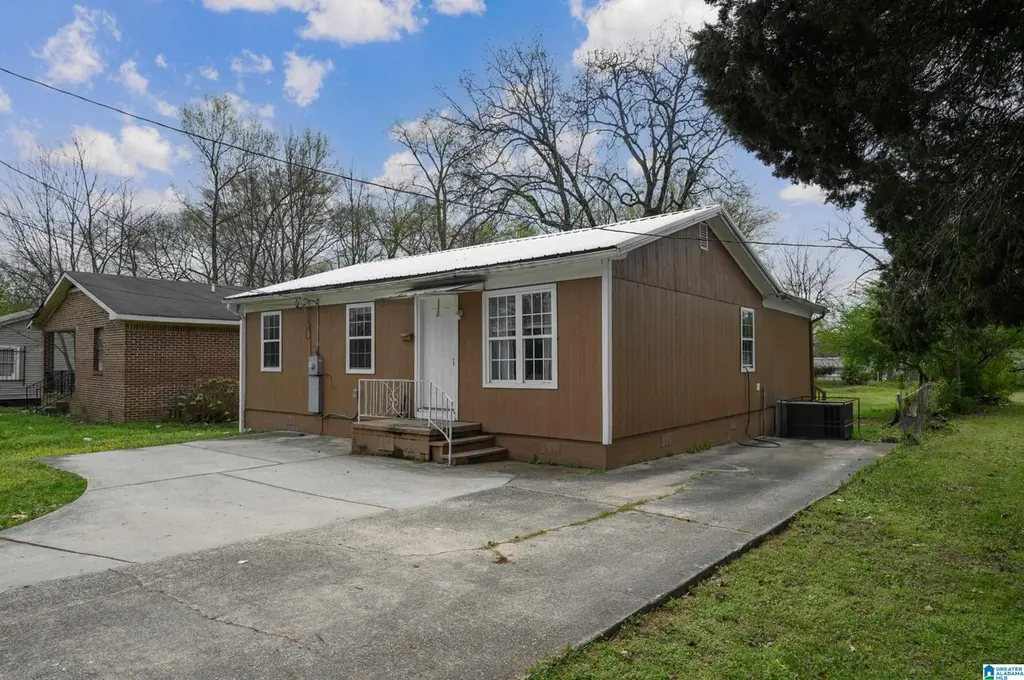
722 9th St N · Bessemer, AL
Flood risk 3/10 · Minor
- FEMA flood zone
- X (unshaded)
- Chance of flooding over 30 yrs
- 0.2%
- Est. flood insurance / yr
- $507 – $1,088
Fire risk 2/10 · Minimal
- Est. fire insurance / yr
- $916 – $1,700
Heat risk 7/10 · Major
- Hot days now (above 108°F)
- 7 days/yr
- Hot days in 30 yrs
- 19 days/yr
Wind risk 6/10 · Moderate
- Chance of severe wind over 30 yrs
- 36.0%
Air-quality risk 3/10 · Minor
- Unhealthy air days now
- 2 days/yr
- Unhealthy air days in 30 yrs
- 5 days/yr
Risk factors via First Street. Map © Google.
Why this score? — see what drove the D grade
The composite is a weighted blend of 9 inputs, each scored 0–100. Each bar is that input's sub-score; the figure is the points it added to the 100-point composite (weight × sub-score).
- Cash flow +21.3/30.0
- DSCR +6.8/10.0
- 1% rule +5.6/10.0
- Livability +3.0/5.0
- Condition / age +2.5/5.0
- Rent growth +1.7/5.0
- Schools +0.8/10.0
- ARV discount +0.0/15.0
- Appreciation +0.0/10.0
$110,000
🖨 Deal sheet (PDF) 📄 Offer letter ✓ Due diligence
Listing remarks MLS
This immaculately maintained, move-in-ready gem at 722 9th Street N is the perfect "turn-key" opportunity for a savvy investor looking for a high-demand rental or a first-time buyer seeking a stress-free start. The home shines with pride of ownership, offering a bright and spacious layout that is ready for immediate occupancy without the hassle of renovations. Ideally located in the heart of Bessemer’s Marvel City, you're just minutes away from local icons like the legendary Bright Star Restaurant, essential shopping at Bessemer Plaza, and top-tier care at UAB Medical West. With easy access to I-20/59 for a quick commute to Birmingham and proximity to DeBardeleben Park, this property perfectly balances neighborhood charm with modern convenience.
Key facts
- Easy access
- High-demand rental
- Turn-key opportunity
Tags
Neighborhood map
What this means for you Summary
Snapshot
- This is a 3-bed/1.5-bath single-family listed at $110k.
Deal economics
- At list price, monthly cash flow is $162 ($2k/yr) — positive.
- The deal already cash-flows at list — no discount required.
- Meets the 1% rule at list price ($1k rent vs $110k).
- Recommended offer: $103k (6.0% below list) — sets the bar for market timing.
- Cap rate 8.1% vs local median 5.9% in Bessemer — top-decile yield for the area; either an underpriced asset or a hidden risk that comps aren't pricing in. Stress-test before assuming the spread holds.
Location & tenants
- Location reads 59/100 on livability (#331 in AL) — a working-class tenant base; expect higher turnover. Strengths: commute A+, cost of living A+, housing A; Watch: crime F, amenities F, employment F.
- Bessemer City (suburban): math 3% / reading 19% proficiency, ranked #120 of 129 in AL (top 93%) — low school quality limits family demand, transient renter base, plan for 1-2y turnover; 87% free/reduced lunch — lower-income household profile, screen leases tightly.
- Zoned schools: Jonesboro Elementary School (math 3% / reading 15%, grade F, #593 of 627 statewide, top 95%, 525 students, 78% FRL); Bessemer City Middle School (math 3% / reading 23%, grade F, #215 of 257 statewide, top 84%, 674 students, 88% FRL); Bessemer City High School (math 2% / reading 8%, grade F, #276 of 305 statewide, top 95%, 850 students, 61% FRL).
- Market conditions: Rents falling (-3.1%/yr); 116 active listings in the ZIP; 33 comparable units currently listed for rent nearby; rentals at typical pace (median 25d on market — plan ~3-4 weeks tenant-placement turnaround); lower-income renter base — watch delinquency; 2,114 units permitted in Jefferson County in 2024 (556 in 5+ unit buildings).
- This rent runs 39% of the median local income ($35k/yr) — at the standard rent-burdened threshold; future hikes will face affordability resistance.
Forward outlook
- Local home prices are declining (-3.0%/yr); year-one equity from $761 of loan paydown is wiped out by about $3k of value loss. Plan a longer hold.
- Jefferson County population projected to shrink 4% by 2050 — rents likely to lag national; underwrite the cash flow, not the appreciation.
Negotiation context
- It's been on market 75 days — a 6% lower offer ($103k) is reasonable based on typical stale-listing flexibility.
- 2 sale attempts since 5y ago; this cycle's ask has dropped $25k (19%) from the opening price — seller is motivated, your offer sets the floor, not the list.
Risks & watch-outs
- Watch-outs: built in 1955 — expect roof / HVAC / electrical / plumbing capex.
- Climate carrying-cost: major wind risk, 36% chance of damaging wind over 30y; extreme-heat days projected 7→19/yr by 2055 (HVAC capex compounding) — expect insurance premiums to compound above CPI over the hold.
Questions for the listing agent
- It's been on market 75 days. Have you received any prior offers? Is the seller open to a 6% concession, seller financing, or rate buy-down credit?
- Built in 1955 — when were the roof, HVAC, electrical panel, plumbing, and water heater last replaced?
- Why hasn't it sold? Are there any deal-killer items the seller is aware of (foundation, flood, title, zoning, code violations)?
- Is there a deadline driving the sale (1031 exchange, divorce, estate, relocation)? That informs how much negotiation room exists.
- Schools are D-rated, which usually means shorter tenancies and higher turnover. Who's the typical renter profile here, and what's been the actual vacancy rate?
- Crime grade is F in this area — have there been break-ins, vandalism, or insurance claims at this property in the last 3 years? What carrier currently insures it and at what premium?
- The area grade is low — what's the realistic commute time and amenity access for the typical tenant pool here? Any planned neighborhood developments (good or bad) we should know about?
- What's the average days-on-market for RENTAL listings here right now (not sales)? A rising rental-DOM trend means longer vacancies and softer asking-rent achievability than the comps imply.
- What's the recent tenant-quality profile in this submarket — average credit score on applications, eviction rate, late-payment / NSF rate, and stable-employment percentage? A property-management company in the area should have these aggregated.
- How much new for-sale + rental construction is in the pipeline within 1–3 miles? Heavy new supply typically softens prices + rents 12–24 months out; constrained supply supports both.
Investment metrics
- 1% rule
- 1.06% ✓
- Cap rate
- 8.05%
- Cash-on-cash
- 6.29%
- DSCR
- 1.28
- GRM
- 7.9
CMA / ARV
- ARV (median comp)
- $80,492
- List price
- $110,000
- Delta
- 36.66%
- Verdict
- OVERPRICED
- Comps
- 20 within 1.0 mi
Show comp detail 12 sales within ~0.75 mi
| Address | Dist | Beds/Ba | Sqft | Sold | Price | $/sf | Match |
|---|---|---|---|---|---|---|---|
| 1003 10th Ave N | 0.26mi | 3/2.0 | 1,372 (+1%) | 1mo | $55,000 | $40 | 84 |
| 529 12th St N | 0.35mi | 3/2.0 | 1,347 (-1%) | 10mo | $90,000 | $67 | 72 |
| 1009 Westlake Blvd | 0.43mi | 2/1.5 (-1) | 1,257 (-8%) | 1mo | $20,000 | $16 | 61 |
| 1500 7th Ave N | 0.59mi | 3/2.0 | 1,421 (+4%) | 3mo | $46,000 | $32 | 61 |
| 820 N 3rd Ave | 0.37mi | 3/1.5 | 1,288 (-5%) | 17mo | $23,200 | $18 | 60 |
| 711 12th St | 0.32mi | 3/1.0 | 1,200 (-12%) | 13mo | $68,500 | $57 | 52 |
| 1024 Simmons St | 0.51mi | 3/1.0 | 1,180 (-13%) | 3mo | $24,999 | $21 | 50 |
| 201 W Lake Dr | 0.67mi | 3/1.0 | 1,404 (+3%) | 14mo | $79,900 | $57 | 50 |
| 515 Ridge Ave | 0.47mi | 3/2.0 | 1,202 (-12%) | 10mo | $182,500 | $152 | 48 |
| 415 4th Ave N | 0.49mi | 2/1.0 (-1) | 1,262 (-7%) | 16mo | $26,000 | $21 | 45 |
| 1129 13th St N | 0.62mi | 3/1.0 | 1,272 (-6%) | 16mo | $80,000 | $63 | 45 |
| 1204 13th Ave N | 0.62mi | 3/1.0 | 1,176 (-14%) | 15mo | $79,900 | $68 | 34 |
Match score weights: distance 35% · size 25% · config 20% · recency 20%. Top-matched comps best support the ARV.
Projected returns pro-forma
-3.0% appreciation · 0.0% rent growth · sell at horizon
- IRR
- -10.0%
- Equity multiple
- 0.65×
- Total profit
- $-10,930
- Equity at exit
- $16,401
- IRR
- -5.4%
- Equity multiple
- 0.70×
- Total profit
- $-9,377
- Equity at exit
- $9,511
Cash invested: $30,800 (down + closing). Projections, not guarantees.
Landlord ↔ Tenant lean methodology
- Overall (STATE)
- 90 Strongly Landlord-Friendly
- State Alabama
- 90 Strongly Landlord-Friendly · R+15
- County
- — inherits STATE
- City
- — inherits STATE
ZIP-level market 35020
- Home prices YoY
- -24.2%
- Rents YoY
- -3.1%
- Active inventory
- 116
- Price-to-rent
- 7.9×
Monthly cashflow live
- Estimated rent
- $1,163 high interval (Pro) →
- Mortgage (P&I)
- −$577
- Tax from tax record
- −$134 /mo · $1,613/yr
- Insurance
- −$46
- HOA
- −$0
- Vacancy / Maint / Mgmt
- −$244
- Net cashflow
- $162
Break-even live
Sensitivity live
| Price | -10% $224 | -5% $193 | +0% $162 | +5% $130 | +10% $99 |
|---|---|---|---|---|---|
| Rent | -10% $70 | -5% $116 | +0% $162 | +5% $207 | +10% $253 |
| Rate | -1.0pp $217 | -0.5pp $189 | base $162 | +0.5pp $133 | +1.0pp $104 |
UW: 25.0% down · 7.5% · 30yr · 1.5% tax · 5.0% vac · 8.0% maint · 8.0% mgmt
Financing live
Cash to close
- Down payment
- $27,500
- Closing costs
- $3,300
- Reserves months
- —
- Total cash needed
- —
Loan-product check · same deal, 3 products live
Conventional
25% down · 7.5% · 30yr
- Down + closing
- —
- Monthly P&I
- —
- Monthly cashflow
- —
- DSCR
- —
- Eligible?
- —
Personal DTI + credit; lowest rate.
DSCR
20% down · 8.5% · 30yr
- Down + closing
- —
- Monthly P&I
- —
- Monthly cashflow
- —
- DSCR
- —
- Eligible?
- —
No personal income docs; deal must DSCR.
Hard money
10% down · 12.0% · 12mo
- Down + closing
- —
- Monthly P&I
- —
- Monthly cashflow
- —
- DSCR
- —
- Eligible?
- —
Short-term bridge; refi at stabilization.
Rent comps 33 comps
| Address | Beds | Baths | Sqft | Rent | $/sqft | DOM | Units | Dist |
|---|---|---|---|---|---|---|---|---|
| 830 5th Ave N Bessemer, AL | 3.0 | 1.0 | 1072 | $1,000 | $0.93 | 45d | 1 | 0.20mi |
| 806 4th Ave N Bessemer, AL | 3.0 | 1.0 | 1092 | $1,050 | $0.96 | 25d | 1 | 0.28mi |
| 1015 11th St N Bessemer, AL | 2.0 | 1.0 | 876 | $975 | $1.11 | 13d | 1 | 0.36mi |
| 531 W Lake Dr Bessemer, AL | 3.0 | 1.0 | 1014 | $1,200 | $1.18 | 4d | 1 | 0.40mi |
| 512 W Lake Dr Bessemer, AL | 3.0 | 1.0 | 944 | $1,125 | $1.19 | 13d | 1 | 0.44mi |
| 510 W Lake Dr Bessemer, AL | 3.0 | 1.0 | 950 | $1,025 | $1.08 | 17d | 1 | 0.44mi |
| 1307 3rd Ave N Bessemer, AL | 4.0 | 1.0 | 960 | $1,200 | $1.25 | 45d | 1 | 0.58mi |
| 817 15th St N Bessemer, AL | 3.0 | 2.0 | 1116 | $1,125 | $1.01 | 4d | 1 | 0.62mi |
| 719 16th St N Bessemer, AL | 3.0 | 1.5 | 1085 | $1,075 | $0.99 | 25d | 1 | 0.70mi |
| 10 Center St Bessemer, AL | 3.0 | 1.0 | 1152 | $1,000 | $0.87 | 45d | 1 | 0.92mi |
| 18 Center St Bessemer, AL | 3.0 | 1.0 | 1418 | $1,100 | $0.78 | 45d | 1 | 0.93mi |
| 931 Dartmouth Ave Bessemer, AL | 3.0 | 1.0 | 984 | $925 | $0.94 | 45d | 1 | 0.94mi |
| 300 Norwood Ave Bessemer, AL | 3.0 | 1.0 | 966 | $1,000 | $1.04 | 25d | 1 | 0.95mi |
| 300 Norwood Ave Bessemer, AL | 3.0 | 1.0 | 966 | $900 | $0.93 | 13d | 1 | 0.95mi |
| 200 Center St Bessemer, AL | 3.0 | 1.5 | 1826 | $1,200 | $0.66 | 12d | 1 | 0.96mi |
| 434 Bryant St Bessemer, AL | 4.0 | 2.0 | 1540 | $1,523 | $0.99 | 5d | 1 | 1.06mi |
| 306 W Lake Cir SW Bessemer, AL | 1.0–3.0 | 1.0–2.0 | 1004 | $1,455 | $1.45 | 3d | 1 | 1.07mi |
| 808 Fairfax Ave Bessemer, AL | 3.0 | 1.0 | 1042 | $1,050 | $1.01 | 25d | 1 | 1.08mi |
| 810 Fairfax Ave Bessemer, AL | 3.0 | 1.0 | 1042 | $1,050 | $1.01 | 25d | 1 | 1.08mi |
| 320 16th St S Bessemer, AL | 3.0 | 1.5 | 1792 | $950 | $0.53 | 45d | 1 | 1.12mi |
| 2028 13th St N Bessemer, AL | 3.0 | 2.0 | 1372 | $1,073 | $0.78 | 25d | 1 | 1.18mi |
| 236 Clifton St Bessemer, AL | 3.0 | 1.0 | 1450 | $1,100 | $0.76 | 45d | 1 | 1.20mi |
| 63 Bluebell St Bessemer, AL | 4.0 | 2.0 | 1232 | $1,399 | $1.14 | 17d | 1 | 1.26mi |
| 2129 13th St N Bessemer, AL | 4.0 | 1.0 | 1378 | $1,445 | $1.05 | 16d | 1 | 1.27mi |
| 1929 15th St N Bessemer, AL | 3.0 | 2.0 | 1140 | $1,250 | $1.10 | 21d | 1 | 1.29mi |
| 704 Avenue I Bessemer, AL | 3.0 | 1.0 | 1232 | $1,200 | $0.97 | 25d | 1 | 1.29mi |
| 1622 Fairfax Ave Bessemer, AL | 2.0 | 2.0 | 1104 | $995 | $0.90 | 3d | 1 | 1.32mi |
| 420 19th St S Bessemer, AL | 2.0 | 1.0 | 910 | $850 | $0.93 | 45d | 1 | 1.36mi |
| 1830 Exeter Ave Bessemer, AL | 2.0 | 1.0 | 913 | $850 | $0.93 | 45d | 1 | 1.37mi |
| 1314 22nd Ave N Bessemer, AL | 3.0 | 1.0 | 1038 | $1,000 | $0.96 | 45d | 1 | 1.37mi |
| 419 19th St S Bessemer, AL | 3.0 | 2.0 | 1200 | $1,050 | $0.88 | 13d | 1 | 1.39mi |
| 1811 Fairfax Ave Bessemer, AL | 4.0 | 2.0 | 1732 | $1,350 | $0.78 | 25d | 1 | 1.45mi |
| 1600 Holbrook Ave Bessemer, AL | 3.0 | 1.0 | 885 | $999 | $1.13 | 3d | 1 | 1.45mi |
Listing history 11 events
-
2026-06-03days on market $110,000 Active 75 DOM
-
2026-06-02days on market $110,000 Active 74 DOM
-
2026-06-01days on market $110,000 Active 73 DOM
-
2026-05-31days on market $110,000 Active 72 DOM
-
2026-05-14price $110,000 771-char remark
Show marketing remark (771 chars)
This immaculately maintained, move-in-ready gem at 722 9th Street N is the perfect "turn-key" opportunity for a savvy investor looking for a high-demand rental or a first-time buyer seeking a stress-free start. The home shines with pride of ownership, offering a bright and spacious layout that is ready for immediate occupancy without the hassle of renovations. Ideally located in the heart of Bessemer’s Marvel City, you're just minutes away from local icons like the legendary Bright Star Restaurant, essential shopping at Bessemer Plaza, and top-tier care at UAB Medical West. With easy access to I-20/59 for a quick commute to Birmingham and proximity to DeBardeleben Park, this property perfectly balances neighborhood charm with modern convenience.
-
2026-04-14price $125,000 771-char remark
Show marketing remark (771 chars)
This immaculately maintained, move-in-ready gem at 722 9th Street N is the perfect "turn-key" opportunity for a savvy investor looking for a high-demand rental or a first-time buyer seeking a stress-free start. The home shines with pride of ownership, offering a bright and spacious layout that is ready for immediate occupancy without the hassle of renovations. Ideally located in the heart of Bessemer’s Marvel City, you're just minutes away from local icons like the legendary Bright Star Restaurant, essential shopping at Bessemer Plaza, and top-tier care at UAB Medical West. With easy access to I-20/59 for a quick commute to Birmingham and proximity to DeBardeleben Park, this property perfectly balances neighborhood charm with modern convenience.
-
2026-03-20$135,000 Active 771-char remark
Show marketing remark (771 chars)
This immaculately maintained, move-in-ready gem at 722 9th Street N is the perfect "turn-key" opportunity for a savvy investor looking for a high-demand rental or a first-time buyer seeking a stress-free start. The home shines with pride of ownership, offering a bright and spacious layout that is ready for immediate occupancy without the hassle of renovations. Ideally located in the heart of Bessemer’s Marvel City, you're just minutes away from local icons like the legendary Bright Star Restaurant, essential shopping at Bessemer Plaza, and top-tier care at UAB Medical West. With easy access to I-20/59 for a quick commute to Birmingham and proximity to DeBardeleben Park, this property perfectly balances neighborhood charm with modern convenience.
-
2021-11-19soldstatus $120,000
-
2021-11-18soldstatus $120,000 95-char remark
Show marketing remark (95 chars)
Beautiful home in Bessemer with 3 bedrooms and 2 bathrooms. Nice interior - living and kitchen!
-
2021-10-05soldstatus $53,000
-
2021-09-17$120,000 95-char remark
Show marketing remark (95 chars)
Beautiful home in Bessemer with 3 bedrooms and 2 bathrooms. Nice interior - living and kitchen!
ⓘ Source: listings_history table (triggers on properties + properties_extension) + one-shot
backfill from property_details.listing_events for pre-trigger history.
Tax reassessment forecast AL · Resets to sale price
- Current annual tax
- $1,613 · $134/mo
- Projected year-2 tax
- $1,613 · $134/mo
- Expected delta
- $0/yr ($0/mo · 0.0%)
ⓘ Screening estimate from a state-policy table — verify with the county assessor before closing.
Climate risk First Street
- Flood 3/10 Moderate FEMA zone X (unshaded) · 20% chance over 30 yrs
- Wildfire 2/10 Low
- Heat 7/10 Severe 7 d/yr ≥108°F today · 19 d/yr by 30 yrs out
- Wind 6/10 Major 36% chance of damaging wind over 30 yrs
- Air quality 3/10 Moderate 2 unhealthy d/yr today · 5 by 30 yrs out
Nearby sold comps map
Loading sold comps map…
Walkable amenities ~0.75 mi
Loading nearby amenities…
Taxation est. · year 1
- Rental income
- $13,954
- − Mortgage interest
- −$6,162
- − Property taxes
- −$1,613
- − Insurance
- −$550
- − Repairs & maintenance
- −$1,116
- − Management
- −$1,116
- − Depreciation
- −$3,200
- Taxable income
- $196
- Est. tax owed @ 24.0%
- −$47
- After-tax cash flow
- $1,891/yr
For passive investors: Depreciation is non-cash, so a rental often shows a tax loss while cash-flowing — sheltering income. Rental losses are passive: they offset passive income freely, and up to $25,000/yr can offset ordinary (W-2) income if you actively participate and your MAGI is under $100k (phasing out to $0 by $150k); unused losses carry forward. On sale, claimed depreciation is recaptured at up to 25%, and gains may owe capital-gains tax (a 1031 exchange can defer both). Figures are a year-1 estimate at your 24.0% rate — not tax advice; consult a CPA.
Schools (NCES district)
- District
- Bessemer City
- NCES district ID
- 0100330
- Math proficiency
- 3% ▼ -18.00%
- Reading proficiency
- 19% ▼ -3.00%
- Median HH income
- $29,721
- Composite
- 8.45/100
- National rank
- #9905
- State rank
- #120 of 129 in AL
Livability — Bessemer
- Score
- 59/100
- State rank
- #331
- US rank
- #20078
Category grades
Schools grade is shown separately in the Schools card above.
Census & demographics
- Census place
- Bessemer, AL
- County
- Jefferson County · 527,445 people
- City population
- 48,018
- Metro
- Birmingham-Hoover, AL
- Population (ZIP)
- 24,892
- Household income
- $35,362
- Rent vs Own
- Severe rent burden
- 1001.0
Population outlook (Jefferson County) Hauer SSP2
- Today (2025)
- 669,185 people
- By 2030
- 669,694 · +0.1%
- By 2040
- 661,388 · -1.2%
- By 2050
- 643,086 · -3.9%
- By 2075
- 577,267 · -13.7%
- By 2100
- 474,758 · -29.1%
Race, ethnicity, and origin ACS 2023
- Neighborhood character
- Predominantly Black (74%)
- Race & ethnicity
- Black 74% Hispanic / Latino 13% White 11% Two or more races 6%
- Hispanic origin (detail)
- Mexican 10%
- Foreign-born
- 5% · Canada
- Languages at home
- 89% English-only · Spanish 11%
Political lean MEDSL · Jefferson
- 2024 margin
- D (+10.4) · D 54.6% · R 44.2% · Other 1.2%
- 2008→2024 swing
- +5.4pp toward D · 2008: 5.1pp · 2024: 10.4pp
- All cycles
- 2024: D+10.4 2020: D+13.2 2016: D+7.2 2012: D+6.0 2008: D+5.1
Not yet ingested
- Civics
- —
Market trends
- HPI YoY
- ▼ -57.54%
- Current HPI
- 179.7702
- Rent YoY
- ▼ -3.12%
- Metro
- Birmingham-Hoover, AL
- State GDP YoY
- ▲ 2.94%
- F500 in state
- 4
Industry mix (Fortune 500 HQ in AL)
| Industry | F500 HQs | Revenue |
|---|---|---|
| Financial Services | 1 | $8B |
|
||
| Healthcare | 1 | $5B |
|
||
Price history
-8.3% since first listed7 events — show timeline
- 2026-05-14 Price Changed $110,000 Greater Alabama MLS
- 2026-04-14 Price Changed $125,000 Greater Alabama MLS
- 2026-03-20 Listed $135,000 Greater Alabama MLS
- 2021-11-19 Sold (Public Records) $120,000 Public Records
- 2021-11-18 Sold (MLS) $120,000 Greater Alabama MLS
- 2021-10-05 Sold (Public Records) $53,000 Public Records
- 2021-09-17 Listed $120,000 Greater Alabama MLS
Property tax history
+6.6%/yrLatest (2025): $1,613 · +0.0% YoY. Source: county tax records.
Cash-flow waterfall
monthlySold comps — $/sqft
last 12 mo · ≤1 miLoading sold comps…