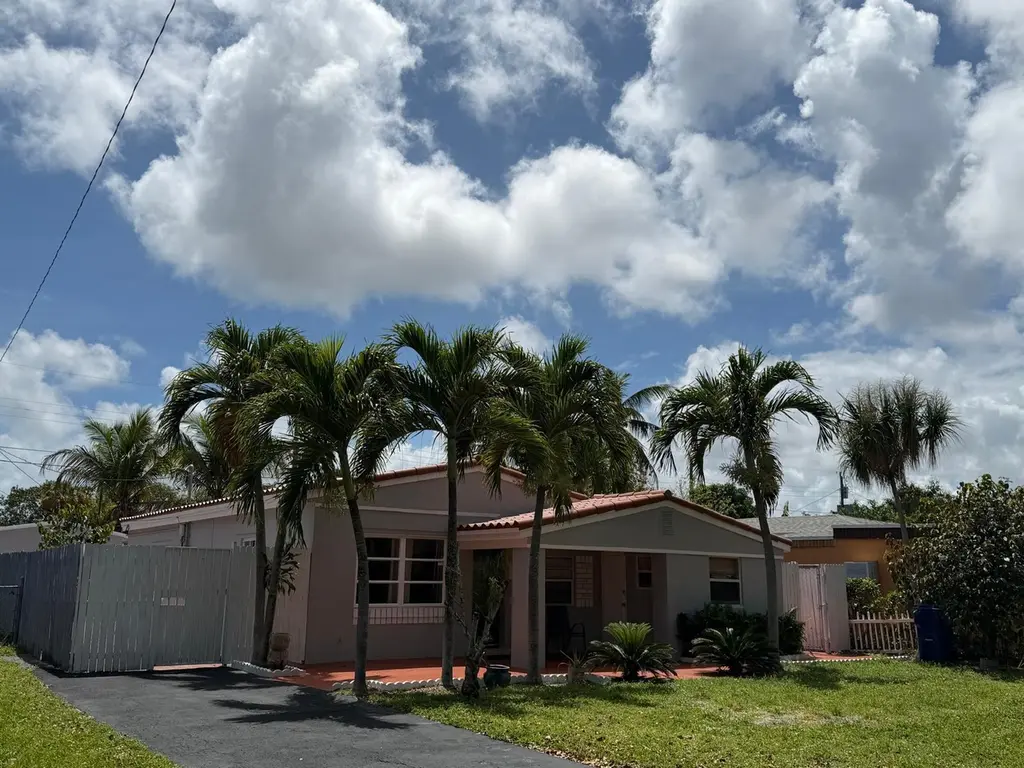
1674 NE 169th St · North Miami Beach, FL
Flood risk 4/10 · Minor
- FEMA flood zone
- X (unshaded)
- Chance of flooding over 30 yrs
- 0.22%
- Est. flood insurance / yr
- $507 – $1,088
Fire risk 1/10 · Minimal
- Est. fire insurance / yr
- $947 – $1,759
Heat risk 10/10 · Severe
- Hot days now (above 104°F)
- 7 days/yr
- Hot days in 30 yrs
- 28 days/yr
Wind risk 10/10 · Severe
- Chance of severe wind over 30 yrs
- 99.0%
Air-quality risk 2/10 · Minimal
- Unhealthy air days now
- 1 days/yr
- Unhealthy air days in 30 yrs
- 2 days/yr
Risk factors via First Street. Map © Google.
Why this score? — see what drove the F grade
The composite is a weighted blend of 9 inputs, each scored 0–100. Each bar is that input's sub-score; the figure is the points it added to the 100-point composite (weight × sub-score).
- Cash flow +14.6/30.0
- DSCR +4.5/10.0
- Schools +4.2/10.0
- Livability +4.1/5.0
- 1% rule +2.8/10.0
- Condition / age +2.5/5.0
- Rent growth +2.1/5.0
- ARV discount +0.0/15.0
- Appreciation +0.0/10.0
$550,000
🖨 Deal sheet (PDF) 📄 Offer letter ✓ Due diligence
Listing remarks
Investors Welcome to this charming North Miami Beach property! Step inside to a bright and comfortable space. The home offers 5 Bedrooms /3 bathrooms. Also you'll find a spacious backyard with a tropical tree of Peach and Achacha- Achachairu. Outside is perfect for weekend barbecues & gardening. Conveniently located near great schools, shopping, dining, and major highways, this home offers the perfect balance of comfort and convenience in a great neighborhood & NO association.
Key facts
- Tropical tree
- Spacious backyard
- Shopping
Tags
Property features AI
Finance
- Financial info: No land lease; Pets allowed with no restrictions; Number of units: 1
Exterior
- Parking: Six open parking spaces on asphalt (total parking for 6)
- Security: Smoke detectors; Security patrol
- Utilities: Public water; Public sewer; Electricity connected (circuit breakers); Cable available; Sewer connected; Water connected
- Home design: Single-family residence; One story; Entry at level 1; North-facing
- Construction: Concrete/CBS construction; Tile roof; Block foundation; Built as a resale property
- Exterior features: Open patio; Patio; Storage structure; Wood and other fencing; Fruit trees on the lot; City street frontage; Asphalt road surface (publicly maintained)
Interior
- Kitchen: Dishwasher; Electric range; Microwave; Refrigerator; Disposal
- Bedrooms: One main-level bedroom
- Flooring: Tile
- Bathrooms: Three full bathrooms (one on the main level)
- Heating & cooling: Central heating (electric); Exhaust fan; Ceiling fans for cooling; Has heating and cooling
- Interior features: Kitchen island; Blinds
- Laundry & utility: Main-level laundry room; Laundry room noted as 'Other / See Remarks'; Electric water heater
Neighborhood map
What this means for you Summary
Snapshot
- This is a 3-bed/1.0-bath single-family listed at $550k.
Deal economics
- At list price, monthly cash flow is $133 ($2k/yr) — positive.
- The deal already cash-flows at list — no discount required.
- To meet the 1% rule (rent ≥ 1% of price), the offer needs to be $427k (22.4% below list).
- Recommended offer: $427k (22.4% below list) — sets the bar for 1% rule.
- Cap rate 6.6% vs local median 5.2% in North Miami Beach — meaningfully above typical; check what's discounted (condition, days-on-market, listing class) to confirm the premium yield is real.
Location & tenants
- Location reads 82/100 on livability (#71 in FL, #1,177 nationally) — a professional / high-income tenant draw. Strengths: commute A+, housing A+, health & safety A+; Watch: employment D+, crime F.
- Miami-Dade (suburban): math 45% / reading 54% proficiency, ranked #40 of 73 in FL (top 55%) — families likely to look elsewhere, expect single-tenant / working-renter base with shorter leases; 64% free/reduced lunch — lower-income household profile, screen leases tightly.
- Zoned schools: Fulford Elementary School (math 40% / reading 35%, grade F, #1,596 of 2,144 statewide, top 75%, 461 students, 64% FRL); John F. Kennedy Middle School (math 47% / reading 55%, grade C, #237 of 571 statewide, top 43%, 1,074 students, 67% FRL); North Miami Beach Senior High (math 13% / reading 24%, grade F, #568 of 667 statewide, top 85%, 1,149 students, 66% FRL) — zoned schools at 66% FRL track the district average.
- Zoned-school proficiency averages 36% at this address vs 50% district-wide (-14 pts) — the specific schools serving this property underperform the Miami-Dade average; the district grade overstates school quality for this exact location.
- Market conditions: Rents soft (-1.6%/yr); 287 active listings in the ZIP; 10,051 units permitted in Miami-Dade County in 2024 (7,758 in 5+ unit buildings).
- At $4,269/mo this rent would consume 84% of the median local household income ($61k/yr) (locally 2509% of renters already pay >50% of income on rent) — very limited rent-growth headroom before tenants either downsize or default.
Forward outlook
- Local home prices are declining (-3.0%/yr); year-one equity from $4k of loan paydown is wiped out by about $16k of value loss. Plan a longer hold.
- Miami-Dade County population projected at +28% by 2050 — long-run rental-demand tailwind backs the buy-and-hold thesis.
Negotiation context
- It's been on market 29 days — a 2% lower offer ($542k) is reasonable based on typical stale-listing flexibility.
- Current owner paid $73k; list at $550k implies a 653% gain — meaningful room to come down on a strong offer.
Risks & watch-outs
- Watch-outs: built in 1956 — expect roof / HVAC / electrical / plumbing capex.
- Climate carrying-cost: severe wind risk, 99% chance of damaging wind over 30y; extreme-heat days projected 7→28/yr by 2055 (HVAC capex compounding) — expect insurance premiums to compound above CPI over the hold.
Questions for the listing agent
- Built in 1956 — when were the roof, HVAC, electrical panel, plumbing, and water heater last replaced?
- Is there a deadline driving the sale (1031 exchange, divorce, estate, relocation)? That informs how much negotiation room exists.
- Crime grade is F in this area — have there been break-ins, vandalism, or insurance claims at this property in the last 3 years? What carrier currently insures it and at what premium?
- The area grade is low — what's the realistic commute time and amenity access for the typical tenant pool here? Any planned neighborhood developments (good or bad) we should know about?
- What's the average days-on-market for RENTAL listings here right now (not sales)? A rising rental-DOM trend means longer vacancies and softer asking-rent achievability than the comps imply.
- What's the recent tenant-quality profile in this submarket — average credit score on applications, eviction rate, late-payment / NSF rate, and stable-employment percentage? A property-management company in the area should have these aggregated.
- How much new for-sale + rental construction is in the pipeline within 1–3 miles? Heavy new supply typically softens prices + rents 12–24 months out; constrained supply supports both.
Investment metrics
- 1% rule
- 0.78% ✗
- Cap rate
- 6.58%
- Cash-on-cash
- 1.04%
- DSCR
- 1.05
- GRM
- 10.7
CMA / ARV
- ARV (on-the-fly)
- $427,900
- Comps found
- 7
Show comp detail 7 sales within ~0.75 mi
| Address | Dist | Beds/Ba | Sqft | Sold | Price | $/sf | Match |
|---|---|---|---|---|---|---|---|
| 1523 NE 170th St | 0.18mi | 2/2.0 (-1) | 1,056 (-4%) | 15mo | $489,000 | $463 | 64 |
| 1415 NE 175th St | 0.52mi | 3/1.0 | 1,081 (-2%) | 13mo | $490,000 | $453 | 62 |
| 1487 NE 179th St | 0.71mi | 3/1.0 | 1,184 (+8%) | 2mo | $460,000 | $389 | 52 |
| 1487 NE 176th St | 0.53mi | 2/1.0 (-1) | 1,136 (+3%) | 19mo | $433,000 | $381 | 49 |
| 1571 NE 179th St | 0.68mi | 2/1.0 (-1) | 1,169 (+6%) | 11mo | $325,000 | $278 | 44 |
| 2174 NE 174th St | 0.71mi | 3/2.0 | 1,056 (-4%) | 22mo | $630,000 | $597 | 38 |
| 1985 NE 177th St | 0.67mi | 3/2.0 | 1,244 (+13%) | 6mo | $462,500 | $372 | 38 |
Match score weights: distance 35% · size 25% · config 20% · recency 20%. Top-matched comps best support the ARV.
Projected returns pro-forma
-3.0% appreciation · 0.0% rent growth · sell at horizon
- IRR
- -17.6%
- Equity multiple
- 0.39×
- Total profit
- $-93,423
- Equity at exit
- $82,007
- IRR
- -15.7%
- Equity multiple
- 0.22×
- Total profit
- $-119,904
- Equity at exit
- $47,554
Cash invested: $154,000 (down + closing). Projections, not guarantees.
Landlord ↔ Tenant lean methodology
- Overall (STATE)
- 87 Strongly Landlord-Friendly
- State Florida
- 87 Strongly Landlord-Friendly · R+3
- County
- — inherits STATE
- City
- — inherits STATE
ZIP-level market 33162
- Rents YoY
- -1.6%
- Active inventory
- 287
- Price-to-rent
- 10.7×
Monthly cashflow live
- Estimated rent
- $4,269 medium interval (Pro) →
- Mortgage (P&I)
- −$2,884
- Tax from tax record
- −$125 /mo · $1,506/yr
- Insurance
- −$229
- HOA
- −$0
- Vacancy / Maint / Mgmt
- −$896
- Net cashflow
- $133
Break-even live
Sensitivity live
| Price | -10% $445 | -5% $289 | +0% $133 | +5% $-22 | +10% $-178 |
|---|---|---|---|---|---|
| Rent | -10% $-204 | -5% $-35 | +0% $133 | +5% $302 | +10% $471 |
| Rate | -1.0pp $410 | -0.5pp $273 | base $133 | +0.5pp $-9 | +1.0pp $-154 |
UW: 25.0% down · 7.5% · 30yr · 1.5% tax · 5.0% vac · 8.0% maint · 8.0% mgmt
Financing live
Cash to close
- Down payment
- $137,500
- Closing costs
- $16,500
- Reserves months
- —
- Total cash needed
- —
Loan-product check · same deal, 3 products live
Conventional
25% down · 7.5% · 30yr
- Down + closing
- —
- Monthly P&I
- —
- Monthly cashflow
- —
- DSCR
- —
- Eligible?
- —
Personal DTI + credit; lowest rate.
DSCR
20% down · 8.5% · 30yr
- Down + closing
- —
- Monthly P&I
- —
- Monthly cashflow
- —
- DSCR
- —
- Eligible?
- —
No personal income docs; deal must DSCR.
Hard money
10% down · 12.0% · 12mo
- Down + closing
- —
- Monthly P&I
- —
- Monthly cashflow
- —
- DSCR
- —
- Eligible?
- —
Short-term bridge; refi at stabilization.
Listing history 6 events
-
2026-05-15status Pending
-
2026-04-16$550,000 Active
-
1998-03-03soldstatus $73,000
-
1992-10-26soldstatus $67,500
-
1984-08-01soldstatus $50,000
-
1980-09-01soldstatus $49,000
ⓘ Source: listings_history table (triggers on properties + properties_extension) + one-shot
backfill from property_details.listing_events for pre-trigger history.
Tax reassessment forecast FL · Resets to sale price
- Current annual tax
- $1,506 · $125/mo
- Projected year-2 tax
- $4,565 · $380/mo
- Expected delta
- +$3,059/yr (+$255/mo · 203.2%)
ⓘ Screening estimate from a state-policy table — verify with the county assessor before closing.
Climate risk First Street
- Flood 4/10 Moderate FEMA zone X (unshaded) · 22% chance over 30 yrs
- Wildfire 1/10 Low
- Heat 10/10 Extreme 7 d/yr ≥104°F today · 28 d/yr by 30 yrs out
- Wind 10/10 Extreme 99% chance of damaging wind over 30 yrs
- Air quality 2/10 Low 1 unhealthy d/yr today · 2 by 30 yrs out
Nearby sold comps map
Loading sold comps map…
Walkable amenities ~0.75 mi
Loading nearby amenities…
Taxation est. · year 1
- Rental income
- $51,223
- − Mortgage interest
- −$30,809
- − Property taxes
- −$1,506
- − Insurance
- −$2,750
- − Repairs & maintenance
- −$4,098
- − Management
- −$4,098
- − Depreciation
- −$16,000
- Taxable loss
- −$8,036
- Est. tax savings @ 24.0%
- +$1,929
- After-tax cash flow
- $3,529/yr
For passive investors: Depreciation is non-cash, so a rental often shows a tax loss while cash-flowing — sheltering income. Rental losses are passive: they offset passive income freely, and up to $25,000/yr can offset ordinary (W-2) income if you actively participate and your MAGI is under $100k (phasing out to $0 by $150k); unused losses carry forward. On sale, claimed depreciation is recaptured at up to 25%, and gains may owe capital-gains tax (a 1031 exchange can defer both). Figures are a year-1 estimate at your 24.0% rate — not tax advice; consult a CPA.
Schools (NCES district)
- District
- Miami-Dade
- NCES district ID
- 1200390
- Math proficiency
- 45% ▼ -16.00%
- Reading proficiency
- 54% ▼ -5.00%
- Median HH income
- $43,928
- Composite
- 41.76/100
- National rank
- #3397
- State rank
- #40 of 73 in FL
Livability — North Miami Beach
- Score
- 82/100
- State rank
- #71
- US rank
- #1177
Category grades
Schools grade is shown separately in the Schools card above.
Census & demographics
- Census place
- North Miami Beach, FL
- County
- Miami-Dade County · 2,697,751 people
- City population
- 90,324
- Metro
- Miami-Fort Lauderdale-Pompano Beach, FL
- Population (ZIP)
- 46,606
- Household income
- $60,692
- Rent vs Own
- Severe rent burden
- 2509.0
Population outlook (Miami-Dade County) Hauer SSP2
- Today (2025)
- 3,126,439 people
- By 2030
- 3,325,765 · +6.4%
- By 2040
- 3,697,561 · +18.3%
- By 2050
- 4,012,134 · +28.3%
- By 2075
- 4,605,612 · +47.3%
- By 2100
- 4,866,598 · +55.7%
Race, ethnicity, and origin ACS 2023
- Neighborhood character
- Diverse neighborhood (Simpson 0.62)
- Race & ethnicity
- Black 53% Hispanic / Latino 30% Two or more races 15% White 12% Asian 2%
- Hispanic origin (detail)
- Puerto Rican 4% Cuban 7% Dominican 3%
- Common ancestry
- Hispanic 31% Romanian 1% Scotch-Irish 1%
- Foreign-born
- 52% · Canada, Jamaica, Dominican Republic
- Languages at home
- 29% English-only · French/Haitian/Cajun 35% Spanish 30% Other Indo-European 2%
Political lean MEDSL · Miami-Dade
- 2024 margin
- R (+11.4) · D 43.9% · R 55.4%
- 2008→2024 swing
- -27.6pp toward R · 2008: 16.1pp · 2024: -11.4pp
- All cycles
- 2024: R+11.4 2020: D+7.3 2016: D+29.6 2012: D+23.7 2008: D+16.1
Not yet ingested
- Civics
- —
Market trends
- HPI YoY
- ▼ -445.57%
- Current HPI
- 596.6178
- Rent YoY
- ▼ -1.59%
- Metro
- Miami-Fort Lauderdale-Pompano Beach, FL
- State GDP YoY
- ▲ 3.28%
- F500 in state
- 36
Industry mix (Fortune 500 HQ in FL)
| Industry | F500 HQs | Revenue |
|---|---|---|
| Industrial Technology | 2 | $29B |
|
||
| Insurance | 2 | $17B |
|
||
| Retail | 1 | $60B |
|
||
| Technology Distribution | 1 | $58B |
|
||
| Homebuilding | 1 | $35B |
|
||
| Technology Manufacturing | 1 | $35B |
|
||
Price history
+1022.4% since first listed6 events — show timeline
- 2026-05-15 Pending — Beaches MLS
- 2026-04-16 Listed $550,000 Beaches MLS
- 1998-03-03 Sold (Public Records) $73,000 Public Records
- 1992-10-26 Sold (Public Records) $67,500 Public Records
- 1984-08-01 Sold (Public Records) $50,000 Public Records
- 1980-09-01 Sold (Public Records) $49,000 Public Records
Property tax history
+4.0%/yrLatest (2025): $1,506 · +49.9% YoY. Source: county tax records.
Cash-flow waterfall
monthlySold comps — $/sqft
last 12 mo · ≤1 miLoading sold comps…