 16-Plex
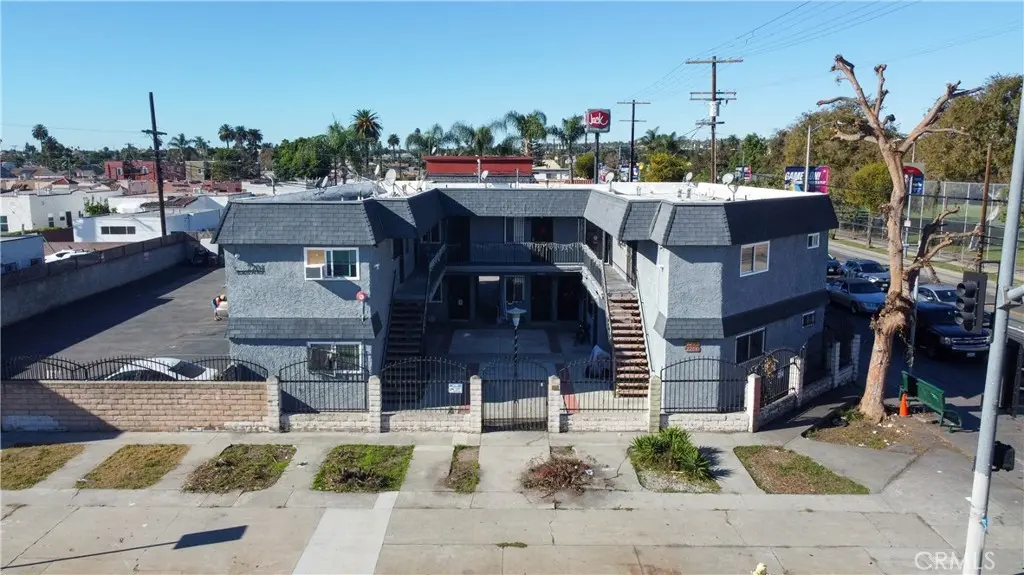
2204 W Slauson · Los Angeles, CA
Flood risk 3/10 · Minor
- FEMA flood zone
- X (shaded)
- Chance of flooding over 30 yrs
- 0.1%
- Est. flood insurance / yr
- $507 – $1,088
Fire risk 1/10 · Minimal
- Est. fire insurance / yr
- $659 – $1,223
Heat risk 5/10 · Moderate
- Hot days now (above 87°F)
- 7 days/yr
- Hot days in 30 yrs
- 19 days/yr
Wind risk 1/10 · Minimal
- Chance of severe wind over 30 yrs
- —
Air-quality risk 5/10 · Moderate
- Unhealthy air days now
- 7 days/yr
- Unhealthy air days in 30 yrs
- 7 days/yr
Risk factors via First Street. Map © Google.
Why this score? — see what drove the C+ grade
The composite is a weighted blend of 9 inputs, each scored 0–100. Each bar is that input's sub-score; the figure is the points it added to the 100-point composite (weight × sub-score).
- Cash flow +26.8/30.0
- DSCR +9.2/10.0
- ARV discount +7.5/15.0
- 1% rule +6.5/10.0
- Rent growth +3.8/5.0
- Schools +3.6/10.0
- Livability +3.4/5.0
- Condition / age +2.5/5.0
- Appreciation +0.0/10.0
$3,650,000
🖨 Deal sheet 📄 Offer letter ✓ Due diligence
Multi-family units
County records classify this as Multi-Family (5+ Unit). Listing-text estimate: 16 units. confirmed
5+ unit building — per-unit beds/baths from public records are typically unavailable; the breakdown below (if shown) is an estimate from the listing text.
Listing remarks MLS
Offered at an attractive basis of approximately $228,125 per unit, 2204 Slauson Avenue presents a compelling 16-unit multifamily investment opportunity in South Los Angeles. The property features a well-balanced unit mix of (6) Studio units and (10) One-Bedroom/One-Bathroom units, providing broad tenant appeal and consistent demand. Current in-place income delivers a strong 6.90% CAP rate and 9.65 GRM, offering immediate cash flow with room for future growth. The asset also presents meaningful upside potential, with projected market performance reaching a 7.63% CAP rate and 8.82 market GRM through rental optimization. This combination of stable existing income and value-add opportunity positions the property well for both long-term hold and yield-focused investors. Located in the Van Ness neighborhood of South Los Angeles, west of South Central and northeast of Inglewood, the property benefits from a central infill location with proximity to major employment centers, transportation corridors, and continued investment activity throughout the surrounding submarkets. 2204 Slauson Avenue offers investors a rare opportunity to acquire scale, cash flow, and upside at a compelling cost basis in a supply-constrained rental market.
Key facts
- Immediate cash flow
- Strong cap rate
- 0.26 acre lot
Tags
Neighborhood map
What this means for you Summary
Snapshot
- This is a 10×10bd/16.0ba + 6×1bd/1.0ba units multifamily listed at $3.65M.
Deal economics
- At list price, monthly cash flow is $10k ($120k/yr) — positive. Per door: $625/mo.
- The deal already cash-flows at list — no discount required.
- Meets the 1% rule at list price ($42k rent vs $3.65M).
- Recommended offer: $3.21M (12.0% below list) — sets the bar for market timing.
- Cap rate 9.6% vs local median 2.1% in Los Angeles — top-decile yield for the area; either an underpriced asset or a hidden risk that comps aren't pricing in. Stress-test before assuming the spread holds.
Location & tenants
- Location reads 68/100 on livability (#273 in CA) — a middle-class / working-renter tenant base. Strengths: amenities A+, commute A+, employment B; Watch: health & safety C-, schools D+, crime F.
- Los Angeles Unified (urban): math 29% / reading 54% proficiency, ranked #223 of 517 in CA (top 43%) — families likely to look elsewhere, expect single-tenant / working-renter base with shorter leases; 67% free/reduced lunch — lower-income household profile, screen leases tightly.
- Market conditions: Rents rising fast (+5.0%/yr); 142 active listings in the ZIP; 19,697 units permitted in Los Angeles County in 2024 (9,426 in 5+ unit buildings).
- At $41,944/mo this rent would consume 777% of the median local household income ($65k/yr) (locally 3295% of renters already pay >50% of income on rent) — very limited rent-growth headroom before tenants either downsize or default.
Forward outlook
- Local home prices are declining (-3.0%/yr); year-one equity from $25k of loan paydown is wiped out by about $110k of value loss. Plan a longer hold.
- Los Angeles County population projected at +9% by 2050 — modest demand growth; plan on rents tracking national, not racing it.
- At projected returns (-3.0% appreciation + 5.0% rent growth), your $1.02M cash investment doubles in ~9 years — after that, you're playing with house money.
Negotiation context
- It's been on market 161 days — a 12% lower offer ($3.21M) is reasonable based on typical stale-listing flexibility.
- 3 sale attempts since 26y ago; this cycle's ask has dropped $600k (14%) from the opening price — seller is motivated, your offer sets the floor, not the list.
- Current owner paid $2.17M; list at $3.65M implies a 68% gain — meaningful room to come down on a strong offer.
Risks & watch-outs
- Climate carrying-cost: extreme-heat days projected 7→19/yr by 2055 (HVAC capex compounding) — expect insurance premiums to compound above CPI over the hold.
Questions for the listing agent
- It's been on market 161 days. Have you received any prior offers? Is the seller open to a 12% concession, seller financing, or rate buy-down credit?
- Can we see the unit-by-unit rent roll, current vacancy, and any below-market leases? What's the average tenancy length?
- What capital expenditures (roof, boiler, parking lot, exteriors) have been made in the last 5 years, and what's planned in the next 2?
- Why hasn't it sold? Are there any deal-killer items the seller is aware of (foundation, flood, title, zoning, code violations)?
- Is there a deadline driving the sale (1031 exchange, divorce, estate, relocation)? That informs how much negotiation room exists.
- Schools are D-rated, which usually means shorter tenancies and higher turnover. Who's the typical renter profile here, and what's been the actual vacancy rate?
- Crime grade is F in this area — have there been break-ins, vandalism, or insurance claims at this property in the last 3 years? What carrier currently insures it and at what premium?
- What's the average days-on-market for RENTAL listings here right now (not sales)? A rising rental-DOM trend means longer vacancies and softer asking-rent achievability than the comps imply.
- What's the recent tenant-quality profile in this submarket — average credit score on applications, eviction rate, late-payment / NSF rate, and stable-employment percentage? A property-management company in the area should have these aggregated.
- How much new apartment / multifamily construction is in the pipeline within 1–3 miles? Heavy new supply (>2% of stock underway) typically softens rents 12–24 months out; light construction supports rent growth.
Investment metrics
- 1% rule
- 1.15% ✓
- Cap rate
- 9.58%
- Cash-on-cash
- 11.75%
- DSCR
- 1.52
- GRM
- 7.3
CMA / ARV
- ARV (median comp)
- $1,257,297
- List price
- $3,650,000
- Delta
- 190.31%
- Verdict
- OVERPRICED
- Comps
- 7 within 1.0 mi
Show comp detail 1 sale within ~0.75 mi
| Address | Dist | Beds/Ba | Sqft | Sold | Price | $/sf | Match |
|---|---|---|---|---|---|---|---|
| 2900 W 54th St | 0.50mi | 8/10.0 (-1) | 6,755 (+12%) | 18mo | $1,500,000 | $222 | 34 |
Match score weights: distance 35% · size 25% · config 20% · recency 20%. Top-matched comps best support the ARV.
Projected returns pro-forma
-3.0% appreciation · 5.01% rent growth · sell at horizon
- IRR
- 3.3%
- Equity multiple
- 1.13×
- Total profit
- $131,744
- Equity at exit
- $544,227
- IRR
- 14.5%
- Equity multiple
- 2.27×
- Total profit
- $1,302,683
- Equity at exit
- $315,585
Cash invested: $1,022,000 (down + closing). Projections, not guarantees.
Landlord ↔ Tenant lean methodology
- Overall (CITY)
- 0 Strongly Tenant-Friendly
- State California
- 18 Strongly Tenant-Friendly · D+13
- County
- — inherits STATE
- City Los Angeles
- 0 Strongly Tenant-Friendly · D+22
ZIP-level market 90043
- Rents YoY
- 5.0%
- Active inventory
- 142
- Price-to-rent
- 98.6×
Monthly cashflow live
- Estimated rent
- $41,944 medium interval (Pro) →
- Mortgage (P&I)
- −$19,141
- Tax from tax record
- −$2,467 /mo · $29,607/yr
- Insurance
- −$1,521
- HOA
- −$0
- Vacancy / Maint / Mgmt
- −$8,808
- Net cashflow
- $10,007
Break-even live
16-unit breakdown (identical units grouped — click to expand)
| Units | Beds | Baths | Est. rent |
|---|---|---|---|
| 10× units | 10 | 16 | $30,860 |
| #1 | 10 | 16 | $3,086 |
| #2 | 10 | 16 | $3,086 |
| #3 | 10 | 16 | $3,086 |
| #4 | 10 | 16 | $3,086 |
| #5 | 10 | 16 | $3,086 |
| #6 | 10 | 16 | $3,086 |
| #7 | 10 | 16 | $3,086 |
| #8 | 10 | 16 | $3,086 |
| #9 | 10 | 16 | $3,086 |
| #10 | 10 | 16 | $3,086 |
| 6× units | 1 | 1 | $11,082 |
| #11 | 1 | 1 | $1,847 |
| #12 | 1 | 1 | $1,847 |
| #13 | 1 | 1 | $1,847 |
| #14 | 1 | 1 | $1,847 |
| #15 | 1 | 1 | $1,847 |
| #16 | 1 | 1 | $1,847 |
| Total (16 units) | $41,944 | ||
UW: 25.0% down · 7.5% · 30yr · 1.5% tax · 5.0% vac · 8.0% maint · 8.0% mgmt
Financing live
Cash to close
- Down payment
- $912,500
- Closing costs
- $109,500
- Reserves months
- —
- Total cash needed
- —
Loan-product check · same deal, 3 products live
Conventional
25% down · 7.5% · 30yr
- Down + closing
- —
- Monthly P&I
- —
- Monthly cashflow
- —
- DSCR
- —
- Eligible?
- —
Personal DTI + credit; lowest rate.
DSCR
20% down · 8.5% · 30yr
- Down + closing
- —
- Monthly P&I
- —
- Monthly cashflow
- —
- DSCR
- —
- Eligible?
- —
No personal income docs; deal must DSCR.
Hard money
10% down · 12.0% · 12mo
- Down + closing
- —
- Monthly P&I
- —
- Monthly cashflow
- —
- DSCR
- —
- Eligible?
- —
Short-term bridge; refi at stabilization.
Listing history 24 events
-
2026-06-18days on market $3,650,000 Active 161 DOM
-
2026-06-17days on market $3,650,000 Active 160 DOM
-
2026-06-16days on market $3,650,000 Active 159 DOM
-
2026-06-15days on market $3,650,000 Active 158 DOM
-
2026-06-13days on market $3,650,000 Active 156 DOM
-
2026-06-09days on market $3,650,000 Active 152 DOM
-
2026-06-08days on market $3,650,000 Active 151 DOM
-
2026-06-07days on market $3,650,000 Active 150 DOM
-
2026-06-04days on market $3,650,000 Active 147 DOM
-
2026-06-03days on market $3,650,000 Active 146 DOM
-
2026-06-02days on market $3,650,000 Active 145 DOM
-
2026-06-01days on market $3,650,000 Active 144 DOM
-
2026-05-31days on market $3,650,000 Active 143 DOM
-
2026-04-14price $3,650,000 1242-char remark
Show marketing remark (1242 chars)
Offered at an attractive basis of approximately $228,125 per unit, 2204 Slauson Avenue presents a compelling 16-unit multifamily investment opportunity in South Los Angeles. The property features a well-balanced unit mix of (6) Studio units and (10) One-Bedroom/One-Bathroom units, providing broad tenant appeal and consistent demand. Current in-place income delivers a strong 6.90% CAP rate and 9.65 GRM, offering immediate cash flow with room for future growth. The asset also presents meaningful upside potential, with projected market performance reaching a 7.63% CAP rate and 8.82 market GRM through rental optimization. This combination of stable existing income and value-add opportunity positions the property well for both long-term hold and yield-focused investors. Located in the Van Ness neighborhood of South Los Angeles, west of South Central and northeast of Inglewood, the property benefits from a central infill location with proximity to major employment centers, transportation corridors, and continued investment activity throughout the surrounding submarkets. 2204 Slauson Avenue offers investors a rare opportunity to acquire scale, cash flow, and upside at a compelling cost basis in a supply-constrained rental market.
-
2026-03-03price $3,999,000 1242-char remark
Show marketing remark (1242 chars)
Offered at an attractive basis of approximately $228,125 per unit, 2204 Slauson Avenue presents a compelling 16-unit multifamily investment opportunity in South Los Angeles. The property features a well-balanced unit mix of (6) Studio units and (10) One-Bedroom/One-Bathroom units, providing broad tenant appeal and consistent demand. Current in-place income delivers a strong 6.90% CAP rate and 9.65 GRM, offering immediate cash flow with room for future growth. The asset also presents meaningful upside potential, with projected market performance reaching a 7.63% CAP rate and 8.82 market GRM through rental optimization. This combination of stable existing income and value-add opportunity positions the property well for both long-term hold and yield-focused investors. Located in the Van Ness neighborhood of South Los Angeles, west of South Central and northeast of Inglewood, the property benefits from a central infill location with proximity to major employment centers, transportation corridors, and continued investment activity throughout the surrounding submarkets. 2204 Slauson Avenue offers investors a rare opportunity to acquire scale, cash flow, and upside at a compelling cost basis in a supply-constrained rental market.
-
2026-01-08$4,250,000 Active 1242-char remark
Show marketing remark (1242 chars)
Offered at an attractive basis of approximately $228,125 per unit, 2204 Slauson Avenue presents a compelling 16-unit multifamily investment opportunity in South Los Angeles. The property features a well-balanced unit mix of (6) Studio units and (10) One-Bedroom/One-Bathroom units, providing broad tenant appeal and consistent demand. Current in-place income delivers a strong 6.90% CAP rate and 9.65 GRM, offering immediate cash flow with room for future growth. The asset also presents meaningful upside potential, with projected market performance reaching a 7.63% CAP rate and 8.82 market GRM through rental optimization. This combination of stable existing income and value-add opportunity positions the property well for both long-term hold and yield-focused investors. Located in the Van Ness neighborhood of South Los Angeles, west of South Central and northeast of Inglewood, the property benefits from a central infill location with proximity to major employment centers, transportation corridors, and continued investment activity throughout the surrounding submarkets. 2204 Slauson Avenue offers investors a rare opportunity to acquire scale, cash flow, and upside at a compelling cost basis in a supply-constrained rental market.
-
2021-04-16soldstatus $2,170,000 Sold 962-char remark
Show marketing remark (962 chars)
Slauson Manor Apartments is a vacant 9-unit building adjacent to the Crenshaw Boulevard commercial corridor. Slauson Manor Apartments is not subject to LA City rent control and provides an opportunity to either lease-up and enjoy immediate cash-flow or make cosmetic upgrades to unit interiors to achieve higher rents. Cap rates are approximately 100 basis points higher in the greater Inglewood submarket than Los Angeles as a whole, offering a potential stabilized yield of over 10%. The submarkets rent levels are below the metro-wide average and is consequently one of the few areas that have experienced rent growth since the start of the pandemic, with a YoY increase of 1.7% from 2019 to 2020. As the economy returns to pre-pandemic levels and rents continue to rise, the buildings non rent-controlled status will allow the operator to increase rents at a rate that keeps pace with the market. Built in 1981, the 6,050 square-foot courtyard-style building
-
2021-04-12status Pending 962-char remark
Show marketing remark (962 chars)
Slauson Manor Apartments is a vacant 9-unit building adjacent to the Crenshaw Boulevard commercial corridor. Slauson Manor Apartments is not subject to LA City rent control and provides an opportunity to either lease-up and enjoy immediate cash-flow or make cosmetic upgrades to unit interiors to achieve higher rents. Cap rates are approximately 100 basis points higher in the greater Inglewood submarket than Los Angeles as a whole, offering a potential stabilized yield of over 10%. The submarkets rent levels are below the metro-wide average and is consequently one of the few areas that have experienced rent growth since the start of the pandemic, with a YoY increase of 1.7% from 2019 to 2020. As the economy returns to pre-pandemic levels and rents continue to rise, the buildings non rent-controlled status will allow the operator to increase rents at a rate that keeps pace with the market. Built in 1981, the 6,050 square-foot courtyard-style building
-
2021-03-05price $2,195,000 962-char remark
Show marketing remark (962 chars)
Slauson Manor Apartments is a vacant 9-unit building adjacent to the Crenshaw Boulevard commercial corridor. Slauson Manor Apartments is not subject to LA City rent control and provides an opportunity to either lease-up and enjoy immediate cash-flow or make cosmetic upgrades to unit interiors to achieve higher rents. Cap rates are approximately 100 basis points higher in the greater Inglewood submarket than Los Angeles as a whole, offering a potential stabilized yield of over 10%. The submarkets rent levels are below the metro-wide average and is consequently one of the few areas that have experienced rent growth since the start of the pandemic, with a YoY increase of 1.7% from 2019 to 2020. As the economy returns to pre-pandemic levels and rents continue to rise, the buildings non rent-controlled status will allow the operator to increase rents at a rate that keeps pace with the market. Built in 1981, the 6,050 square-foot courtyard-style building
-
2021-01-27$2,295,000 Active 962-char remark
Show marketing remark (962 chars)
Slauson Manor Apartments is a vacant 9-unit building adjacent to the Crenshaw Boulevard commercial corridor. Slauson Manor Apartments is not subject to LA City rent control and provides an opportunity to either lease-up and enjoy immediate cash-flow or make cosmetic upgrades to unit interiors to achieve higher rents. Cap rates are approximately 100 basis points higher in the greater Inglewood submarket than Los Angeles as a whole, offering a potential stabilized yield of over 10%. The submarkets rent levels are below the metro-wide average and is consequently one of the few areas that have experienced rent growth since the start of the pandemic, with a YoY increase of 1.7% from 2019 to 2020. As the economy returns to pre-pandemic levels and rents continue to rise, the buildings non rent-controlled status will allow the operator to increase rents at a rate that keeps pace with the market. Built in 1981, the 6,050 square-foot courtyard-style building
-
2019-09-11soldstatus $1,600,000
-
2001-03-16soldstatus $375,000
-
2000-10-15historical
-
2000-04-15
ⓘ Source: listings_history table (triggers on properties + properties_extension) + one-shot
backfill from property_details.listing_events for pre-trigger history.
Tax reassessment forecast CA · Resets to sale price
- Current annual tax
- $29,607 · $2,467/mo
- Projected year-2 tax
- $29,607 · $2,467/mo
- Expected delta
- $0/yr ($0/mo · -0.0%)
ⓘ Screening estimate from a state-policy table — verify with the county assessor before closing.
Climate risk First Street
- Flood 3/10 Moderate FEMA zone X (shaded) · 10% chance over 30 yrs
- Wildfire 1/10 Low
- Heat 5/10 Major 7 d/yr ≥87°F today · 19 d/yr by 30 yrs out
- Wind 1/10 Low
- Air quality 5/10 Major 7 unhealthy d/yr today · 7 by 30 yrs out
Nearby sold comps map
Loading sold comps map…
Walkable amenities ~0.75 mi
Loading nearby amenities…
Taxation est. · year 1
- Rental income
- $503,328
- − Mortgage interest
- −$204,457
- − Property taxes
- −$29,607
- − Insurance
- −$18,250
- − Repairs & maintenance
- −$40,266
- − Management
- −$40,266
- − Depreciation
- −$106,182
- Taxable income
- $64,300
- Est. tax owed @ 24.0%
- −$15,432
- After-tax cash flow
- $104,648/yr
For passive investors: Depreciation is non-cash, so a rental often shows a tax loss while cash-flowing — sheltering income. Rental losses are passive: they offset passive income freely, and up to $25,000/yr can offset ordinary (W-2) income if you actively participate and your MAGI is under $100k (phasing out to $0 by $150k); unused losses carry forward. On sale, claimed depreciation is recaptured at up to 25%, and gains may owe capital-gains tax (a 1031 exchange can defer both). Figures are a year-1 estimate at your 24.0% rate — not tax advice; consult a CPA.
Schools (NCES district)
- District
- Los Angeles Unified
- NCES district ID
- 0622710
- Math proficiency
- 29% ▼ -4.00%
- Reading proficiency
- 54% ▲ 10.00%
- Median HH income
- $50,403
- Composite
- 35.67/100
- National rank
- #4875
- State rank
- #223 of 517 in CA
Livability — Los Angeles
- Score
- 68/100
- State rank
- #273
- US rank
- #9237
Category grades
Schools grade is shown separately in the Schools card above.
Census & demographics
- Census place
- Los Angeles, CA
- County
- Los Angeles County · 9,444,647 people
- City population
- 3,838,149
- Metro
- Los Angeles-Long Beach-Anaheim, CA
- Population (ZIP)
- 42,377
- Household income
- $64,792
- Rent vs Own
- Severe rent burden
- 3295.0
Population outlook (Los Angeles County) Hauer SSP2
- Today (2025)
- 10,940,515 people
- By 2030
- 11,256,481 · +2.9%
- By 2040
- 11,729,929 · +7.2%
- By 2050
- 11,948,407 · +9.2%
- By 2075
- 11,818,114 · +8.0%
- By 2100
- 10,842,928 · -0.9%
Race, ethnicity, and origin ACS 2023
- Neighborhood character
- Diverse neighborhood (Simpson 0.58)
- Race & ethnicity
- Black 58% Hispanic / Latino 26% Two or more races 16% White 6% Asian 2%
- Hispanic origin (detail)
- Mexican 14%
- Common ancestry
- British 2% Lithuanian 1% Italian 1%
- Foreign-born
- 18% · Canada, South Korea, Jamaica
- Languages at home
- 70% English-only · Spanish 25% French/Haitian/Cajun 1%
Political lean MEDSL · Los Angeles
- 2024 margin
- Solid D (+32.9) · D 64.8% · R 31.9% · Other 3.3%
- 2008→2024 swing
- -7.4pp toward R · 2008: 40.4pp · 2024: 32.9pp
- All cycles
- 2024: D+32.9 2020: D+44.2 2016: D+48.0 2012: D+40.0 2008: D+40.4
Not yet ingested
- Civics
- —
Market trends
- HPI YoY
- ▼ -1382.39%
- Current HPI
- 434.3031
- Rent YoY
- ▲ 5.01%
- Metro
- Los Angeles-Long Beach-Anaheim, CA
- State GDP YoY
- ▲ 3.21%
- F500 in state
- 116
Industry mix (Fortune 500 HQ in CA)
| Industry | F500 HQs | Revenue |
|---|---|---|
| Technology | 27 | $1,492B |
|
||
| Financial Services | 3 | $174B |
|
||
| Retail | 3 | $44B |
|
||
| Insurance | 3 | $26B |
|
||
| Media / Entertainment | 2 | $115B |
|
||
| Pharmaceuticals / Biotech | 2 | $62B |
|
||
Price history
+873.3% since first listed11 events — show timeline
- 2026-04-14 Price Changed $3,650,000 CRMLS
- 2026-03-03 Price Changed $3,999,000 CRMLS
- 2026-01-08 Listed $4,250,000 CRMLS
- 2021-04-16 Sold (MLS) $2,170,000 TheMLS
- 2021-04-12 Pending — TheMLS
- 2021-03-05 Price Changed $2,195,000 TheMLS
- 2021-01-27 Listed $2,295,000 TheMLS
- 2019-09-11 Sold (Public Records) $1,600,000 Public Records
- 2001-03-16 Sold (Public Records) $375,000 Public Records
- 2000-10-15 Delisted — TheMLS
- 2000-04-15 Listed — TheMLS
Property tax history
+9.5%/yrLatest (2025): $29,607 · +1.3% YoY. Source: county tax records.
Cash-flow waterfall
monthlySold comps — $/sqft
last 12 mo · ≤1 miLoading sold comps…