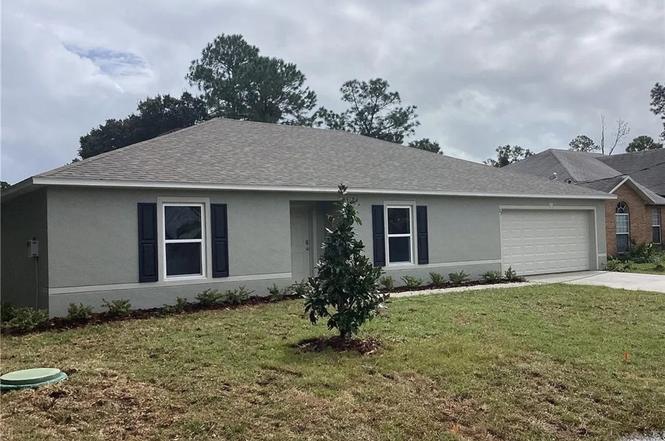
 🏗️ New Construction
27 Pillar Ln · Palm Coast, FL
Flood risk 4/10 · Minor
- FEMA flood zone
- X (unshaded)
- Chance of flooding over 30 yrs
- 0.2%
- Est. flood insurance / yr
- $507 – $1,088
Fire risk 4/10 · Minor
- Est. fire insurance / yr
- $947 – $1,759
Heat risk 9/10 · Severe
- Hot days now (above 106°F)
- 7 days/yr
- Hot days in 30 yrs
- 22 days/yr
Wind risk 10/10 · Severe
- Chance of severe wind over 30 yrs
- 99.0%
Air-quality risk 2/10 · Minimal
- Unhealthy air days now
- 2 days/yr
- Unhealthy air days in 30 yrs
- 2 days/yr
Risk factors via First Street. Map © Google.
Why this score? — see what drove the F grade
The composite is a weighted blend of 9 inputs, each scored 0–100. Each bar is that input's sub-score; the figure is the points it added to the 100-point composite (weight × sub-score).
- ARV discount +7.5/15.0
- Cash flow +6.2/30.0
- Schools +4.6/10.0
- Livability +3.5/5.0
- Rent growth +2.8/5.0
- Condition / age +2.5/5.0
- 1% rule +1.4/10.0
- DSCR +0.5/10.0
- Appreciation +0.0/10.0
$5,000
🖨 Deal sheet 📄 Offer letter ✓ Due diligence
Listing remarks MLS
OWNER FINANCING AVAILABLE ON THIS COMPLETED NEW BUILD! 10% Down/6% Interest. Enjoy this 4-Bed/2-Bath split floor plan with a 2-car Garage in beautiful Palm Coast. Enter the home to the welcoming entryway to your private Den/Office and the 4th Bedroom also can be used as a media room it's that big. Down the hall, you are welcomed to the large living room/kitchen/Dining combo great for entertaining friends and family. The kitchen comes fully equipped with all new appliances such as a Range, Microwave, Dishwasher, and Refrigerator. Watch your favorite movie in the spacious living room with a sliding glass door that leads out to the back patio and large yard for entertaining during those cool spring nights. The 3 spacious bedrooms are separated from the owner's suite area and share a large bath with tub/shower combo. Relax in the spacious owner's suite and ensuite bathroom with a large walk-in shower, a walk-in closet, and a vanity sink. Washer/Dryer hookup in the laundry room that leads to the 2-car garage. This home is located near public schools, community centers, shopping, and more that Palm Coast offers. Home is also available for RENT or LEASE-TO-OWN! WITH OPTIONS LIKE THESE, THIS HOME WILL GO QUICK! CALL TODAY, MOVE TOMORROW!
Key facts
- 0.23 acre lot
- 2 garage spots
- Built 2023
Property features AI
Finance
- Financial info: Annual tax amount reported (see listing for details)
Exterior
- Parking: Garage (2 spaces)
- Utilities: Water: Other; Sewer: Other
- Home design: Single-family residence; One level; Residential property
- Construction: Construction materials: see remarks
- Exterior features: Front porch; Other roof
Interior
- Bedrooms: Total of 1 room (see listing for room layout and bedroom breakdown)
- Flooring: Other
- Bathrooms: 2 full bathrooms
- Heating & cooling: No heating specified; No cooling system specified
- Interior features: Other flooring
Neighborhood map
What this means for you Summary
Snapshot
- This is a 4-bed/2.0-bath single-family listed at $5k.
Deal economics
- At list price, monthly cash flow is $-628 ($-8k/yr) — negative.
- The deal already cash-flows at list — no discount required.
- Meets the 1% rule at list price ($2k rent vs $5k).
Location & tenants
- Location reads 69/100 on livability (#478 in FL) — a middle-class / working-renter tenant base. Strengths: housing A+, health & safety A+, cost of living B+; Watch: amenities F, commute F.
- Flagler (rural): math 53% / reading 56% proficiency, ranked #20 of 73 in FL (top 27%) — acceptable for families but not a draw, mixed tenant base, ~2y average lease.
- Market conditions: Rents rising (+1.2%/yr); 1367 active listings in the ZIP; 27 comparable units currently listed for rent nearby; rentals at typical pace (median 14d on market — plan ~3-4 weeks tenant-placement turnaround); solid renter incomes; 2,588 units permitted in Flagler County in 2024 (0 in 5+ unit buildings).
- This rent runs 35% of the median local income ($76k/yr) — at the standard rent-burdened threshold; future hikes will face affordability resistance.
Forward outlook
- Local home prices are declining (-3.0%/yr); year-one equity from $2k of loan paydown is wiped out by about $10k of value loss. Plan a longer hold.
- Flagler County population projected at +28% by 2050 — long-run rental-demand tailwind backs the buy-and-hold thesis.
Negotiation context
- Only 7 days on market — expect competitive offers; lowballing is unlikely to land.
- 5 sale attempts since 4y ago with the ask held roughly flat each time — persistent listings suggest the price (not the market) is what's stuck; bring a comps-based counter.
Risks & watch-outs
- Watch-outs: property tax is 103.7% of price.
- Climate carrying-cost: severe wind risk, 99% chance of damaging wind over 30y; extreme-heat days projected 7→22/yr by 2055 (HVAC capex compounding) — expect insurance premiums to compound above CPI over the hold.
Questions for the listing agent
- What do current leases actually rent for vs. the listed asking? Can we see a recent rent roll and the last 12 months of T-12 income?
- Property tax is high relative to price — has the assessment been appealed recently, and will the sale trigger a re-assessment?
- Is there a deadline driving the sale (1031 exchange, divorce, estate, relocation)? That informs how much negotiation room exists.
- The area grade is low — what's the realistic commute time and amenity access for the typical tenant pool here? Any planned neighborhood developments (good or bad) we should know about?
- What's the average days-on-market for RENTAL listings here right now (not sales)? A rising rental-DOM trend means longer vacancies and softer asking-rent achievability than the comps imply.
- What's the recent tenant-quality profile in this submarket — average credit score on applications, eviction rate, late-payment / NSF rate, and stable-employment percentage? A property-management company in the area should have these aggregated.
- How much new for-sale + rental construction is in the pipeline within 1–3 miles? Heavy new supply typically softens prices + rents 12–24 months out; constrained supply supports both.
Investment metrics
- 1% rule
- 0.64% ✗
- Cap rate
- 4.11%
- Cash-on-cash
- -7.79%
- DSCR
- 0.65
- GRM
- 12.9
CMA / ARV
- ARV (on-the-fly)
- $345,708
- Comps found
- 12
Show comp detail 12 sales within ~0.75 mi
| Address | Dist | Beds/Ba | Sqft | Sold | Price | $/sf | Match |
|---|---|---|---|---|---|---|---|
| 47 Pilgrim Dr | 0.13mi | 4/2.0 | 2,164 (+1%) | 0mo | $285,000 | $132 | 91 |
| 24 Pierce Ln | 0.27mi | 4/2.0 | 2,134 (0%) | 1mo | $320,000 | $150 | 87 |
| 142 Pine Grove Dr | 0.22mi | 4/3.0 | 2,117 (-1%) | 1mo | $363,900 | $172 | 83 |
| 15 Piermount Ln | 0.32mi | 4/2.0 | 2,254 (+6%) | 2mo | $343,000 | $152 | 74 |
| 28 Pillory Ln | 0.03mi | 5/2.0 (+1) | 2,391 (+12%) | 0mo | $329,900 | $138 | 73 |
| 66 Postwood Dr | 0.72mi | 4/2.0 | 2,134 (0%) | 1mo | $344,990 | $162 | 66 |
| 22 Pine Crest Ln | 0.68mi | 4/2.0 | 2,134 (0%) | 4mo | $339,990 | $159 | 65 |
| 124 Park Place Cir | 0.55mi | 4/2.0 | 2,003 (-6%) | 0mo | $380,000 | $190 | 64 |
| 24 Pickston Ln | 0.33mi | 4/2.0 | 1,862 (-13%) | 2mo | $315,000 | $169 | 62 |
| 60 Pickering Dr | 0.41mi | 5/2.5 (+1) | 1,995 (-6%) | 2mo | $330,000 | $165 | 61 |
| 37 Pinell Ln | 0.43mi | 4/2.0 | 1,821 (-15%) | 3mo | $314,995 | $173 | 53 |
| 34 Pinwheel Ln | 0.54mi | 4/2.0 | 1,863 (-13%) | 3mo | $300,000 | $161 | 51 |
Match score weights: distance 35% · size 25% · config 20% · recency 20%. Top-matched comps best support the ARV.
Projected returns pro-forma
-3.0% appreciation · 1.18% rent growth · sell at horizon
- IRR
- -31.9%
- Equity multiple
- -0.03×
- Total profit
- $-100,002
- Equity at exit
- $51,546
- IRR
- -48.2%
- Equity multiple
- -0.59×
- Total profit
- $-154,320
- Equity at exit
- $29,891
Cash invested: $96,798 (down + closing). Projections, not guarantees.
Landlord ↔ Tenant lean methodology
- Overall (STATE)
- 87 Strongly Landlord-Friendly
- State Florida
- 87 Strongly Landlord-Friendly · R+3
- County
- — inherits STATE
- City
- — inherits STATE
ZIP-level market 32164
- Home prices YoY
- -6.3%
- Rents YoY
- 1.2%
- Active inventory
- 1367
- Price-to-rent
- 0.2×
Monthly cashflow live
- Estimated rent
- $2,229 high interval (Pro) →
- Mortgage (P&I)
- −$1,813
- Tax est. 1.5%
- −$432 /mo · $5,186/yr
- Insurance
- −$144
- HOA
- −$0
- Vacancy / Maint / Mgmt
- −$468
- Net cashflow
- $-628
Break-even live
UW: 25.0% down · 7.5% · 30yr · 1.5% tax · 5.0% vac · 8.0% maint · 8.0% mgmt
Financing live
Cash to close
- Down payment
- $86,427
- Closing costs
- $10,371
- Reserves months
- —
- Total cash needed
- —
Loan-product check · same deal, 3 products live
Conventional
25% down · 7.5% · 30yr
- Down + closing
- —
- Monthly P&I
- —
- Monthly cashflow
- —
- DSCR
- —
- Eligible?
- —
Personal DTI + credit; lowest rate.
DSCR
20% down · 8.5% · 30yr
- Down + closing
- —
- Monthly P&I
- —
- Monthly cashflow
- —
- DSCR
- —
- Eligible?
- —
No personal income docs; deal must DSCR.
Hard money
10% down · 12.0% · 12mo
- Down + closing
- —
- Monthly P&I
- —
- Monthly cashflow
- —
- DSCR
- —
- Eligible?
- —
Short-term bridge; refi at stabilization.
Rent comps 27 comps
| Address | Beds | Baths | Sqft | Rent | $/sqft | DOM | Units | Dist |
|---|---|---|---|---|---|---|---|---|
| 176 Pine Grove Dr Palm Coast, FL | 3.0 | 2.0 | 1989 | $2,200 | $1.11 | 23d | 1 | 0.10mi |
| 57 Pilgrim Dr Palm Coast, FL | 3.0 | 2.0 | 1680 | $2,049 | $1.22 | 2d | 1 | 0.12mi |
| 13 Pilgrim Dr Palm Coast, FL | 4.0 | 2.0 | 1617 | $2,060 | $1.27 | 21d | 1 | 0.20mi |
| 56 Pine Brook Dr Palm Coast, FL | 3.0 | 2.0 | 1500 | $1,895 | $1.26 | 14d | 1 | 0.23mi |
| 192 Pine Grove Dr Palm Coast, FL | 3.0 | 2.0 | 1928 | $2,300 | $1.19 | 21d | 1 | 0.27mi |
| 6 Pickcane Ln Palm Coast, FL | 4.0 | 2.0 | 1500 | $2,400 | $1.60 | 2d | 1 | 0.41mi |
| 37 Pine Croft Ln Palm Coast, FL | 3.0 | 2.0 | 1832 | $2,100 | $1.15 | 2d | 1 | 0.49mi |
| 33 Pinwheel Ln Palm Coast, FL | 3.0 | 2.0 | 1500 | $2,400 | $1.60 | 23d | 1 | 0.52mi |
| 4 Pin Oak Dr Palm Coast, FL | 4.0 | 2.0 | 2236 | $2,200 | $0.98 | 23d | 1 | 0.59mi |
| 3 Port Ln Palm Coast, FL | 3.0 | 2.0 | 1442 | $1,750 | $1.21 | 2d | 1 | 0.59mi |
| 44 Pinetree Dr Palm Coast, FL | 3.0 | 2.0 | 2357 | $2,000 | $0.85 | 23d | 1 | 0.68mi |
| 35 Postman Ln Palm Coast, FL | 3.0 | 2.0 | 1900 | $1,950 | $1.03 | 23d | 1 | 0.79mi |
| 10 Pontiac Ln Unit B Palm Coast, FL | 4.0 | 2.0 | 1524 | $1,825 | $1.20 | 2d | 1 | 0.87mi |
| 22 Pony Ln Unit B Palm Coast, FL | 3.0 | 2.0 | 2168 | $1,850 | $0.85 | 14d | 1 | 0.88mi |
| 15 Postman Ln Palm Coast, FL | 4.0 | 2.0 | 1728 | $1,975 | $1.14 | 2d | 1 | 0.92mi |
| 38 Pinelynn Dr Palm Coast, FL | 4.0 | 2.0 | 1617 | $1,985 | $1.23 | 23d | 1 | 0.92mi |
| 26 Pitt Ln Palm Coast, FL | 3.0 | 2.0 | 1502 | $1,995 | $1.33 | 14d | 1 | 0.97mi |
| 38 Pine Hill Ln Palm Coast, FL | 3.0 | 2.0 | 1400 | $1,750 | $1.25 | 14d | 1 | 1.01mi |
| 14 Pitt Ln Palm Coast, FL | 3.0 | 2.0 | 1481 | $1,750 | $1.18 | 23d | 1 | 1.03mi |
| 16 Porpoise Ln Palm Coast, FL | 4.0 | 3.0 | 2427 | $2,650 | $1.09 | 2d | 1 | 1.11mi |
| 8 Oriole Rd Palm Coast, FL | 3.0 | 2.0 | 1401 | $2,400 | $1.71 | 14d | 1 | 1.17mi |
| 65 Raintree Pl Palm Coast, FL | 4.0 | 2.0 | 1706 | $1,600 | $0.94 | 23d | 1 | 1.23mi |
| 5 Pine Haven Dr Palm Coast, FL | 3.0 | 2.0 | 1635 | $1,850 | $1.13 | 14d | 1 | 1.26mi |
| 21 Prospect Ln Unit B Palm Coast, FL | 3.0 | 2.0 | 1500 | $1,690 | $1.13 | 23d | 1 | 1.39mi |
| 18 Preston Ln Palm Coast, FL | 3.0 | 2.0 | 1832 | $2,200 | $1.20 | 2d | 1 | 1.40mi |
| 131 Rae Dr Palm Coast, FL | 4.0 | 2.0 | 1738 | $2,150 | $1.24 | 2d | 1 | 1.40mi |
| 124 Plainview Dr Unit B Palm Coast, FL | 3.0 | 2.0 | 1600 | $1,650 | $1.03 | 2d | 1 | 1.44mi |
Listing history 7 events
-
2026-06-18days on market $5,000 Active 7 DOM
-
2026-06-17days on market $5,000 Active 6 DOM
-
2026-06-16days on market $5,000 Active 5 DOM
-
2026-06-15days on market $5,000 Active 4 DOM
-
2026-06-14days on market $5,000 Active 2 DOM
-
2026-06-13remarks 298-char remark
-
2026-06-13$5,000 Active 1 DOM
ⓘ Source: listings_history table (triggers on properties + properties_extension) + one-shot
backfill from property_details.listing_events for pre-trigger history.
Climate risk First Street
- Flood 4/10 Moderate FEMA zone X (unshaded) · 20% chance over 30 yrs
- Wildfire 4/10 Moderate
- Heat 9/10 Extreme 7 d/yr ≥106°F today · 22 d/yr by 30 yrs out
- Wind 10/10 Extreme 99% chance of damaging wind over 30 yrs
- Air quality 2/10 Low 2 unhealthy d/yr today · 2 by 30 yrs out
Nearby sold comps map
Loading sold comps map…
Walkable amenities ~0.75 mi
Loading nearby amenities…
Taxation est. · year 1
- Rental income
- $26,749
- − Mortgage interest
- −$19,365
- − Property taxes
- −$5,186
- − Insurance
- −$1,729
- − Repairs & maintenance
- −$2,140
- − Management
- −$2,140
- − Depreciation
- −$10,057
- Taxable loss
- −$13,867
- Est. tax savings @ 24.0%
- +$3,328
- After-tax cash flow
- $-4,210/yr
For passive investors: Depreciation is non-cash, so a rental often shows a tax loss while cash-flowing — sheltering income. Rental losses are passive: they offset passive income freely, and up to $25,000/yr can offset ordinary (W-2) income if you actively participate and your MAGI is under $100k (phasing out to $0 by $150k); unused losses carry forward. On sale, claimed depreciation is recaptured at up to 25%, and gains may owe capital-gains tax (a 1031 exchange can defer both). Figures are a year-1 estimate at your 24.0% rate — not tax advice; consult a CPA.
Schools (NCES district)
- District
- Flagler
- NCES district ID
- 1200540
- Math proficiency
- 53% ▼ -9.00%
- Reading proficiency
- 56% ▼ -4.00%
- Median HH income
- $48,354
- Composite
- 46.35/100
- National rank
- #2464
- State rank
- #20 of 73 in FL
Livability — Palm Coast
- Score
- 69/100
- State rank
- #478
- US rank
- #8721
Category grades
Schools grade is shown separately in the Schools card above.
Census & demographics
- Census place
- Palm Coast, FL
- County
- Flagler County · 113,412 people
- City population
- 105,049
- Metro
- Deltona-Daytona Beach-Ormond Beach, FL
- Population (ZIP)
- 56,658
- Household income
- $76,399
- Rent vs Own
- Severe rent burden
- 1291.0
Population outlook (Flagler County) Hauer SSP2
- Today (2025)
- 123,474 people
- By 2030
- 131,864 · +6.8%
- By 2040
- 146,176 · +18.4%
- By 2050
- 157,398 · +27.5%
- By 2075
- 177,990 · +44.2%
- By 2100
- 183,381 · +48.5%
Race, ethnicity, and origin ACS 2023
- Neighborhood character
- Predominantly White (65%)
- Race & ethnicity
- White 65% Hispanic / Latino 14% Black 13% Two or more races 8% Asian 2%
- Hispanic origin (detail)
- Mexican 4% Puerto Rican 4% Cuban 2%
- Common ancestry
- Romanian 3% Russian 2% Slovak 2%
- Foreign-born
- 16% · Canada, Jamaica
- Languages at home
- 81% English-only · Spanish 9% Russian/Polish/Slavic 3% Other Indo-European 3%
Political lean MEDSL · Flagler
- 2024 margin
- Strong R (+28.2) · D 35.6% · R 63.8%
- 2008→2024 swing
- -29.8pp toward R · 2008: 1.6pp · 2024: -28.2pp
- All cycles
- 2024: R+28.2 2020: R+20.8 2016: R+20.6 2012: R+7.4 2008: D+1.6
Not yet ingested
- Civics
- —
Market trends
- HPI YoY
- ▼ -19.89%
- Current HPI
- 297.4942
- Rent YoY
- ▲ 1.18%
- Metro
- Deltona-Daytona Beach-Ormond Beach, FL
- State GDP YoY
- ▲ 3.28%
- F500 in state
- 36
Industry mix (Fortune 500 HQ in FL)
| Industry | F500 HQs | Revenue |
|---|---|---|
| Industrial Technology | 2 | $29B |
|
||
| Insurance | 2 | $17B |
|
||
| Retail | 1 | $60B |
|
||
| Technology Distribution | 1 | $58B |
|
||
| Homebuilding | 1 | $35B |
|
||
| Technology Manufacturing | 1 | $35B |
|
||
Price history
-91.4% since first listed15 events — show timeline
- 2026-06-11 Listed $5,000 HAOR as distributed by MLS GRID
- 2025-08-30 Rental Removed $2,199 Hemlane
- 2025-08-19 Price Changed $2,199 Hemlane
- 2025-08-10 Price Changed $2,499 Hemlane
- 2025-07-09 Listed for Rent $2,800 Hemlane
- 2023-11-20 Sold (Public Records) $385,000 Public Records
- 2023-11-14 Sold (MLS) $385,000 Stellar MLS as Distributed by MLS Grid
- 2023-10-26 Rental Removed $2,400 STELLARMLS
- 2023-10-25 Pending — Stellar MLS as Distributed by MLS Grid
- 2023-10-20 Listed $385,000 Stellar MLS as Distributed by MLS Grid
- 2023-10-04 Listed for Rent $2,400 STELLARMLS
- 2023-10-04 Sold (Public Records) $330,000 Public Records
- 2023-08-25 Listing Removed — realMLS
- 2022-10-04 Sold (Public Records) $45,000 Public Records
- 2022-08-25 Listed $58,000 realMLS
Property tax history
+38.9%/yrLatest (2025): $5,343 · -0.3% YoY. Source: county tax records.
Cash-flow waterfall
monthlySold comps — $/sqft
last 12 mo · ≤1 miLoading sold comps…