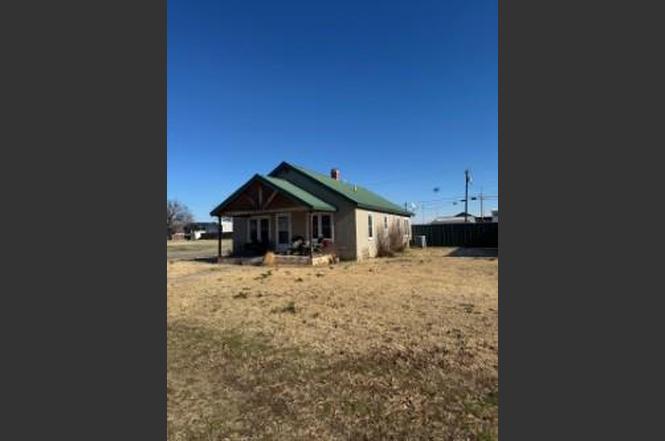
520 N Locust St · Seiling, OK
Flood risk 1/10 · Minimal
- FEMA flood zone
- —
- Chance of flooding over 30 yrs
- 0.0%
- Est. flood insurance / yr
- —
Fire risk 7/10 · Major
- Est. fire insurance / yr
- $2,463 – $4,575
Heat risk 5/10 · Moderate
- Hot days now (above 106°F)
- 7 days/yr
- Hot days in 30 yrs
- 19 days/yr
Wind risk 2/10 · Minimal
- Chance of severe wind over 30 yrs
- 2.0%
Air-quality risk 1/10 · Minimal
- Unhealthy air days now
- 0 days/yr
- Unhealthy air days in 30 yrs
- 0 days/yr
Risk factors via First Street. Map © Google.
Why this score? — see what drove the D grade
The composite is a weighted blend of 9 inputs, each scored 0–100. Each bar is that input's sub-score; the figure is the points it added to the 100-point composite (weight × sub-score).
- Cash flow +10.9/30.0
- Appreciation +8.0/10.0
- ARV discount +7.5/15.0
- DSCR +3.2/10.0
- Livability +3.2/5.0
- Rent growth +2.5/5.0
- Condition / age +2.5/5.0
- 1% rule +2.2/10.0
- Schools +1.8/10.0
$125,000
🖨 Deal sheet (PDF) 📄 Offer letter ✓ Due diligence
Listing remarks
Very nice, clean, and modern single family home. Brand new privacy fence summer of '25. Corner lot one block from the football field and a short walk to the school. Two bed 1 bath and a very spacious backyard ready to be moved in.
Key facts
- Spacious backyard
- Privacy fence
- Corner lot
Tags
Property features AI
Finance
- Other: Occupied; No home warranty; Corner lot directions: East off of maintreet in Seiling, OK on W 6th St to Locust
- Financial info: Assumability unknown; Loan qualification unknown
- HOA & community: No mandatory association dues
Exterior
- Parking: 1-car garage
- Utilities: Living area value from assessor
- Home design: Single family residence; One story; Residential property; Existing property; Located in 1st Add
- Construction: Metal roof; Other construction materials; Conventional foundation; Built previously (existing)
- Exterior features: Corner lot; Outdoors storm shelter; No additional exterior features listed
Interior
- Bedrooms: 2 bedrooms
- Bathrooms: 1 full bathroom
- Heating & cooling: Central electric heating
- Interior features: One living area; No fireplace
Neighborhood map
What this means for you Summary
Snapshot
- This is a 2-bed/1.0-bath single-family listed at $125k.
Deal economics
- At list price, monthly cash flow is $-55 ($-659/yr) — negative.
- To cash-flow at today's rent, offer at most $115k (7.8% below list).
- To meet the 1% rule (rent ≥ 1% of price), the offer needs to be $91k (27.5% below list).
- Recommended offer: $91k (27.5% below list) — sets the bar for 1% rule.
Location & tenants
- Location reads 65/100 on livability (#149 in OK) — a middle-class / working-renter tenant base. Strengths: crime A+, cost of living A+, housing A+; Watch: employment D, amenities F, commute F.
- Seiling (rural): math 16% / reading 24% proficiency, ranked #165 of 270 in OK (top 61%) — low school quality limits family demand, transient renter base, plan for 1-2y turnover.
- Zoned schools: Seiling Es (math 22% / reading 27%, grade F, #354 of 845 statewide, top 47%, 271 students, 0% FRL); Seiling Jr-Sr Hs (Jr) (math 8% / reading 22%, grade F, #226 of 345 statewide, top 67%, 86 students, 0% FRL); Seiling Jr-Sr Hs (Sr) (math 10% / reading 10%, grade F, #361 of 447 statewide, top 94%, 82 students, 0% FRL) — zoned schools average 0% FRL vs 42% district-wide (42 pts lower); this property's tenant base skews higher-income than the district average.
- Market conditions: 7 active listings in the ZIP.
Forward outlook
- In year one you build about $8k of equity ($864 loan paydown + $8k appreciation (6.0% local appreciation)).
- Dewey County population projected at +28% by 2050 — long-run rental-demand tailwind backs the buy-and-hold thesis.
- At projected returns (6.0% appreciation + 3.0% rent growth), your $35k cash investment doubles in ~4 years — after that, you're playing with house money.
- By year 5, paydown + projected appreciation supports a ~$37k cash-out refi (75% LTV) — recoverable capital for the next deal without selling this one.
Negotiation context
- It's been on market 193 days — a 12% lower offer ($110k) is reasonable based on typical stale-listing flexibility.
- Current owner paid $86k; 45% above their basis — modest negotiation headroom, anchor on the comps not their cost.
Risks & watch-outs
- Watch-outs: built in 1940 — expect roof / HVAC / electrical / plumbing capex.
- Climate carrying-cost: major wildfire risk; extreme-heat days projected 7→19/yr by 2055 (HVAC capex compounding) — expect insurance premiums to compound above CPI over the hold.
Questions for the listing agent
- What do current leases actually rent for vs. the listed asking? Can we see a recent rent roll and the last 12 months of T-12 income?
- It's been on market 193 days. Have you received any prior offers? Is the seller open to a 28% concession, seller financing, or rate buy-down credit?
- Built in 1940 — when were the roof, HVAC, electrical panel, plumbing, and water heater last replaced?
- Why hasn't it sold? Are there any deal-killer items the seller is aware of (foundation, flood, title, zoning, code violations)?
- Is there a deadline driving the sale (1031 exchange, divorce, estate, relocation)? That informs how much negotiation room exists.
- Schools are D-rated, which usually means shorter tenancies and higher turnover. Who's the typical renter profile here, and what's been the actual vacancy rate?
- The area grade is low — what's the realistic commute time and amenity access for the typical tenant pool here? Any planned neighborhood developments (good or bad) we should know about?
- What's the average days-on-market for RENTAL listings here right now (not sales)? A rising rental-DOM trend means longer vacancies and softer asking-rent achievability than the comps imply.
- What's the recent tenant-quality profile in this submarket — average credit score on applications, eviction rate, late-payment / NSF rate, and stable-employment percentage? A property-management company in the area should have these aggregated.
- How much new for-sale + rental construction is in the pipeline within 1–3 miles? Heavy new supply typically softens prices + rents 12–24 months out; constrained supply supports both.
Investment metrics
- 1% rule
- 0.72% ✗
- Cap rate
- 5.77%
- Cash-on-cash
- -1.88%
- DSCR
- 0.92
- GRM
- 11.5
CMA / ARV
No comps found within radius.
Projected returns pro-forma
6.01% appreciation · 3.0% rent growth · sell at horizon
- IRR
- 13.8%
- Equity multiple
- 1.93×
- Total profit
- $32,630
- Equity at exit
- $78,665
- IRR
- 14.2%
- Equity multiple
- 3.82×
- Total profit
- $98,606
- Equity at exit
- $142,729
Cash invested: $35,000 (down + closing). Projections, not guarantees.
Landlord ↔ Tenant lean methodology
- Overall (STATE)
- 83 Strongly Landlord-Friendly
- State Oklahoma
- 83 Strongly Landlord-Friendly · R+20
- County
- — inherits STATE
- City
- — inherits STATE
ZIP-level market 73663
- Home prices YoY
- 4.4%
- Active inventory
- 7
- Price-to-rent
- 11.5×
Monthly cashflow live
- Estimated rent
- $906 medium interval (Pro) →
- Mortgage (P&I)
- −$656
- Tax from tax record
- −$63 /mo · $757/yr
- Insurance
- −$52
- HOA
- −$0
- Vacancy / Maint / Mgmt
- −$190
- Net cashflow
- $-55
Break-even live
Sensitivity live
| Price | -10% $16 | -5% $-20 | +0% $-55 | +5% $-90 | +10% $-126 |
|---|---|---|---|---|---|
| Rent | -10% $-126 | -5% $-91 | +0% $-55 | +5% $-19 | +10% $17 |
| Rate | -1.0pp $8 | -0.5pp $-23 | base $-55 | +0.5pp $-87 | +1.0pp $-120 |
UW: 25.0% down · 7.5% · 30yr · 1.5% tax · 5.0% vac · 8.0% maint · 8.0% mgmt
Financing live
Cash to close
- Down payment
- $31,250
- Closing costs
- $3,750
- Reserves months
- —
- Total cash needed
- —
Loan-product check · same deal, 3 products live
Conventional
25% down · 7.5% · 30yr
- Down + closing
- —
- Monthly P&I
- —
- Monthly cashflow
- —
- DSCR
- —
- Eligible?
- —
Personal DTI + credit; lowest rate.
DSCR
20% down · 8.5% · 30yr
- Down + closing
- —
- Monthly P&I
- —
- Monthly cashflow
- —
- DSCR
- —
- Eligible?
- —
No personal income docs; deal must DSCR.
Hard money
10% down · 12.0% · 12mo
- Down + closing
- —
- Monthly P&I
- —
- Monthly cashflow
- —
- DSCR
- —
- Eligible?
- —
Short-term bridge; refi at stabilization.
Listing history 20 events
-
2026-06-21days on market $125,000 Active 193 DOM
-
2026-06-21days on market $125,000 Active 192 DOM
-
2026-06-18days on market $125,000 Active 190 DOM
-
2026-06-17days on market $125,000 Active 189 DOM
-
2026-06-16days on market $125,000 Active 188 DOM
-
2026-06-15days on market $125,000 Active 187 DOM
-
2026-06-13days on market $125,000 Active 185 DOM
-
2026-06-12days on market $125,000 Active 184 DOM
-
2026-06-09days on market $125,000 Active 181 DOM
-
2026-06-08days on market $125,000 Active 180 DOM
-
2026-06-08days on market $125,000 Active 179 DOM
-
2026-06-05days on market $125,000 Active 177 DOM
-
2026-06-04days on market $125,000 Active 175 DOM
-
2026-06-02days on market $125,000 Active 174 DOM
-
2026-06-01days on market $125,000 Active 173 DOM
-
2026-05-31days on market $125,000 Active 172 DOM
-
2025-12-02$125,000 Active
-
2024-01-08soldstatus $86,500
-
2021-05-03soldstatus $77,500
-
2002-09-18soldstatus $20,000
ⓘ Source: listings_history table (triggers on properties + properties_extension) + one-shot
backfill from property_details.listing_events for pre-trigger history.
Tax reassessment forecast OK · Resets to sale price
- Current annual tax
- $757 · $63/mo
- Projected year-2 tax
- $1,125 · $94/mo
- Expected delta
- +$368/yr (+$31/mo · 48.6%)
ⓘ Screening estimate from a state-policy table — verify with the county assessor before closing.
Climate risk First Street
- Flood 1/10 Low 0% chance over 30 yrs
- Wildfire 7/10 Severe
- Heat 5/10 Major 7 d/yr ≥106°F today · 19 d/yr by 30 yrs out
- Wind 2/10 Low 2% chance of damaging wind over 30 yrs
- Air quality 1/10 Low 0 unhealthy d/yr today · 0 by 30 yrs out
Nearby sold comps map
Loading sold comps map…
Walkable amenities ~0.75 mi
Loading nearby amenities…
Taxation est. · year 1
- Rental income
- $10,873
- − Mortgage interest
- −$7,002
- − Property taxes
- −$757
- − Insurance
- −$625
- − Repairs & maintenance
- −$870
- − Management
- −$870
- − Depreciation
- −$3,636
- Taxable loss
- −$2,887
- Est. tax savings @ 24.0%
- +$693
- After-tax cash flow
- $34/yr
For passive investors: Depreciation is non-cash, so a rental often shows a tax loss while cash-flowing — sheltering income. Rental losses are passive: they offset passive income freely, and up to $25,000/yr can offset ordinary (W-2) income if you actively participate and your MAGI is under $100k (phasing out to $0 by $150k); unused losses carry forward. On sale, claimed depreciation is recaptured at up to 25%, and gains may owe capital-gains tax (a 1031 exchange can defer both). Figures are a year-1 estimate at your 24.0% rate — not tax advice; consult a CPA.
Schools (NCES district)
- District
- Seiling
- NCES district ID
- 4027240
- Math proficiency
- 16% ▼ -19.00%
- Reading proficiency
- 24% ▼ -15.00%
- Median HH income
- $48,536
- Composite
- 17.74/100
- National rank
- #9019
- State rank
- #165 of 270 in OK
Livability — Seiling
- Score
- 65/100
- State rank
- #149
- US rank
- #13332
Category grades
Schools grade is shown separately in the Schools card above.
Census & demographics
- Census place
- Seiling, OK
- Population (ZIP)
- 1,162
Population outlook (Dewey County) Hauer SSP2
- Today (2025)
- 5,172 people
- By 2030
- 5,364 · +3.7%
- By 2040
- 5,938 · +14.8%
- By 2050
- 6,615 · +27.9%
- By 2075
- 9,114 · +76.2%
- By 2100
- 11,232 · +117.2%
Race, ethnicity, and origin ACS 2023
- Neighborhood character
- Predominantly White (78%)
- Race & ethnicity
- White 78% Two or more races 11% Native American 9% Hispanic / Latino 5%
- Common ancestry
- Italian 8% Slovak 3% Serbian 1%
- Foreign-born
- 0%
Political lean MEDSL · Dewey
- 2024 margin
- Solid R (+80.1) · D 9.4% · R 89.6%
- 2008→2024 swing
- -11.5pp toward R · 2008: -68.6pp · 2024: -80.1pp
- All cycles
- 2024: R+80.1 2020: R+81.0 2016: R+77.6 2012: R+70.9 2008: R+68.6
Not yet ingested
- Civics
- —
Market trends
- HPI YoY
- ▲ 6.01%
- Current HPI
- 143.4865
- Rent YoY
- —
- Metro
- —
- State GDP YoY
- ▲ 1.55%
- F500 in state
- 6
Industry mix (Fortune 500 HQ in OK)
| Industry | F500 HQs | Revenue |
|---|---|---|
| Energy | 3 | $48B |
|
||
Price history
+525.0% since first listed4 events — show timeline
- 2025-12-02 Listed $125,000 MLSOK
- 2024-01-08 Sold (Public Records) $86,500 Public Records
- 2021-05-03 Sold (Public Records) $77,500 Public Records
- 2002-09-18 Sold (Public Records) $20,000 Public Records
Property tax history
+10.3%/yrLatest (2025): $757 · +132.9% YoY. Source: county tax records.
Cash-flow waterfall
monthlySold comps — $/sqft
last 12 mo · ≤1 miLoading sold comps…