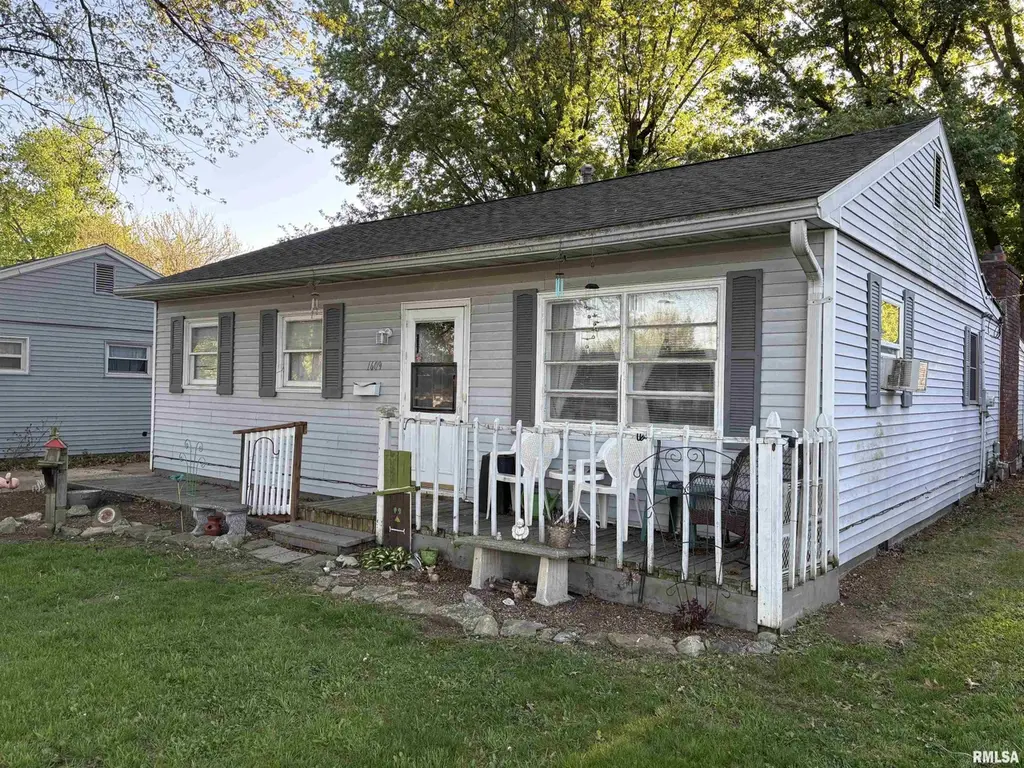
1609 Lakeview Terrace Dr · South Jacksonville, IL
Flood risk 1/10 · Minimal
- FEMA flood zone
- X (unshaded)
- Chance of flooding over 30 yrs
- 0.0%
- Est. flood insurance / yr
- $473 – $860
Fire risk 1/10 · Minimal
- Est. fire insurance / yr
- $804 – $1,492
Heat risk 4/10 · Minor
- Hot days now (above 106°F)
- 7 days/yr
- Hot days in 30 yrs
- 19 days/yr
Wind risk 2/10 · Minimal
- Chance of severe wind over 30 yrs
- 1.0%
Air-quality risk 2/10 · Minimal
- Unhealthy air days now
- 1 days/yr
- Unhealthy air days in 30 yrs
- 2 days/yr
Risk factors via First Street. Map © Google.
Why this score? — see what drove the B+ grade
The composite is a weighted blend of 9 inputs, each scored 0–100. Each bar is that input's sub-score; the figure is the points it added to the 100-point composite (weight × sub-score).
- Cash flow +30.0/30.0
- ARV discount +15.0/15.0
- 1% rule +10.0/10.0
- DSCR +10.0/10.0
- Livability +3.6/5.0
- Rent growth +2.5/5.0
- Condition / age +2.5/5.0
- Schools +1.9/10.0
- Appreciation +0.0/10.0
$70,000
🖨 Deal sheet (PDF) 📄 Offer letter ✓ Due diligence
Listing remarks
LOCAL INVESTOR STARTING TO SELL HIS RENTALS. UNIQUE OPPORTUNITY. THIS RANCH SITS IN A GOOD SOUTH LOCATION - A SHORT WALK TO NICHOLAS PARK AND FACTORS IN SOUTH JACKSONVILLE SCHOOL PRICED AT $78,500. IT IS SELLING "AS IS". NO QUESTION IT NEEDS A FACELIFT. BUT THE SQUARE FOOTAGE IS THERE TO SUPPORT EVERY PENNY YOU SPEND. 3 BEDS 2 BATHS - NO GARAGE - PRICED AT $78,500.. .. SELLER IS OFFERING A PACKAGE DEAL. 3 HOUSES FOR $185,000 - PACKAGE BEING OFFERED INCLUDES - 1609 LAKEVIEW TERRACE, 835 S, FAYETTE & 846 W. RAILROAD. ALL 3 ARE CURRENTLY RENTED. 48 NOTIFICATION TO VIEW THE HOMES. SELLER IS SELLING ALL "AS iS" ONCE ONE OF THE HOME SELLS INDIVIDUALLY THE BUY 3 FO
Key facts
- Good south location
- 6,050 sq ft lot
- Parking
Tags
Property features AI
Exterior
- Parking: Gravel parking; No garage
- Utilities: Public water; Public sewer
- Home design: Single family residence; Built in 1955
- Construction: Shingle roof
- Exterior features: Level lot
Interior
- Kitchen: Kitchen on main level (vinyl flooring)
- Bedrooms: 3 bedrooms; Primary bedroom on main level; Second bedroom on main level; Third bedroom on main level (vinyl flooring, no egress window); Additional bedroom areas on upper, lower, basement and another additional level noted
- Flooring: Carpet in multiple rooms; Vinyl flooring in kitchen and one bedroom
- Bathrooms: 2 full bathrooms
- Heating & cooling: Window unit(s) for heating/cooling
- Interior features: Crawl space basement; No fireplaces
- Laundry & utility: Main level laundry
Neighborhood map
What this means for you Summary
Snapshot
- This is a 3-bed/2.0-bath other listed at $70k.
Deal economics
- At list price, monthly cash flow is $458 ($5k/yr) — positive.
- The deal already cash-flows at list — no discount required.
- Meets the 1% rule at list price ($1k rent vs $70k).
- Recommended offer: $68k (3.0% below list) — sets the bar for market timing.
Location & tenants
- Location reads 71/100 on livability (#331 in IL) — a middle-class / working-renter tenant base. Strengths: cost of living A+, housing A+, crime A; Watch: amenities F, commute F.
- Jacksonville SD 117 (town): math 20% / reading 23% proficiency, ranked #407 of 620 in IL (top 66%) — low school quality limits family demand, transient renter base, plan for 1-2y turnover.
- Zoned schools: South Jacksonville Elem School (math 17% / reading 22%, grade F, #1,054 of 2,056 statewide, top 54%, 311 students, 0% FRL) — zoned schools average 0% FRL vs 51% district-wide (51 pts lower); this property's tenant base skews higher-income than the district average.
- Market conditions: 141 active listings in the ZIP; 3 units permitted in Morgan County in 2024 (0 in 5+ unit buildings).
Forward outlook
- Local home prices are declining (-3.0%/yr); year-one equity from $484 of loan paydown is wiped out by about $2k of value loss. Plan a longer hold.
- Morgan County population projected at -20% by 2050 — secular population decline; favor cash flow + early exit over multi-decade hold.
- At projected returns (-3.0% appreciation + 3.0% rent growth), your $20k cash investment doubles in ~5 years — after that, you're playing with house money.
Negotiation context
- It's been on market 50 days — a 3% lower offer ($68k) is reasonable based on typical stale-listing flexibility.
Risks & watch-outs
- Watch-outs: property tax is 2.8% of price; built in 1955 — expect roof / HVAC / electrical / plumbing capex.
Questions for the listing agent
- It's been on market 50 days. Have you received any prior offers? Is the seller open to a 3% concession, seller financing, or rate buy-down credit?
- Built in 1955 — when were the roof, HVAC, electrical panel, plumbing, and water heater last replaced?
- Property tax is high relative to price — has the assessment been appealed recently, and will the sale trigger a re-assessment?
- Is there a deadline driving the sale (1031 exchange, divorce, estate, relocation)? That informs how much negotiation room exists.
- Schools are F-rated, which usually means shorter tenancies and higher turnover. Who's the typical renter profile here, and what's been the actual vacancy rate?
- What's the average days-on-market for RENTAL listings here right now (not sales)? A rising rental-DOM trend means longer vacancies and softer asking-rent achievability than the comps imply.
- What's the recent tenant-quality profile in this submarket — average credit score on applications, eviction rate, late-payment / NSF rate, and stable-employment percentage? A property-management company in the area should have these aggregated.
- How much new for-sale + rental construction is in the pipeline within 1–3 miles? Heavy new supply typically softens prices + rents 12–24 months out; constrained supply supports both.
Investment metrics
- 1% rule
- 1.84% ✓
- Cap rate
- 14.14%
- Cash-on-cash
- 28.02%
- DSCR
- 2.25
- GRM
- 4.5
CMA / ARV
- ARV (median comp)
- $117,482
- List price
- $70,000
- Delta
- -40.42%
- Verdict
- UNDERPRICED
- Comps
- 20 within 1.0 mi
Projected returns pro-forma
-3.0% appreciation · 3.0% rent growth · sell at horizon
- IRR
- 22.2%
- Equity multiple
- 1.91×
- Total profit
- $17,873
- Equity at exit
- $10,437
- IRR
- 30.3%
- Equity multiple
- 3.72×
- Total profit
- $53,370
- Equity at exit
- $6,052
Cash invested: $19,600 (down + closing). Projections, not guarantees.
Landlord ↔ Tenant lean methodology
- Overall (STATE)
- 43 Moderately Tenant-Leaning
- State Illinois
- 43 Moderately Tenant-Leaning · D+7
- County
- — inherits STATE
- City
- — inherits STATE
ZIP-level market 62650
- Active inventory
- 141
- Price-to-rent
- 4.5×
Monthly cashflow live
- Estimated rent
- $1,290 medium interval (Pro) →
- Mortgage (P&I)
- −$367
- Tax from tax record
- −$166 /mo · $1,986/yr
- Insurance
- −$29
- HOA
- −$0
- Vacancy / Maint / Mgmt
- −$271
- Net cashflow
- $458
Break-even live
Sensitivity live
| Price | -10% $497 | -5% $477 | +0% $458 | +5% $438 | +10% $418 |
|---|---|---|---|---|---|
| Rent | -10% $356 | -5% $407 | +0% $458 | +5% $509 | +10% $560 |
| Rate | -1.0pp $493 | -0.5pp $475 | base $458 | +0.5pp $440 | +1.0pp $421 |
UW: 25.0% down · 7.5% · 30yr · 1.5% tax · 5.0% vac · 8.0% maint · 8.0% mgmt
Financing live
Cash to close
- Down payment
- $17,500
- Closing costs
- $2,100
- Reserves months
- —
- Total cash needed
- —
Loan-product check · same deal, 3 products live
Conventional
25% down · 7.5% · 30yr
- Down + closing
- —
- Monthly P&I
- —
- Monthly cashflow
- —
- DSCR
- —
- Eligible?
- —
Personal DTI + credit; lowest rate.
DSCR
20% down · 8.5% · 30yr
- Down + closing
- —
- Monthly P&I
- —
- Monthly cashflow
- —
- DSCR
- —
- Eligible?
- —
No personal income docs; deal must DSCR.
Hard money
10% down · 12.0% · 12mo
- Down + closing
- —
- Monthly P&I
- —
- Monthly cashflow
- —
- DSCR
- —
- Eligible?
- —
Short-term bridge; refi at stabilization.
Listing history 17 events
-
2026-06-18days on market $70,000 Active 50 DOM
-
2026-06-17days on market $70,000 Active 49 DOM
-
2026-06-16days on market $70,000 Active 48 DOM
-
2026-06-15days on market $70,000 Active 47 DOM
-
2026-06-13days on market $70,000 Active 45 DOM
-
2026-06-12days on market $70,000 Active 44 DOM
-
2026-06-09days on market $70,000 Active 41 DOM
-
2026-06-08days on market $70,000 Active 40 DOM
-
2026-06-07days on market $70,000 Active 39 DOM
-
2026-06-07days on market $70,000 Active 38 DOM
-
2026-06-04days on market $70,000 Active 35 DOM
-
2026-06-02days on market $70,000 Active 34 DOM
-
2026-06-01days on market $70,000 Active 33 DOM
-
2026-05-31days on market $70,000 Active 32 DOM
-
2026-05-31days on market $70,000 Active 31 DOM
-
2026-05-08price $70,000 751-char remark
-
2026-04-27$78,500 Active 751-char remark
ⓘ Source: listings_history table (triggers on properties + properties_extension) + one-shot
backfill from property_details.listing_events for pre-trigger history.
Tax reassessment forecast IL · Partial reset (capped growth)
- Current annual tax
- $1,986 · $166/mo
- Projected year-2 tax
- $1,986 · $166/mo
- Expected delta
- $0/yr ($0/mo · 0.0%)
ⓘ Screening estimate from a state-policy table — verify with the county assessor before closing.
Climate risk First Street
- Flood 1/10 Low FEMA zone X (unshaded) · 0% chance over 30 yrs
- Wildfire 1/10 Low
- Heat 4/10 Moderate 7 d/yr ≥106°F today · 19 d/yr by 30 yrs out
- Wind 2/10 Low 100% chance of damaging wind over 30 yrs
- Air quality 2/10 Low 1 unhealthy d/yr today · 2 by 30 yrs out
Nearby sold comps map
Loading sold comps map…
Walkable amenities ~0.75 mi
Loading nearby amenities…
Taxation est. · year 1
- Rental income
- $15,485
- − Mortgage interest
- −$3,921
- − Property taxes
- −$1,986
- − Insurance
- −$350
- − Repairs & maintenance
- −$1,239
- − Management
- −$1,239
- − Depreciation
- −$2,036
- Taxable income
- $4,714
- Est. tax owed @ 24.0%
- −$1,131
- After-tax cash flow
- $4,361/yr
For passive investors: Depreciation is non-cash, so a rental often shows a tax loss while cash-flowing — sheltering income. Rental losses are passive: they offset passive income freely, and up to $25,000/yr can offset ordinary (W-2) income if you actively participate and your MAGI is under $100k (phasing out to $0 by $150k); unused losses carry forward. On sale, claimed depreciation is recaptured at up to 25%, and gains may owe capital-gains tax (a 1031 exchange can defer both). Figures are a year-1 estimate at your 24.0% rate — not tax advice; consult a CPA.
Schools (NCES district)
- District
- Jacksonville SD 117
- NCES district ID
- 1720280
- Math proficiency
- 20% ▼ -3.00%
- Reading proficiency
- 23% ▼ -6.00%
- Median HH income
- $44,909
- Composite
- 18.66/100
- National rank
- #8888
- State rank
- #407 of 620 in IL
Livability — South Jacksonville
- Score
- 71/100
- State rank
- #331
- US rank
- #6557
Category grades
Schools grade is shown separately in the Schools card above.
Census & demographics
- Census place
- South Jacksonville, IL
- Population (ZIP)
- 24,318
Population outlook (Morgan County) Hauer SSP2
- Today (2025)
- 32,874 people
- By 2030
- 31,698 · -3.6%
- By 2040
- 29,050 · -11.6%
- By 2050
- 26,381 · -19.8%
- By 2075
- 20,235 · -38.4%
- By 2100
- 14,324 · -56.4%
Race, ethnicity, and origin ACS 2023
- Neighborhood character
- Predominantly White (85%)
- Race & ethnicity
- White 85% Black 7% Two or more races 5% Hispanic / Latino 3%
- Common ancestry
- Lithuanian 2% Slovak 1% Iranian 1%
- Foreign-born
- 1% · Canada, South Korea
- Languages at home
- 97% English-only · Spanish 2%
Political lean MEDSL · Morgan
- 2024 margin
- Solid R (+32.5) · D 33.1% · R 65.6% · Other 1.3%
- 2008→2024 swing
- -31.7pp toward R · 2008: -0.8pp · 2024: -32.5pp
- All cycles
- 2024: R+32.5 2020: R+31.8 2016: R+29.9 2012: R+15.4 2008: R+0.8
Not yet ingested
- Civics
- —
Market trends
- HPI YoY
- ▼ -84.33%
- Current HPI
- 126.5712
- Rent YoY
- —
- Metro
- —
- State GDP YoY
- ▲ 1.59%
- F500 in state
- 60
Industry mix (Fortune 500 HQ in IL)
| Industry | F500 HQs | Revenue |
|---|---|---|
| Insurance | 4 | $201B |
|
||
| Consumer Goods | 4 | $87B |
|
||
| Industrial Machinery | 3 | $64B |
|
||
| Healthcare | 2 | $55B |
|
||
| Retail / Pharmacy | 1 | $148B |
|
||
| Agriculture / Food | 1 | $86B |
|
||
Price history
-10.8% since first listed2 events — show timeline
- 2026-05-08 Price Changed $70,000 RMLSA as Distributed by MLS Grid
- 2026-04-27 Listed $78,500 RMLSA as Distributed by MLS Grid
Property tax history
+1.0%/yrLatest (2025): $1,986 · +6.1% YoY. Source: county tax records.
Cash-flow waterfall
monthlySold comps — $/sqft
last 12 mo · ≤1 miLoading sold comps…