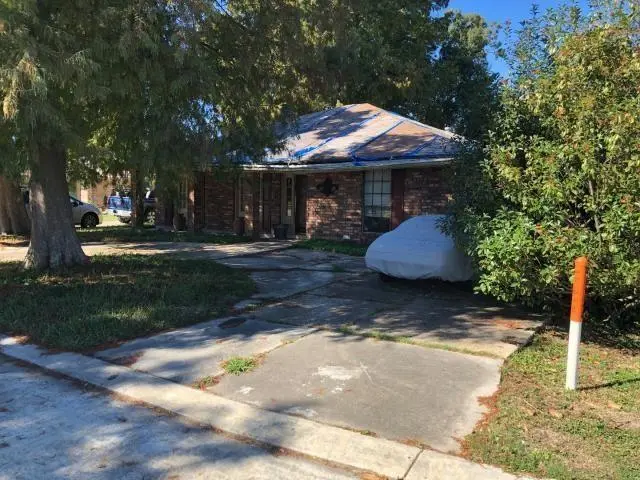
7 Garden Pl · River Ridge, LA
Flood risk 8/10 · Major
- FEMA flood zone
- X
- Chance of flooding over 30 yrs
- 0.99%
- Est. flood insurance / yr
- $507 – $1,088
Fire risk 1/10 · Minimal
- Est. fire insurance / yr
- $1,269 – $2,357
Heat risk 10/10 · Severe
- Hot days now (above 108°F)
- 7 days/yr
- Hot days in 30 yrs
- 21 days/yr
Wind risk 10/10 · Severe
- Chance of severe wind over 30 yrs
- 99.0%
Air-quality risk 3/10 · Minor
- Unhealthy air days now
- 2 days/yr
- Unhealthy air days in 30 yrs
- 3 days/yr
Risk factors via First Street. Map © Google.
Why this score? — see what drove the D grade
The composite is a weighted blend of 9 inputs, each scored 0–100. Each bar is that input's sub-score; the figure is the points it added to the 100-point composite (weight × sub-score).
- ARV discount +15.0/15.0
- Cash flow +11.0/30.0
- Livability +3.7/5.0
- DSCR +3.2/10.0
- 1% rule +2.6/10.0
- Rent growth +2.5/5.0
- Schools +2.5/10.0
- Condition / age +2.5/5.0
- Appreciation +0.0/10.0
$380,000
🖨 Deal sheet (PDF) 📄 Offer letter ✓ Due diligence
Listing remarks MLS
Great 4 bedroom, 2 full bathroom home located in River Ridge LA in Gargen Place. ****PROPERTY IS OCCUPIED AND NO INTERIOR ACCESS WILL BE PROVIDED. DO NOT APPROCH, DRIVE BY SHOWINGS ONLY!!!*****
Key facts
- 0.23 acre lot
- Built 1980
- Listed 206 days
Neighborhood map
What this means for you Summary
Snapshot
- This is a 4-bed/2.0-bath single-family listed at $380k.
Deal economics
- At list price, monthly cash flow is $-229 ($-3k/yr) — negative.
- To cash-flow at today's rent, offer at most $340k (10.6% below list).
- To meet the 1% rule (rent ≥ 1% of price), the offer needs to be $290k (23.6% below list).
- Recommended offer: $290k (23.6% below list) — sets the bar for 1% rule.
- Cap rate 5.8% vs local median 3.9% in River Ridge — top-decile yield for the area; either an underpriced asset or a hidden risk that comps aren't pricing in. Stress-test before assuming the spread holds.
Location & tenants
- Location reads 73/100 on livability (#31 in LA) — a middle-class / working-renter tenant base. Strengths: housing A+, employment A, crime A-; Watch: amenities F, commute F.
- Jefferson Parish (suburban): math 24% / reading 34% proficiency, ranked #44 of 98 in LA (top 45%) — low school quality limits family demand, transient renter base, plan for 1-2y turnover; 70% free/reduced lunch — lower-income household profile, screen leases tightly.
- Zoned schools: Hazel Park/Hilda Knoff School (math 21% / reading 39%, grade F, #328 of 646 statewide, top 51%, 462 students, 64% FRL); Riverdale High School (math 36% / reading 52%, grade F, #62 of 265 statewide, top 23%, 1,019 students, 50% FRL).
- Market conditions: Rents flat; 163 active listings in the ZIP; 4 comparable units currently listed for rent nearby; rentals at typical pace (median 26d on market — plan ~3-4 weeks tenant-placement turnaround); solid renter incomes; 518 units permitted in Jefferson Parish in 2024 (43 in 5+ unit buildings).
- This rent runs 42% of the median local income ($84k/yr) — at the standard rent-burdened threshold; future hikes will face affordability resistance.
Forward outlook
- Local home prices are declining (-3.0%/yr); year-one equity from $3k of loan paydown is wiped out by about $11k of value loss. Plan a longer hold.
Negotiation context
- It's been on market 206 days — a 12% lower offer ($334k) is reasonable based on typical stale-listing flexibility.
- 5 sale attempts since 27y ago with the ask held roughly flat each time — persistent listings suggest the price (not the market) is what's stuck; bring a comps-based counter.
- Current owner paid $265k; 43% above their basis — modest negotiation headroom, anchor on the comps not their cost.
Risks & watch-outs
- Watch-outs: flood insurance adds $66/mo.
- Climate carrying-cost: severe flood risk; severe wind risk, 99% chance of damaging wind over 30y; extreme-heat days projected 7→21/yr by 2055 (HVAC capex compounding) — expect insurance premiums to compound above CPI over the hold.
Questions for the listing agent
- What do current leases actually rent for vs. the listed asking? Can we see a recent rent roll and the last 12 months of T-12 income?
- It's been on market 206 days. Have you received any prior offers? Is the seller open to a 24% concession, seller financing, or rate buy-down credit?
- What's the actual annual flood-insurance premium (NFIP or private), and is the property in a SFHA with mandatory coverage?
- Why hasn't it sold? Are there any deal-killer items the seller is aware of (foundation, flood, title, zoning, code violations)?
- Is there a deadline driving the sale (1031 exchange, divorce, estate, relocation)? That informs how much negotiation room exists.
- Schools are B-rated — typically a magnet for longer-tenancy family renters. What's the average tenant stay here, and is there a school-zone premium baked into asking?
- The area grade is low — what's the realistic commute time and amenity access for the typical tenant pool here? Any planned neighborhood developments (good or bad) we should know about?
- What's the average days-on-market for RENTAL listings here right now (not sales)? A rising rental-DOM trend means longer vacancies and softer asking-rent achievability than the comps imply.
- What's the recent tenant-quality profile in this submarket — average credit score on applications, eviction rate, late-payment / NSF rate, and stable-employment percentage? A property-management company in the area should have these aggregated.
- How much new for-sale + rental construction is in the pipeline within 1–3 miles? Heavy new supply typically softens prices + rents 12–24 months out; constrained supply supports both.
Investment metrics
- 1% rule
- 0.76% ✗
- Cap rate
- 5.78%
- Cash-on-cash
- -1.83%
- DSCR
- 0.92
- GRM
- 10.9
CMA / ARV
- ARV (median comp)
- $513,178
- List price
- $380,000
- Delta
- -25.95%
- Verdict
- UNDERPRICED
- Comps
- 20 within 1.0 mi
Show comp detail 12 sales within ~0.75 mi
| Address | Dist | Beds/Ba | Sqft | Sold | Price | $/sf | Match |
|---|---|---|---|---|---|---|---|
| 9628 Charlotte Dr | 0.32mi | 4/3.0 | 2,665 (-1%) | 5mo | $230,000 | $86 | 76 |
| 9708 Gloxinia Cir | 0.08mi | 4/3.0 | 2,936 (+10%) | 2mo | $582,500 | $198 | 75 |
| 9612 Charlotte Dr | 0.33mi | 4/2.5 | 2,642 (-2%) | 6mo | $542,000 | $205 | 75 |
| 132 Drolla Park | 0.20mi | 3/3.0 (-1) | 2,360 (-12%) | 2mo | $505,000 | $214 | 60 |
| 100 Andrea St | 0.54mi | 4/3.0 | 2,806 (+5%) | 4mo | $657,500 | $234 | 60 |
| 9424 Sharla Dr | 0.67mi | 4/3.0 | 2,585 (-4%) | 6mo | $365,000 | $141 | 54 |
| 9120 Darby Ln | 0.62mi | 4/3.0 | 2,992 (+12%) | 2mo | $700,000 | $234 | 46 |
| 10109 Tiffany Dr | 0.75mi | 4/2.5 | 2,452 (-9%) | 4mo | $372,000 | $152 | 45 |
| 16 Idlewood Pl | 0.71mi | 3/3.5 (-1) | 2,800 (+4%) | 4mo | $575,000 | $205 | 45 |
| 9429 Roslyn Dr | 0.73mi | 5/3.0 (+1) | 2,895 (+8%) | 3mo | $419,000 | $145 | 41 |
| 9413 Citrus Ln | 0.63mi | 3/2.5 (-1) | 2,329 (-13%) | 0mo | $340,000 | $146 | 41 |
| 159 Moss Dr | 0.72mi | 5/2.5 (+1) | 2,305 (-14%) | 5mo | $399,000 | $173 | 32 |
Match score weights: distance 35% · size 25% · config 20% · recency 20%. Top-matched comps best support the ARV.
Projected returns pro-forma
-3.0% appreciation · 0.12% rent growth · sell at horizon
- IRR
- -23.7%
- Equity multiple
- 0.21×
- Total profit
- $-84,360
- Equity at exit
- $56,659
- IRR
- -28.8%
- Equity multiple
- -0.17×
- Total profit
- $-123,994
- Equity at exit
- $32,855
Cash invested: $106,400 (down + closing). Projections, not guarantees.
Landlord ↔ Tenant lean methodology
- Overall (STATE)
- 90 Strongly Landlord-Friendly
- State Louisiana
- 90 Strongly Landlord-Friendly · R+12
- County
- — inherits STATE
- City
- — inherits STATE
ZIP-level market 70123
- Rents YoY
- 0.1%
- Active inventory
- 163
- Price-to-rent
- 10.9×
Monthly cashflow live
- Estimated rent
- $2,902 medium interval (Pro) →
- Mortgage (P&I)
- −$1,993
- Tax from tax record
- −$304 /mo · $3,650/yr
- Insurance
- −$158
- Flood insurance flood zone
- −$66 /mo · $798/yr
- HOA
- −$0
- Lot rent
- −$0
- Vacancy / Maint / Mgmt
- −$609
- Net cashflow
- $-229
Break-even live
Sensitivity live
| Price | -10% $-14 | -5% $-122 | +0% $-229 | +5% $-337 | +10% $-444 |
|---|---|---|---|---|---|
| Rent | -10% $-458 | -5% $-344 | +0% $-229 | +5% $-114 | +10% $0 |
| Rate | -1.0pp $-38 | -0.5pp $-132 | base $-229 | +0.5pp $-328 | +1.0pp $-428 |
UW: 25.0% down · 7.5% · 30yr · 1.5% tax · 5.0% vac · 8.0% maint · 8.0% mgmt
Financing live
Cash to close
- Down payment
- $95,000
- Closing costs
- $11,400
- Reserves months
- —
- Total cash needed
- —
Loan-product check · same deal, 3 products live
Conventional
25% down · 7.5% · 30yr
- Down + closing
- —
- Monthly P&I
- —
- Monthly cashflow
- —
- DSCR
- —
- Eligible?
- —
Personal DTI + credit; lowest rate.
DSCR
20% down · 8.5% · 30yr
- Down + closing
- —
- Monthly P&I
- —
- Monthly cashflow
- —
- DSCR
- —
- Eligible?
- —
No personal income docs; deal must DSCR.
Hard money
10% down · 12.0% · 12mo
- Down + closing
- —
- Monthly P&I
- —
- Monthly cashflow
- —
- DSCR
- —
- Eligible?
- —
Short-term bridge; refi at stabilization.
Rent comps 4 comps
| Address | Beds | Baths | Sqft | Rent | $/sqft | DOM | Units | Dist |
|---|---|---|---|---|---|---|---|---|
| 10125 Stacy Ct New Orleans, LA | 3.0 | 2.0 | 1950 | $2,350 | $1.21 | 0d | 1 | 0.54mi |
| 1000 Rural St New Orleans, LA | 3.0 | 2.5 | 2150 | $2,600 | $1.21 | 46d | 1 | 0.81mi |
| 527 Little Farms Ave New Orleans, LA | 3.0 | 2.0 | 1855 | $2,800 | $1.51 | 26d | 1 | 0.91mi |
| 10145 Stephen Dr River Ridge, LA | 5.0 | 4.5 | 2853 | $6,000 | $2.10 | 26d | 1 | 1.12mi |
Listing history 23 events
-
2026-06-22days on market $380,000 Active 206 DOM
-
2026-06-21days on market $380,000 Active 205 DOM
-
2026-06-18days on market $380,000 Active 202 DOM
-
2026-06-17days on market $380,000 Active 201 DOM
-
2026-06-16days on market $380,000 Active 200 DOM
-
2026-06-15days on market $380,000 Active 199 DOM
-
2026-06-13days on market $380,000 Active 197 DOM
-
2026-06-10days on market $380,000 Active 194 DOM
-
2026-06-09days on market $380,000 Active 193 DOM
-
2026-06-08days on market $380,000 Active 192 DOM
-
2026-06-07days on market $380,000 Active 191 DOM
-
2026-06-03days on market $380,000 Active 187 DOM
-
2026-06-02days on market $380,000 Active 186 DOM
-
2026-06-01days on market $380,000 Active 185 DOM
-
2026-05-31days on market $380,000 Active 184 DOM
-
2025-11-24$380,000 Active 193-char remark
Show marketing remark (193 chars)
Great 4 bedroom, 2 full bathroom home located in River Ridge LA in Gargen Place. ****PROPERTY IS OCCUPIED AND NO INTERIOR ACCESS WILL BE PROVIDED. DO NOT APPROCH, DRIVE BY SHOWINGS ONLY!!!*****
-
2004-07-15soldstatus $265,000
-
2004-07-01soldstatus $264,000
-
2004-04-18$279,500
-
2004-04-18$279,500
-
1999-12-13soldstatus $192,000
-
1999-09-22$198,000
-
1999-09-22$198,000
ⓘ Source: listings_history table (triggers on properties + properties_extension) + one-shot
backfill from property_details.listing_events for pre-trigger history.
Tax reassessment forecast LA · Resets to sale price
- Current annual tax
- $3,650 · $304/mo
- Projected year-2 tax
- $3,650 · $304/mo
- Expected delta
- $0/yr ($0/mo · 0.0%)
ⓘ Screening estimate from a state-policy table — verify with the county assessor before closing.
Climate risk First Street
- Flood 8/10 Severe FEMA zone X · 99% chance over 30 yrs
- Wildfire 1/10 Low
- Heat 10/10 Extreme 7 d/yr ≥108°F today · 21 d/yr by 30 yrs out
- Wind 10/10 Extreme 99% chance of damaging wind over 30 yrs
- Air quality 3/10 Moderate 2 unhealthy d/yr today · 3 by 30 yrs out
Nearby sold comps map
Loading sold comps map…
Walkable amenities ~0.75 mi
Loading nearby amenities…
Taxation est. · year 1
- Rental income
- $34,825
- − Mortgage interest
- −$21,286
- − Property taxes
- −$3,650
- − Insurance
- −$2,698
- − Repairs & maintenance
- −$2,786
- − Management
- −$2,786
- − Depreciation
- −$11,055
- Taxable loss
- −$9,435
- Est. tax savings @ 24.0%
- +$2,264
- After-tax cash flow
- $-484/yr
For passive investors: Depreciation is non-cash, so a rental often shows a tax loss while cash-flowing — sheltering income. Rental losses are passive: they offset passive income freely, and up to $25,000/yr can offset ordinary (W-2) income if you actively participate and your MAGI is under $100k (phasing out to $0 by $150k); unused losses carry forward. On sale, claimed depreciation is recaptured at up to 25%, and gains may owe capital-gains tax (a 1031 exchange can defer both). Figures are a year-1 estimate at your 24.0% rate — not tax advice; consult a CPA.
Schools (NCES district)
- District
- Jefferson Parish
- NCES district ID
- 2200840
- Math proficiency
- 24% ▼ -36.00%
- Reading proficiency
- 34% ▼ -30.00%
- Median HH income
- $48,421
- Composite
- 25.19/100
- National rank
- #7511
- State rank
- #44 of 98 in LA
Livability — River Ridge
- Score
- 73/100
- State rank
- #31
- US rank
- #5069
Category grades
Schools grade is shown separately in the Schools card above.
Census & demographics
- Census place
- River Ridge, LA
- County
- Jefferson Parish · 426,999 people
- City population
- 27,386
- Metro
- New Orleans-Metairie, LA
- Population (ZIP)
- 27,386
- Household income
- $83,585
- Rent vs Own
- Severe rent burden
- 1282.0
Population outlook (Jefferson County) Hauer SSP2
- Today (2025)
- 451,696 people
- By 2030
- 455,451 · +0.8%
- By 2040
- 458,308 · +1.5%
- By 2050
- 461,031 · +2.1%
- By 2075
- 476,351 · +5.5%
- By 2100
- 499,377 · +10.6%
Race, ethnicity, and origin ACS 2023
- Neighborhood character
- Predominantly White (73%)
- Race & ethnicity
- White 73% Black 12% Hispanic / Latino 9% Two or more races 7% Asian 4%
- Hispanic origin (detail)
- Mexican 2% Cuban 1%
- Common ancestry
- Lithuanian 17% Slovak 1% Italian 1%
- Foreign-born
- 7% · Canada
- Languages at home
- 90% English-only · Spanish 4% Other Indo-European 1% Tagalog/Filipino 1%
Political lean MEDSL · Jefferson
- 2024 margin
- R (+12.9) · D 42.5% · R 55.5% · Other 2.1%
- 2008→2024 swing
- +13.6pp toward D · 2008: -26.6pp · 2024: -12.9pp
- All cycles
- 2024: R+12.9 2020: R+11.1 2016: R+14.8 2012: R+18.4 2008: R+26.6
Not yet ingested
- Civics
- —
Market trends
- HPI YoY
- ▼ -226.09%
- Current HPI
- 141.1799
- Rent YoY
- ▲ 0.12%
- Metro
- New Orleans-Metairie, LA
- State GDP YoY
- ▲ 3.29%
- F500 in state
- 10
Industry mix (Fortune 500 HQ in LA)
| Industry | F500 HQs | Revenue |
|---|---|---|
| Telecommunications | 2 | $23B |
|
||
| Utilities | 1 | $12B |
|
||
| Wholesale / Distribution | 1 | $5B |
|
||
| Advertising | 1 | $2B |
|
||
Price history
+91.9% since first listed8 events — show timeline
- 2025-11-24 Listed $380,000 AcadianaMLS
- 2004-07-15 Sold (MLS) $265,000 GSREIN
- 2004-07-01 Sold (Public Records) $264,000 Public Records
- 2004-04-18 Listed $279,500 GSREIN
- 2004-04-18 Listed $279,500 AcadianaMLS
- 1999-12-13 Sold (MLS) $192,000 GSREIN
- 1999-09-22 Listed $198,000 GSREIN
- 1999-09-22 Listed $198,000 AcadianaMLS
Property tax history
+1.8%/yrLatest (2025): $3,650 · +5.2% YoY. Source: county tax records.
Cash-flow waterfall
monthlySold comps — $/sqft
last 12 mo · ≤1 miLoading sold comps…