 Multi-family
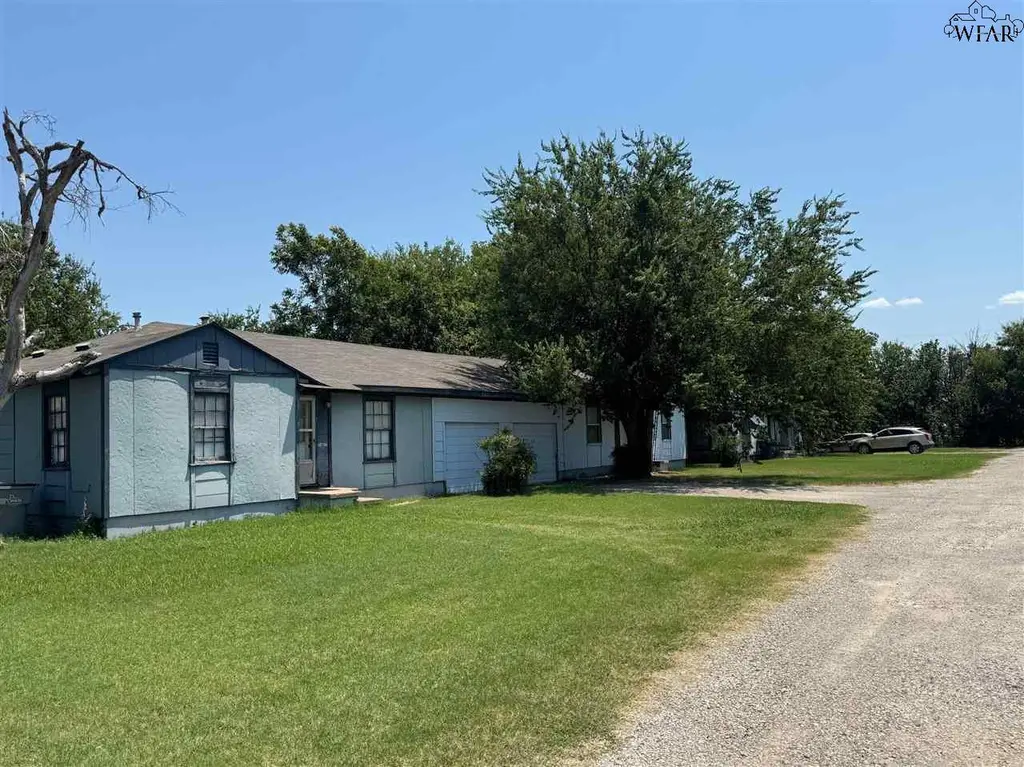
4707 Coronado Ave · Wichita Falls, TX
Flood risk 1/10 · Minimal
- FEMA flood zone
- X (unshaded)
- Chance of flooding over 30 yrs
- 0.0%
- Est. flood insurance / yr
- $507 – $1,088
Fire risk 7/10 · Major
- Est. fire insurance / yr
- $1,222 – $2,270
Heat risk 7/10 · Major
- Hot days now (above 109°F)
- 7 days/yr
- Hot days in 30 yrs
- 20 days/yr
Wind risk 4/10 · Minor
- Chance of severe wind over 30 yrs
- 9.0%
Air-quality risk 1/10 · Minimal
- Unhealthy air days now
- 0 days/yr
- Unhealthy air days in 30 yrs
- 0 days/yr
Risk factors via First Street. Map © Google.
Why this score? — see what drove the C+ grade
The composite is a weighted blend of 9 inputs, each scored 0–100. Each bar is that input's sub-score; the figure is the points it added to the 100-point composite (weight × sub-score).
- Cash flow +26.1/30.0
- DSCR +8.8/10.0
- ARV discount +7.5/15.0
- 1% rule +6.9/10.0
- Livability +3.5/5.0
- Rent growth +3.4/5.0
- Schools +2.7/10.0
- Condition / age +2.2/5.0
- Appreciation +0.0/10.0
$159,900
🖨 Deal sheet 📄 Offer letter ✓ Due diligence
Multi-family units
County records classify this as Multi-Family (2-4 Unit). Listing-text estimate: 1 unit. estimate disagrees with records
Listing remarks MLS
Great investment opportunity! Triplex featuring three total units. Two units are approximately 796 sq ft each, with 2 bedrooms and 1 bathroom per unit. The third unit is approximately 1,200 sq ft with 2 bedrooms and 3 bathrooms. Owner is currently making updates, and a new roof will be installed on all units within the next month. All offers will be considered
Key facts
- Listed 311 days
Neighborhood map
What this means for you Summary
Snapshot
- This is a 6-bed/?-bath multifamily listed at $160k. Condition is rated fair.
Deal economics
- At list price, monthly cash flow is $402 ($5k/yr) — positive.
- The deal already cash-flows at list — no discount required.
- Meets the 1% rule at list price ($2k rent vs $160k).
- Recommended offer: $141k (12.0% below list) — sets the bar for market timing.
- Cap rate 9.3% vs local median 4.7% in Wichita Falls — top-decile yield for the area; either an underpriced asset or a hidden risk that comps aren't pricing in. Stress-test before assuming the spread holds.
Location & tenants
- Location reads 69/100 on livability (#437 in TX) — a middle-class / working-renter tenant base. Strengths: cost of living A+, housing A+; Watch: health & safety C-, employment D+, schools D.
- Wichita Falls ISD (urban): math 31% / reading 33% proficiency, ranked #585 of 826 in TX (top 71%) — families likely to look elsewhere, expect single-tenant / working-renter base with shorter leases.
- Market conditions: Rents rising (+3.8%/yr); 130 active listings in the ZIP; 231 units permitted in Wichita County in 2024 (10 in 5+ unit buildings).
- This rent runs 31% of the median local income ($75k/yr) — at the standard rent-burdened threshold; future hikes will face affordability resistance.
Forward outlook
- Local home prices are declining (-3.0%/yr); year-one equity from $1k of loan paydown is wiped out by about $5k of value loss. Plan a longer hold.
- Wichita County population projected to shrink 7% by 2050 — rents likely to lag national; underwrite the cash flow, not the appreciation.
- At projected returns (-3.0% appreciation + 3.8% rent growth), your $45k cash investment doubles in ~10 years — after that, you're playing with house money.
Negotiation context
- It's been on market 312 days — a 12% lower offer ($141k) is reasonable based on typical stale-listing flexibility.
Risks & watch-outs
- Climate carrying-cost: major wildfire risk; extreme-heat days projected 7→20/yr by 2055 (HVAC capex compounding) — expect insurance premiums to compound above CPI over the hold.
Questions for the listing agent
- It's been on market 312 days. Have you received any prior offers? Is the seller open to a 12% concession, seller financing, or rate buy-down credit?
- Have any recent inspections been done? Can we get a copy of the seller's disclosures and any deferred-maintenance estimates?
- Why hasn't it sold? Are there any deal-killer items the seller is aware of (foundation, flood, title, zoning, code violations)?
- Is there a deadline driving the sale (1031 exchange, divorce, estate, relocation)? That informs how much negotiation room exists.
- Schools are D-rated, which usually means shorter tenancies and higher turnover. Who's the typical renter profile here, and what's been the actual vacancy rate?
- Crime grade is D in this area — have there been break-ins, vandalism, or insurance claims at this property in the last 3 years? What carrier currently insures it and at what premium?
- What's the average days-on-market for RENTAL listings here right now (not sales)? A rising rental-DOM trend means longer vacancies and softer asking-rent achievability than the comps imply.
- What's the recent tenant-quality profile in this submarket — average credit score on applications, eviction rate, late-payment / NSF rate, and stable-employment percentage? A property-management company in the area should have these aggregated.
- How much new apartment / multifamily construction is in the pipeline within 1–3 miles? Heavy new supply (>2% of stock underway) typically softens rents 12–24 months out; light construction supports rent growth.
Investment metrics
- 1% rule
- 1.19% ✓
- Cap rate
- 9.31%
- Cash-on-cash
- 10.78%
- DSCR
- 1.48
- GRM
- 7.0
CMA / ARV
No comps found within radius.
Projected returns pro-forma
-3.0% appreciation · 3.77% rent growth · sell at horizon
- IRR
- 0.7%
- Equity multiple
- 1.03×
- Total profit
- $1,217
- Equity at exit
- $23,842
- IRR
- 11.1%
- Equity multiple
- 1.90×
- Total profit
- $40,360
- Equity at exit
- $13,825
Cash invested: $44,772 (down + closing). Projections, not guarantees.
Landlord ↔ Tenant lean methodology
- Overall (STATE)
- 87 Strongly Landlord-Friendly
- State Texas
- 87 Strongly Landlord-Friendly · R+5
- County
- — inherits STATE
- City
- — inherits STATE
ZIP-level market 76308
- Rents YoY
- 3.8%
- Active inventory
- 130
- Price-to-rent
- 7.0×
Monthly cashflow live
- Estimated rent
- $1,908 medium interval (Pro) →
- Mortgage (P&I)
- −$839
- Tax est. 1.5%
- −$200 /mo · $2,398/yr
- Insurance
- −$67
- HOA
- −$0
- Vacancy / Maint / Mgmt
- −$401
- Net cashflow
- $402
Break-even live
UW: 25.0% down · 7.5% · 30yr · 1.5% tax · 5.0% vac · 8.0% maint · 8.0% mgmt
Financing live
Cash to close
- Down payment
- $39,975
- Closing costs
- $4,797
- Reserves months
- —
- Total cash needed
- —
Loan-product check · same deal, 3 products live
Conventional
25% down · 7.5% · 30yr
- Down + closing
- —
- Monthly P&I
- —
- Monthly cashflow
- —
- DSCR
- —
- Eligible?
- —
Personal DTI + credit; lowest rate.
DSCR
20% down · 8.5% · 30yr
- Down + closing
- —
- Monthly P&I
- —
- Monthly cashflow
- —
- DSCR
- —
- Eligible?
- —
No personal income docs; deal must DSCR.
Hard money
10% down · 12.0% · 12mo
- Down + closing
- —
- Monthly P&I
- —
- Monthly cashflow
- —
- DSCR
- —
- Eligible?
- —
Short-term bridge; refi at stabilization.
Listing history 20 events
-
2026-06-19days on market $159,900 Active 312 DOM
-
2026-06-18days on market $159,900 Active 311 DOM
-
2026-06-17days on market $159,900 Active 310 DOM
-
2026-06-16days on market $159,900 Active 309 DOM
-
2026-06-15days on market $159,900 Active 308 DOM
-
2026-06-14days on market $159,900 Active 306 DOM
-
2026-06-13days on market $159,900 Active 305 DOM
-
2026-06-10days on market $159,900 Active 303 DOM
-
2026-06-09days on market $159,900 Active 302 DOM
-
2026-06-08days on market $159,900 Active 301 DOM
-
2026-06-07days on market $159,900 Active 300 DOM
-
2026-06-05days on market $159,900 Active 297 DOM
-
2026-06-02days on market $159,900 Active 295 DOM
-
2026-06-01days on market $159,900 Active 294 DOM
-
2026-05-31days on market $159,900 Active 293 DOM
-
2026-05-30days on market $159,900 Active 292 DOM
-
2026-04-21price $159,900 362-char remark
Show marketing remark (362 chars)
Great investment opportunity! Triplex featuring three total units. Two units are approximately 796 sq ft each, with 2 bedrooms and 1 bathroom per unit. The third unit is approximately 1,200 sq ft with 2 bedrooms and 3 bathrooms. Owner is currently making updates, and a new roof will be installed on all units within the next month. All offers will be considered
-
2025-09-23price $165,000 362-char remark
Show marketing remark (362 chars)
Great investment opportunity! Triplex featuring three total units. Two units are approximately 796 sq ft each, with 2 bedrooms and 1 bathroom per unit. The third unit is approximately 1,200 sq ft with 2 bedrooms and 3 bathrooms. Owner is currently making updates, and a new roof will be installed on all units within the next month. All offers will be considered
-
2025-08-11price $169,999 362-char remark
Show marketing remark (362 chars)
Great investment opportunity! Triplex featuring three total units. Two units are approximately 796 sq ft each, with 2 bedrooms and 1 bathroom per unit. The third unit is approximately 1,200 sq ft with 2 bedrooms and 3 bathrooms. Owner is currently making updates, and a new roof will be installed on all units within the next month. All offers will be considered
-
2025-08-11$167,100 Active 362-char remark
Show marketing remark (362 chars)
Great investment opportunity! Triplex featuring three total units. Two units are approximately 796 sq ft each, with 2 bedrooms and 1 bathroom per unit. The third unit is approximately 1,200 sq ft with 2 bedrooms and 3 bathrooms. Owner is currently making updates, and a new roof will be installed on all units within the next month. All offers will be considered
ⓘ Source: listings_history table (triggers on properties + properties_extension) + one-shot
backfill from property_details.listing_events for pre-trigger history.
Climate risk First Street
- Flood 1/10 Low FEMA zone X (unshaded) · 0% chance over 30 yrs
- Wildfire 7/10 Severe
- Heat 7/10 Severe 7 d/yr ≥109°F today · 20 d/yr by 30 yrs out
- Wind 4/10 Moderate 9% chance of damaging wind over 30 yrs
- Air quality 1/10 Low 0 unhealthy d/yr today · 0 by 30 yrs out
Nearby sold comps map
Loading sold comps map…
Walkable amenities ~0.75 mi
Loading nearby amenities…
Taxation est. · year 1
- Rental income
- $22,893
- − Mortgage interest
- −$8,957
- − Property taxes
- −$2,398
- − Insurance
- −$800
- − Repairs & maintenance
- −$1,831
- − Management
- −$1,831
- − Depreciation
- −$4,652
- Taxable income
- $2,424
- Est. tax owed @ 24.0%
- −$582
- After-tax cash flow
- $4,243/yr
For passive investors: Depreciation is non-cash, so a rental often shows a tax loss while cash-flowing — sheltering income. Rental losses are passive: they offset passive income freely, and up to $25,000/yr can offset ordinary (W-2) income if you actively participate and your MAGI is under $100k (phasing out to $0 by $150k); unused losses carry forward. On sale, claimed depreciation is recaptured at up to 25%, and gains may owe capital-gains tax (a 1031 exchange can defer both). Figures are a year-1 estimate at your 24.0% rate — not tax advice; consult a CPA.
Condition & rehab AI · 13 photos
This property requires moderate repairs and maintenance to improve its condition and value. Exterior siding and interior paint need attention, and replacing the carpet will enhance both resale and rental value.
Repairs flagged
- Major exterior siding — Significant weathering and discoloration
- Minor interior paint — Some wear
- Minor kitchen appliances — Standard appliances, some wear
Value-add opportunities
- Both paint exterior — Enhances curb appeal and value
- Both replace carpet — Improves comfort and value
- Both update kitchen appliances — Modernizes and increases value
Renovation cost estimate screening
| Repair item | Severity | Est. cost |
|---|---|---|
| exterior siding · Significant weathering and discoloration | Major | $15,000–50,000 |
| interior paint · Some wear | Minor | $500–3,000 |
| kitchen appliances · Standard appliances, some wear | Minor | $500–3,000 |
| Total estimated repair cost · 3 items | $16,000–56,000 |
Value-add ROI direction
- Both paint exterior — Enhances curb appeal and value ↑
- Both replace carpet — Improves comfort and value ↑
- Both update kitchen appliances — Modernizes and increases value ↑
ⓘ Cost ranges are severity-bucket heuristics (US national rule-of-thumb). Get contractor quotes + a written scope before underwriting a rehab budget.
Schools (NCES district)
- District
- Wichita Falls ISD
- NCES district ID
- 4845780
- Math proficiency
- 31% ▼ -10.00%
- Reading proficiency
- 33% ▼ -7.00%
- Median HH income
- $41,604
- Composite
- 27.06/100
- National rank
- #7051
- State rank
- #585 of 826 in TX
Livability — Wichita Falls
- Score
- 69/100
- State rank
- #437
- US rank
- #8940
Category grades
Schools grade is shown separately in the Schools card above.
Census & demographics
- Census place
- Wichita Falls, TX
- County
- Wichita County · 95,694 people
- City population
- 95,694
- Metro
- Wichita Falls, TX
- Population (ZIP)
- 21,896
- Household income
- $74,772
- Rent vs Own
- Severe rent burden
- 708.0
Population outlook (Wichita County) Hauer SSP2
- Today (2025)
- 129,638 people
- By 2030
- 128,366 · -1.0%
- By 2040
- 124,466 · -4.0%
- By 2050
- 120,499 · -7.0%
- By 2075
- 113,884 · -12.2%
- By 2100
- 101,818 · -21.5%
Race, ethnicity, and origin ACS 2023
- Neighborhood character
- Predominantly White (72%)
- Race & ethnicity
- White 72% Hispanic / Latino 16% Black 9% Two or more races 7% Asian 1%
- Hispanic origin (detail)
- Mexican 13%
- Common ancestry
- Serbian 2% Italian 2% Slovak 1%
- Foreign-born
- 6% · Canada
- Languages at home
- 90% English-only · Spanish 6% Arabic 1% German/W. Germanic 1%
Political lean MEDSL · Wichita
- 2024 margin
- Solid R (+44.0) · D 27.5% · R 71.5%
- 2008→2024 swing
- -5.2pp toward R · 2008: -38.9pp · 2024: -44.0pp
- All cycles
- 2024: R+44.0 2020: R+41.1 2016: R+49.7 2012: R+47.1 2008: R+38.9
Not yet ingested
- Civics
- —
Market trends
- HPI YoY
- ▼ -118.47%
- Current HPI
- 177.1989
- Rent YoY
- ▲ 3.77%
- Metro
- Wichita Falls, TX
- State GDP YoY
- ▲ 3.95%
- F500 in state
- 110
Industry mix (Fortune 500 HQ in TX)
| Industry | F500 HQs | Revenue |
|---|---|---|
| Energy | 16 | $1,198B |
|
||
| Technology | 5 | $198B |
|
||
| Engineering / Construction | 4 | $72B |
|
||
| Energy Services | 3 | $60B |
|
||
| Utilities | 3 | $41B |
|
||
| Healthcare | 2 | $330B |
|
||
Price history
-4.3% since first listed4 events — show timeline
- 2026-04-21 Price Changed $159,900 WFAOR
- 2025-09-23 Price Changed $165,000 WFAOR
- 2025-08-11 Price Changed $169,999 WFAOR
- 2025-08-11 Listed $167,100 WFAOR
Cash-flow waterfall
monthlySold comps — $/sqft
last 12 mo · ≤1 miLoading sold comps…