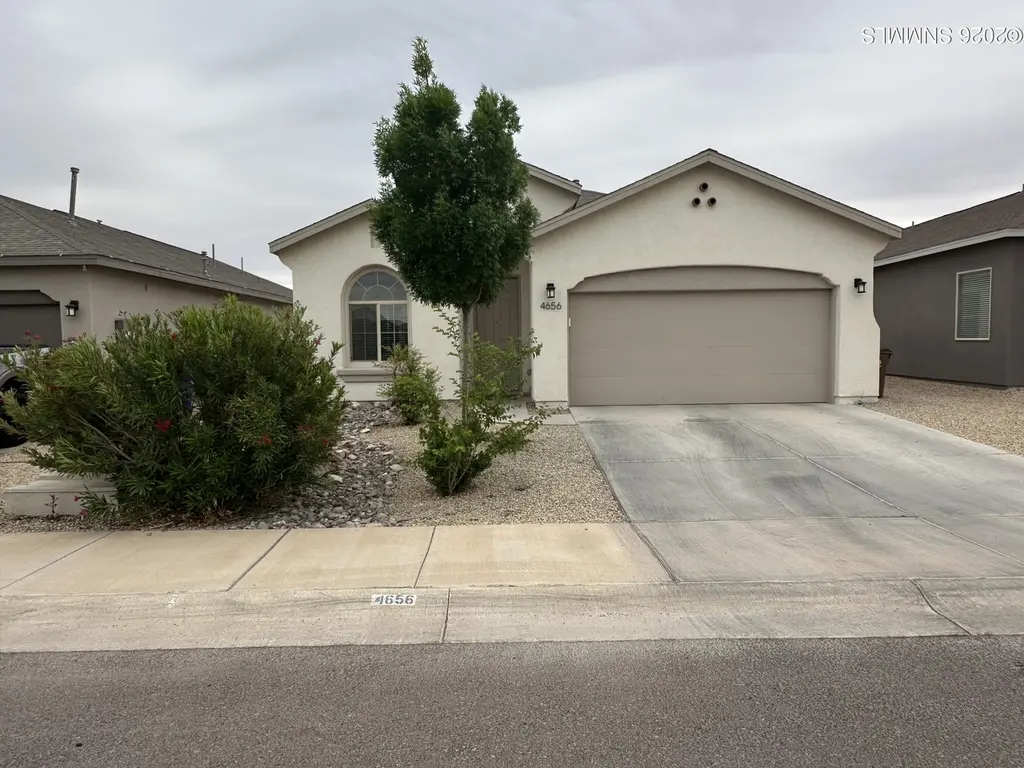
4656 Toluca Ave · Las Cruces, NM
Flood risk No data
- FEMA flood zone
- —
- Chance of flooding over 30 yrs
- —
- Est. flood insurance / yr
- —
Fire risk No data
- Est. fire insurance / yr
- —
Heat risk No data
- Hot days now (above threshold)
- —
- Hot days in 30 yrs
- —
Wind risk No data
- Chance of severe wind over 30 yrs
- —
Air-quality risk No data
- Unhealthy air days now
- —
- Unhealthy air days in 30 yrs
- —
Risk factors via First Street. Map © Google.
Why this score? — see what drove the D- grade
The composite is a weighted blend of 9 inputs, each scored 0–100. Each bar is that input's sub-score; the figure is the points it added to the 100-point composite (weight × sub-score).
- ARV discount +15.0/15.0
- Cash flow +7.3/30.0
- Schools +4.6/10.0
- Rent growth +3.4/5.0
- Livability +3.0/5.0
- Condition / age +2.5/5.0
- 1% rule +1.4/10.0
- DSCR +1.4/10.0
- Appreciation +0.0/10.0
$325,000
🖨 Deal sheet 📄 Offer letter ✓ Due diligence
Listing remarks
Welcome to 4656 Toluca Ave in the desirable Metro Park Village subdivision of Las Cruces, New Mexico! Built in 2020 by Hakes Brothers Construction, this well-maintained 3-bedroom, 2-bath home offers 1,646 sq ft of modern living on a 5,619 sq ft lot. Enjoy an open floor plan with abundant natural light, a spacious kitchen, and comfortable living areas designed for today's lifestyle. The backyard features artificial turf and is fully enclosed with a rock wall--perfect for low-maintenance outdoor living. Xeriscape landscaping in both front and back enhances efficiency. Take in views of the Organ Mountains and enjoy a neighborhood park just around the block. Additional features include a 2-car
Key facts
- 5,619 sq ft lot
- 2 garage spots
- Built 2020
Property features AI
Exterior
- Parking: 2-car garage; Garage door opener
- Utilities: Public water; Public sewer; Natural gas available; Phone service available
- Home design: Single-family residence; One story; Built by Hakes Brothers
- Construction: Stucco exterior; Composition roof; Slab foundation
- Exterior features: Covered patio/porch; Back yard fencing; Has a view; Solar panels/solar generation
Interior
- Kitchen: Dishwasher; Range; Oven; Disposal; Gas cooktop; Microwave; Refrigerator
- Bathrooms: 2 full bathrooms
- Heating & cooling: Forced air heating; Active solar heating; Central air conditioning
- Interior features: Kitchen island; Pantry; Walk-in closet(s); Open floor plan
- Laundry & utility: Gas water heater
Neighborhood map
What this means for you Summary
Snapshot
- This is a 3-bed/2.0-bath single-family listed at $325k.
Deal economics
- At list price, monthly cash flow is $-435 ($-5k/yr) — negative.
- To cash-flow at today's rent, offer at most $248k (23.6% below list).
- To meet the 1% rule (rent ≥ 1% of price), the offer needs to be $208k (36.0% below list).
- Recommended offer: $208k (36.0% below list) — sets the bar for 1% rule.
Location & tenants
- Location reads 59/100 on livability (#120 in NM) — a working-class tenant base; expect higher turnover. Strengths: cost of living A+, housing A; Watch: amenities D+, schools D-, crime F.
- Las Cruces Public Schools (urban): math 42% / reading 68% proficiency, ranked #5 of 29 in NM (top 17%) — acceptable for families but not a draw, mixed tenant base, ~2y average lease; 62% free/reduced lunch — lower-income household profile, screen leases tightly.
- Market conditions: Rents rising (+3.5%/yr); 591 active listings in the ZIP; 8 comparable units currently listed for rent nearby; rentals lingering (median 44d on market — plan ~5-8 weeks vacancy on turnover, expect pricing pressure); 50% of comp listings sitting > 30 days — soft ceiling on asking rent; 964 units permitted in Doña Ana County in 2024 (0 in 5+ unit buildings).
- This rent runs 36% of the median local income ($69k/yr) — at the standard rent-burdened threshold; future hikes will face affordability resistance.
Forward outlook
- Local home prices are declining (-3.0%/yr); year-one equity from $2k of loan paydown is wiped out by about $10k of value loss. Plan a longer hold.
Negotiation context
- It's been on market 31 days — a 3% lower offer ($315k) is reasonable based on typical stale-listing flexibility.
- 3 sale attempts since 6y ago with the ask held roughly flat each time — persistent listings suggest the price (not the market) is what's stuck; bring a comps-based counter.
Questions for the listing agent
- What do current leases actually rent for vs. the listed asking? Can we see a recent rent roll and the last 12 months of T-12 income?
- It's been on market 31 days. Have you received any prior offers? Is the seller open to a 36% concession, seller financing, or rate buy-down credit?
- Is there a deadline driving the sale (1031 exchange, divorce, estate, relocation)? That informs how much negotiation room exists.
- Schools are D-rated, which usually means shorter tenancies and higher turnover. Who's the typical renter profile here, and what's been the actual vacancy rate?
- Crime grade is F in this area — have there been break-ins, vandalism, or insurance claims at this property in the last 3 years? What carrier currently insures it and at what premium?
- The area grade is low — what's the realistic commute time and amenity access for the typical tenant pool here? Any planned neighborhood developments (good or bad) we should know about?
- What's the average days-on-market for RENTAL listings here right now (not sales)? A rising rental-DOM trend means longer vacancies and softer asking-rent achievability than the comps imply.
- What's the recent tenant-quality profile in this submarket — average credit score on applications, eviction rate, late-payment / NSF rate, and stable-employment percentage? A property-management company in the area should have these aggregated.
- How much new for-sale + rental construction is in the pipeline within 1–3 miles? Heavy new supply typically softens prices + rents 12–24 months out; constrained supply supports both.
Investment metrics
- 1% rule
- 0.64% ✗
- Cap rate
- 4.69%
- Cash-on-cash
- -5.74%
- DSCR
- 0.74
- GRM
- 13.0
CMA / ARV
- ARV (median comp)
- $389,593
- List price
- $325,000
- Delta
- -16.58%
- Verdict
- UNDERPRICED
- Comps
- 1 within 2.0 mi
Projected returns pro-forma
-3.0% appreciation · 3.52% rent growth · sell at horizon
- IRR
- -25.6%
- Equity multiple
- 0.13×
- Total profit
- $-79,340
- Equity at exit
- $48,459
- IRR
- -20.8%
- Equity multiple
- -0.10×
- Total profit
- $-100,507
- Equity at exit
- $28,100
Cash invested: $91,000 (down + closing). Projections, not guarantees.
Landlord ↔ Tenant lean methodology
- Overall (STATE)
- 55 Moderately Landlord-Leaning
- State New Mexico
- 55 Moderately Landlord-Leaning · D+3
- County
- — inherits STATE
- City
- — inherits STATE
ZIP-level market 88012
- Home prices YoY
- -26.2%
- Rents YoY
- 3.5%
- Active inventory
- 591
- Price-to-rent
- 13.0×
Monthly cashflow live
- Estimated rent
- $2,081 high interval (Pro) →
- Mortgage (P&I)
- −$1,704
- Tax from tax record
- −$239 /mo · $2,869/yr
- Insurance
- −$135
- HOA
- −$0
- Vacancy / Maint / Mgmt
- −$437
- Net cashflow
- $-435
Break-even live
UW: 25.0% down · 7.5% · 30yr · 1.5% tax · 5.0% vac · 8.0% maint · 8.0% mgmt
Financing live
Cash to close
- Down payment
- $81,250
- Closing costs
- $9,750
- Reserves months
- —
- Total cash needed
- —
Loan-product check · same deal, 3 products live
Conventional
25% down · 7.5% · 30yr
- Down + closing
- —
- Monthly P&I
- —
- Monthly cashflow
- —
- DSCR
- —
- Eligible?
- —
Personal DTI + credit; lowest rate.
DSCR
20% down · 8.5% · 30yr
- Down + closing
- —
- Monthly P&I
- —
- Monthly cashflow
- —
- DSCR
- —
- Eligible?
- —
No personal income docs; deal must DSCR.
Hard money
10% down · 12.0% · 12mo
- Down + closing
- —
- Monthly P&I
- —
- Monthly cashflow
- —
- DSCR
- —
- Eligible?
- —
Short-term bridge; refi at stabilization.
Rent comps 8 comps
| Address | Beds | Baths | Sqft | Rent | $/sqft | DOM | Units | Dist |
|---|---|---|---|---|---|---|---|---|
| 3652 Springhaven Loop Las Cruces, NM | 4.0 | 3.0 | 2126 | $2,500 | $1.18 | 13d | 1 | 0.38mi |
| 3833 Ranchers Rd Las Cruces, NM | 3.0 | 2.0 | 1600 | $2,000 | $1.25 | 43d | 1 | 0.90mi |
| 3575 Sierra del Sol Ave Las Cruces, NM | 3.0 | 2.0 | 1700 | $1,950 | $1.15 | 43d | 1 | 0.93mi |
| 7559 Vista de Oeste Pl Las Cruces, NM | 3.0 | 2.0 | 1234 | $2,000 | $1.62 | 43d | 1 | 1.02mi |
| 7516 Sierra de Oro Pl Las Cruces, NM | 4.0 | 2.0 | 1549 | $1,895 | $1.22 | 13d | 1 | 1.03mi |
| 4942 Sherwood Rd Las Cruces, NM | 3.0 | 2.0 | 1376 | $1,625 | $1.18 | 13d | 1 | 1.13mi |
| 5014 Kenner Way Las Cruces, NM | 3.0 | 2.0 | 1657 | $1,825 | $1.10 | 13d | 1 | 1.22mi |
| 7353 Vista de Sobre Dr Las Cruces, NM | 3.0 | 2.0 | 1506 | $1,895 | $1.26 | 43d | 1 | 1.31mi |
Listing history 21 events
-
2026-06-18days on market $325,000 Active 31 DOM
-
2026-06-17days on market $325,000 Active 30 DOM
-
2026-06-16days on market $325,000 Active 29 DOM
-
2026-06-15days on market $325,000 Active 28 DOM
-
2026-06-14days on market $325,000 Active 26 DOM
-
2026-06-13days on market $325,000 Active 25 DOM
-
2026-06-10days on market $325,000 Active 23 DOM
-
2026-06-09days on market $325,000 Active 22 DOM
-
2026-06-08days on market $325,000 Active 21 DOM
-
2026-06-07days on market $325,000 Active 20 DOM
-
2026-06-02days on market $325,000 Active 15 DOM
-
2026-06-01days on market $325,000 Active 14 DOM
-
2026-05-31days on market $325,000 Active 13 DOM
-
2026-05-30days on market $325,000 Active 12 DOM
-
2026-05-18$325,000 Active 848-char remark
-
2026-05-05historical $325,000 848-char remark
-
2022-05-13soldstatus
-
2022-05-13soldstatus
-
2021-12-30$270,000
-
2020-10-06soldstatus
-
2020-08-16$197,655
ⓘ Source: listings_history table (triggers on properties + properties_extension) + one-shot
backfill from property_details.listing_events for pre-trigger history.
Tax reassessment forecast NM · Resets to sale price
- Current annual tax
- $2,869 · $239/mo
- Projected year-2 tax
- $2,869 · $239/mo
- Expected delta
- $0/yr ($0/mo · -0.0%)
ⓘ Screening estimate from a state-policy table — verify with the county assessor before closing.
Nearby sold comps map
Loading sold comps map…
Walkable amenities ~0.75 mi
Loading nearby amenities…
Taxation est. · year 1
- Rental income
- $24,971
- − Mortgage interest
- −$18,205
- − Property taxes
- −$2,869
- − Insurance
- −$1,625
- − Repairs & maintenance
- −$1,998
- − Management
- −$1,998
- − Depreciation
- −$9,455
- Taxable loss
- −$11,178
- Est. tax savings @ 24.0%
- +$2,683
- After-tax cash flow
- $-2,536/yr
For passive investors: Depreciation is non-cash, so a rental often shows a tax loss while cash-flowing — sheltering income. Rental losses are passive: they offset passive income freely, and up to $25,000/yr can offset ordinary (W-2) income if you actively participate and your MAGI is under $100k (phasing out to $0 by $150k); unused losses carry forward. On sale, claimed depreciation is recaptured at up to 25%, and gains may owe capital-gains tax (a 1031 exchange can defer both). Figures are a year-1 estimate at your 24.0% rate — not tax advice; consult a CPA.
Schools (NCES district)
- District
- Las Cruces Public Schools
- NCES district ID
- 3501500
- Math proficiency
- 42% ▲ 24.00%
- Reading proficiency
- 68% ▲ 35.00%
- Median HH income
- $41,157
- Composite
- 45.98/100
- National rank
- #2535
- State rank
- #5 of 29 in NM
Livability — Las Cruces
- Score
- 59/100
- State rank
- #120
- US rank
- #19687
Category grades
Schools grade is shown separately in the Schools card above.
Census & demographics
- Census place
- Las Cruces, NM
- County
- Dona Ana County · 144,044 people
- City population
- 131,421
- Metro
- Las Cruces, NM
- Population (ZIP)
- 33,158
- Household income
- $69,052
- Rent vs Own
- Severe rent burden
- 717.0
Population outlook (Doña Ana County) Hauer SSP2
- Today (2025)
- 219,177 people
- By 2030
- 220,967 · +0.8%
- By 2040
- 222,775 · +1.6%
- By 2050
- 223,576 · +2.0%
- By 2075
- 228,461 · +4.2%
- By 2100
- 214,536 · -2.1%
Race, ethnicity, and origin ACS 2023
- Neighborhood character
- Majority Hispanic (63%)
- Race & ethnicity
- Hispanic / Latino 63% White 32% Two or more races 25% Native American 2% Black 1% Asian 1%
- Hispanic origin (detail)
- Mexican 55%
- Common ancestry
- Slovak 2% Russian 1% Iranian 1%
- Foreign-born
- 10% · Canada, South Korea
- Languages at home
- 65% English-only · Spanish 33%
Political lean MEDSL · Doña Ana
- 2024 margin
- Lean D (+9.8) · D 53.8% · R 44.0% · Other 2.2%
- 2008→2024 swing
- -7.9pp toward R · 2008: 17.6pp · 2024: 9.8pp
- All cycles
- 2024: D+9.8 2020: D+18.3 2016: D+18.0 2012: D+14.9 2008: D+17.6
Not yet ingested
- Civics
- —
Market trends
- HPI YoY
- ▼ -66.04%
- Current HPI
- 185.7733
- Rent YoY
- ▲ 3.52%
- Metro
- Las Cruces, NM
- State GDP YoY
- —
- F500 in state
- 0
Price history
+64.4% since first listed7 events — show timeline
- 2026-05-18 Listed $325,000 SNMMLS as distributed by MLS GRID
- 2026-05-05 Coming Soon $325,000 SNMMLS as distributed by MLS GRID
- 2022-05-13 Sold (Public Records) — Public Records
- 2022-05-13 Sold (MLS) — SNMMLS as distributed by MLS GRID
- 2021-12-30 Listed $270,000 SNMMLS as distributed by MLS GRID
- 2020-10-06 Sold (MLS) — SNMMLS as distributed by MLS GRID
- 2020-08-16 Listed $197,655 SNMMLS as distributed by MLS GRID
Property tax history
+8.6%/yrLatest (2025): $2,869 · +2.4% YoY. Source: county tax records.
Cash-flow waterfall
monthlySold comps — $/sqft
last 12 mo · ≤1 miLoading sold comps…