 Multi-family
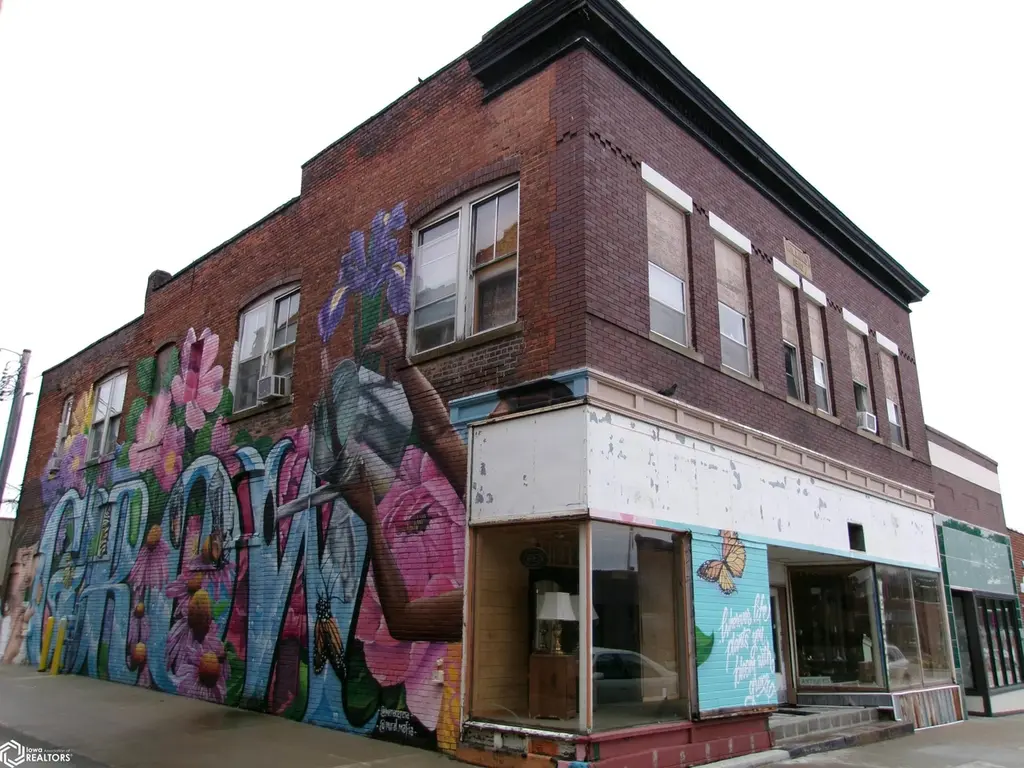
210 W Montgomery St · Creston, IA
Flood risk No data
- FEMA flood zone
- —
- Chance of flooding over 30 yrs
- —
- Est. flood insurance / yr
- —
Fire risk No data
- Est. fire insurance / yr
- —
Heat risk No data
- Hot days now (above threshold)
- —
- Hot days in 30 yrs
- —
Wind risk No data
- Chance of severe wind over 30 yrs
- —
Air-quality risk No data
- Unhealthy air days now
- —
- Unhealthy air days in 30 yrs
- —
Risk factors via First Street. Map © Google.
Why this score? — see what drove the B grade
The composite is a weighted blend of 9 inputs, each scored 0–100. Each bar is that input's sub-score; the figure is the points it added to the 100-point composite (weight × sub-score).
- Cash flow +30.0/30.0
- 1% rule +10.0/10.0
- DSCR +10.0/10.0
- ARV discount +7.5/15.0
- Schools +5.5/10.0
- Livability +4.0/5.0
- Rent growth +2.5/5.0
- Condition / age +2.5/5.0
- Appreciation +0.0/10.0
$89,900
🖨 Deal sheet 📄 Offer letter ✓ Due diligence
Multi-family units
County records classify this as Multi-Family (2-4 Unit). Listing-text estimate: 1 unit. estimate disagrees with records
Listing remarks
Retail business site in the heart of uptown, business with 4 apartments upstairs. Full basement also used for retail. 2 toilet rooms on main floor. Upstairs apartments have 3 fixture baths, kitchenettes, living room/dining room and separate bedrooms. All appliances included. Upstairs does not have central air. Expenses are estimates only. 3 apartments rented for $1300 per month and storefront $500 per month. Landlord pays gas and water.
Key facts
- Separate bedrooms
- Full basement
- 3,049 sq ft lot
Tags
Property features AI
Finance
- Other: Directions: US Hwy 34 (Taylor St) into Creston. North on Elm Street to Montgomery St. Right. Building on south side by alley
- Financial info: Annual tax amount reported
- HOA & community: No association amenities
Exterior
- Parking: On-street parking
- Utilities: Public water; Public sewer
- Home design: Residential income property (quadruplex); 2-story building
- Construction: Brick construction
- Exterior features: Flat rubber roof; Publicly maintained road access; City street frontage; Lot dimensions approximately 40 x 77 (0.07 acres)
Interior
- Heating & cooling: Forced air heating
- Interior features: Basement present; Forced air heating
Neighborhood map
What this means for you Summary
Snapshot
- This is a multifamily listed at $90k.
Deal economics
- At list price, monthly cash flow is $1k ($13k/yr) — positive.
- The deal already cash-flows at list — no discount required.
- Meets the 1% rule at list price ($2k rent vs $90k).
- Cap rate 20.8% vs local median 5.0% in Creston — top-decile yield for the area; either an underpriced asset or a hidden risk that comps aren't pricing in. Stress-test before assuming the spread holds.
Location & tenants
- Location reads 81/100 on livability (#76 in IA, #1,607 nationally) — a professional / high-income tenant draw. Strengths: cost of living A+, housing A+, health & safety A+; Watch: employment C-, amenities F.
- Creston Community School District (town): math 63% / reading 69% proficiency, ranked #195 of 289 in IA (top 68%) — acceptable for families but not a draw, mixed tenant base, ~2y average lease.
- Market conditions: 77 active listings in the ZIP; 5 units permitted in Union County in 2024 (0 in 5+ unit buildings).
Forward outlook
- Local home prices are declining (-3.0%/yr); year-one equity from $622 of loan paydown is wiped out by about $3k of value loss. Plan a longer hold.
- At projected returns (-3.0% appreciation + 3.0% rent growth), your $25k cash investment doubles in ~3 years — after that, you're playing with house money.
Negotiation context
- Only 7 days on market — expect competitive offers; lowballing is unlikely to land.
- 3 sale attempts since 2y ago with the ask held roughly flat each time — persistent listings suggest the price (not the market) is what's stuck; bring a comps-based counter.
Risks & watch-outs
- Watch-outs: built in 1910 — expect roof / HVAC / electrical / plumbing capex.
Questions for the listing agent
- Built in 1910 — when were the roof, HVAC, electrical panel, plumbing, and water heater last replaced?
- Is there a deadline driving the sale (1031 exchange, divorce, estate, relocation)? That informs how much negotiation room exists.
- Schools are B-rated — typically a magnet for longer-tenancy family renters. What's the average tenant stay here, and is there a school-zone premium baked into asking?
- What's the average days-on-market for RENTAL listings here right now (not sales)? A rising rental-DOM trend means longer vacancies and softer asking-rent achievability than the comps imply.
- What's the recent tenant-quality profile in this submarket — average credit score on applications, eviction rate, late-payment / NSF rate, and stable-employment percentage? A property-management company in the area should have these aggregated.
- How much new apartment / multifamily construction is in the pipeline within 1–3 miles? Heavy new supply (>2% of stock underway) typically softens rents 12–24 months out; light construction supports rent growth.
Investment metrics
- 1% rule
- 2.40% ✓
- Cap rate
- 20.76%
- Cash-on-cash
- 51.65%
- DSCR
- 3.30
- GRM
- 3.5
CMA / ARV
No comps found within radius.
Projected returns pro-forma
-3.0% appreciation · 3.0% rent growth · sell at horizon
- IRR
- 49.6%
- Equity multiple
- 3.16×
- Total profit
- $54,476
- Equity at exit
- $13,404
- IRR
- 55.1%
- Equity multiple
- 6.42×
- Total profit
- $136,432
- Equity at exit
- $7,773
Cash invested: $25,172 (down + closing). Projections, not guarantees.
Landlord ↔ Tenant lean methodology
- Overall (STATE)
- 83 Strongly Landlord-Friendly
- State Iowa
- 83 Strongly Landlord-Friendly · R+6
- County
- — inherits STATE
- City
- — inherits STATE
ZIP-level market 50801
- Home prices YoY
- -5.9%
- Active inventory
- 77
- Price-to-rent
- 6.9×
Monthly cashflow live
- Estimated rent
- $2,158 medium interval (Pro) →
- Mortgage (P&I)
- −$471
- Tax est. 1.5%
- −$112 /mo · $1,348/yr
- Insurance
- −$37
- HOA
- −$0
- Vacancy / Maint / Mgmt
- −$453
- Net cashflow
- $1,084
Break-even live
2-unit breakdown (identical units grouped — click to expand)
| Units | Beds | Baths | Est. rent |
|---|---|---|---|
| 2× units | 2 | 1.5 | $2,158 |
| #1 | 2 | 1.5 | $1,079 |
| #2 | 2 | 1.5 | $1,079 |
| Total (2 units) | $2,158 | ||
UW: 25.0% down · 7.5% · 30yr · 1.5% tax · 5.0% vac · 8.0% maint · 8.0% mgmt
Financing live
Cash to close
- Down payment
- $22,475
- Closing costs
- $2,697
- Reserves months
- —
- Total cash needed
- —
Loan-product check · same deal, 3 products live
Conventional
25% down · 7.5% · 30yr
- Down + closing
- —
- Monthly P&I
- —
- Monthly cashflow
- —
- DSCR
- —
- Eligible?
- —
Personal DTI + credit; lowest rate.
DSCR
20% down · 8.5% · 30yr
- Down + closing
- —
- Monthly P&I
- —
- Monthly cashflow
- —
- DSCR
- —
- Eligible?
- —
No personal income docs; deal must DSCR.
Hard money
10% down · 12.0% · 12mo
- Down + closing
- —
- Monthly P&I
- —
- Monthly cashflow
- —
- DSCR
- —
- Eligible?
- —
Short-term bridge; refi at stabilization.
Listing history 7 events
-
2026-06-18days on market $89,900 Active 7 DOM
-
2026-06-17days on market $89,900 Active 6 DOM
-
2026-06-16days on market $89,900 Active 5 DOM
-
2026-06-15days on market $89,900 Active 4 DOM
-
2026-06-13days on market $89,900 Active 2 DOM
-
2026-06-12remarks 440-char remark
-
2026-06-12$89,900 Active 1 DOM
ⓘ Source: listings_history table (triggers on properties + properties_extension) + one-shot
backfill from property_details.listing_events for pre-trigger history.
Nearby sold comps map
Loading sold comps map…
Walkable amenities ~0.75 mi
Loading nearby amenities…
Taxation est. · year 1
- Rental income
- $25,896
- − Mortgage interest
- −$5,036
- − Property taxes
- −$1,348
- − Insurance
- −$450
- − Repairs & maintenance
- −$2,072
- − Management
- −$2,072
- − Depreciation
- −$2,615
- Taxable income
- $12,304
- Est. tax owed @ 24.0%
- −$2,953
- After-tax cash flow
- $10,050/yr
For passive investors: Depreciation is non-cash, so a rental often shows a tax loss while cash-flowing — sheltering income. Rental losses are passive: they offset passive income freely, and up to $25,000/yr can offset ordinary (W-2) income if you actively participate and your MAGI is under $100k (phasing out to $0 by $150k); unused losses carry forward. On sale, claimed depreciation is recaptured at up to 25%, and gains may owe capital-gains tax (a 1031 exchange can defer both). Figures are a year-1 estimate at your 24.0% rate — not tax advice; consult a CPA.
Schools (NCES district)
- District
- Creston Community School District
- NCES district ID
- 1908310
- Math proficiency
- 63% ▬ 0.00%
- Reading proficiency
- 69% ▲ 4.00%
- Median HH income
- $42,292
- Composite
- 55.29/100
- National rank
- #1263
- State rank
- #195 of 289 in IA
Livability — Creston
- Score
- 81/100
- State rank
- #76
- US rank
- #1607
Category grades
Schools grade is shown separately in the Schools card above.
Census & demographics
- Census place
- Creston, IA
- Population (ZIP)
- 9,027
Population outlook (Union County) Hauer SSP2
- Today (2025)
- 12,536 people
- By 2030
- 12,561 · +0.2%
- By 2040
- 12,583 · +0.4%
- By 2050
- 12,543 · +0.1%
- By 2075
- 12,816 · +2.2%
- By 2100
- 12,754 · +1.7%
Race, ethnicity, and origin ACS 2023
- Neighborhood character
- Predominantly White (94%)
- Race & ethnicity
- White 94% Two or more races 3% Hispanic / Latino 2%
- Common ancestry
- Romanian 3% Slovak 2% Portuguese 2%
- Foreign-born
- 0%
- Languages at home
- 98% English-only · Spanish 1% German/W. Germanic 1%
Political lean MEDSL · Union
- 2024 margin
- Solid R (+36.2) · D 31.2% · R 67.4% · Other 1.3%
- 2008→2024 swing
- -39.9pp toward R · 2008: 3.7pp · 2024: -36.2pp
- All cycles
- 2024: R+36.2 2020: R+31.5 2016: R+27.8 2012: D+3.9 2008: D+3.7
Not yet ingested
- Civics
- —
Market trends
- HPI YoY
- ▼ -13.71%
- Current HPI
- 217.2057
- Rent YoY
- —
- Metro
- —
- State GDP YoY
- ▲ 2.48%
- F500 in state
- 4
Industry mix (Fortune 500 HQ in IA)
| Industry | F500 HQs | Revenue |
|---|---|---|
| Financial Services | 1 | $16B |
|
||
| Retail / Convenience | 1 | $15B |
|
||
Price history
+0.0% since first listed4 events — show timeline
- 2026-06-11 Listed $89,900 IAR
- 2025-04-23 Relisted — IAR
- 2025-01-09 Contingent — IAR
- 2024-11-05 Listed $89,900 IAR
Cash-flow waterfall
monthlySold comps — $/sqft
last 12 mo · ≤1 miLoading sold comps…