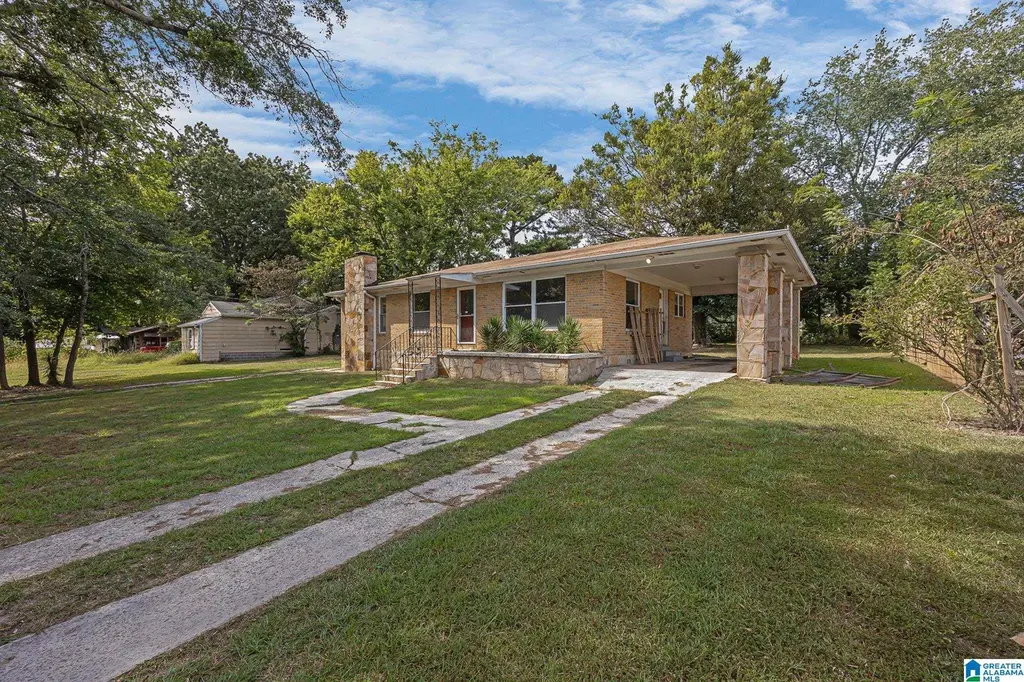
4 21st Ave NW · Center Point, AL
Flood risk 1/10 · Minimal
- FEMA flood zone
- X (unshaded)
- Chance of flooding over 30 yrs
- 0.0%
- Est. flood insurance / yr
- $507 – $1,088
Fire risk 1/10 · Minimal
- Est. fire insurance / yr
- $916 – $1,700
Heat risk 6/10 · Moderate
- Hot days now (above 106°F)
- 7 days/yr
- Hot days in 30 yrs
- 19 days/yr
Wind risk 6/10 · Moderate
- Chance of severe wind over 30 yrs
- 27.0%
Air-quality risk 5/10 · Moderate
- Unhealthy air days now
- 7 days/yr
- Unhealthy air days in 30 yrs
- 9 days/yr
Risk factors via First Street. Map © Google.
Why this score? — see what drove the B- grade
The composite is a weighted blend of 9 inputs, each scored 0–100. Each bar is that input's sub-score; the figure is the points it added to the 100-point composite (weight × sub-score).
- Cash flow +26.4/30.0
- ARV discount +15.0/15.0
- DSCR +9.0/10.0
- 1% rule +7.4/10.0
- Rent growth +3.3/5.0
- Livability +3.2/5.0
- Condition / age +2.5/5.0
- Schools +1.8/10.0
- Appreciation +0.0/10.0
$99,900
🖨 Deal sheet 📄 Offer letter ✓ Due diligence
Listing remarks MLS
Welcome to 4 21st Ave NW — a quaint, all-brick single-level home nestled in the heart of Center Point. With approximately 1,188 square feet, this residence offers three cozy bedrooms and a functional layout that’s full of promise. This home has been meticulously maintained and presents a clean, inviting canvas for your personal touches and design vision. Set in a friendly, low-traffic neighborhood with convenient access to local schools, shopping, and routes into downtown Birmingham, this home is ready to reward both growing families and savvy investors. With some thoughtful updates, it’s poised to shine. Don't miss out on this classic charmer in a welcoming community!
Key facts
- Single level
- Convenient access
- All brick
Tags
Neighborhood map
What this means for you Summary
Snapshot
- This is a 3-bed/2.0-bath single-family listed at $100k.
Deal economics
- At list price, monthly cash flow is $261 ($3k/yr) — positive.
- The deal already cash-flows at list — no discount required.
- Meets the 1% rule at list price ($1k rent vs $100k).
- Recommended offer: $97k (3.0% below list) — sets the bar for market timing.
- Cap rate 9.4% vs local median 7.3% in Center Point — meaningfully above typical; check what's discounted (condition, days-on-market, listing class) to confirm the premium yield is real.
Location & tenants
- Location reads 63/100 on livability (#193 in AL) — a middle-class / working-renter tenant base. Strengths: cost of living A+, commute A, housing A; Watch: crime D, schools F, amenities F.
- Jefferson County (suburban): math 9% / reading 32% proficiency, ranked #104 of 129 in AL (top 81%) — low school quality limits family demand, transient renter base, plan for 1-2y turnover.
- Market conditions: Rents rising (+3.0%/yr); 334 active listings in the ZIP; 40 comparable units currently listed for rent nearby; rentals at typical pace (median 24d on market — plan ~3-4 weeks tenant-placement turnaround); 40% of comp listings sitting > 30 days — soft ceiling on asking rent; 2,114 units permitted in Jefferson County in 2024 (556 in 5+ unit buildings).
Forward outlook
- Local home prices are declining (-3.0%/yr); year-one equity from $691 of loan paydown is wiped out by about $3k of value loss. Plan a longer hold.
- Jefferson County population projected to shrink 4% by 2050 — rents likely to lag national; underwrite the cash flow, not the appreciation.
- At projected returns (-3.0% appreciation + 3.0% rent growth), your $28k cash investment doubles in ~10 years — after that, you're playing with house money.
Negotiation context
- It's been on market 51 days — a 3% lower offer ($97k) is reasonable based on typical stale-listing flexibility.
- Current owner paid $45k; list at $100k implies a 122% gain — meaningful room to come down on a strong offer.
Risks & watch-outs
- Watch-outs: built in 1956 — expect roof / HVAC / electrical / plumbing capex.
- Climate carrying-cost: major wind risk, 27% chance of damaging wind over 30y; extreme-heat days projected 7→19/yr by 2055 (HVAC capex compounding) — expect insurance premiums to compound above CPI over the hold.
Questions for the listing agent
- It's been on market 51 days. Have you received any prior offers? Is the seller open to a 3% concession, seller financing, or rate buy-down credit?
- Built in 1956 — when were the roof, HVAC, electrical panel, plumbing, and water heater last replaced?
- Is there a deadline driving the sale (1031 exchange, divorce, estate, relocation)? That informs how much negotiation room exists.
- Schools are F-rated, which usually means shorter tenancies and higher turnover. Who's the typical renter profile here, and what's been the actual vacancy rate?
- Crime grade is D in this area — have there been break-ins, vandalism, or insurance claims at this property in the last 3 years? What carrier currently insures it and at what premium?
- What's the average days-on-market for RENTAL listings here right now (not sales)? A rising rental-DOM trend means longer vacancies and softer asking-rent achievability than the comps imply.
- What's the recent tenant-quality profile in this submarket — average credit score on applications, eviction rate, late-payment / NSF rate, and stable-employment percentage? A property-management company in the area should have these aggregated.
- How much new for-sale + rental construction is in the pipeline within 1–3 miles? Heavy new supply typically softens prices + rents 12–24 months out; constrained supply supports both.
Investment metrics
- 1% rule
- 1.24% ✓
- Cap rate
- 9.43%
- Cash-on-cash
- 11.19%
- DSCR
- 1.50
- GRM
- 6.7
CMA / ARV
- ARV (median comp)
- $137,966
- List price
- $99,900
- Delta
- -27.59%
- Verdict
- UNDERPRICED
- Comps
- 20 within 1.0 mi
Show comp detail 12 sales within ~0.75 mi
| Address | Dist | Beds/Ba | Sqft | Sold | Price | $/sf | Match |
|---|---|---|---|---|---|---|---|
| 5 21st Ct NW | 0.03mi | 2/1.0 (-1) | 1,245 (+5%) | 6mo | $52,000 | $42 | 77 |
| 112 19th Ave NW | 0.33mi | 3/1.5 | 1,142 (-4%) | 2mo | $108,500 | $95 | 75 |
| 1924 2nd Pl NW | 0.38mi | 3/1.0 | 1,120 (-6%) | 4mo | $55,000 | $49 | 65 |
| 2245 3rd St NE | 0.49mi | 3/1.0 | 1,150 (-3%) | 5mo | $88,000 | $77 | 64 |
| 217 23rd Ter NW | 0.61mi | 3/1.5 | 1,232 (+4%) | 4mo | $86,000 | $70 | 60 |
| 2352 3rd Way NE | 0.71mi | 3/1.5 | 1,167 (-2%) | 4mo | $103,000 | $88 | 59 |
| 217 22nd Ave NE | 0.32mi | 4/2.0 (+1) | 1,327 (+12%) | 7mo | $138,000 | $104 | 54 |
| 1720 2nd St NE | 0.62mi | 3/1.5 | 1,099 (-8%) | 4mo | $65,000 | $59 | 53 |
| 1628 1st St NW | 0.69mi | 3/1.0 | 1,124 (-5%) | 7mo | $79,900 | $71 | 49 |
| 101 23rd Ter NW | 0.53mi | 3/1.0 | 1,049 (-12%) | 5mo | $114,000 | $109 | 48 |
| 1640 1st St NE | 0.70mi | 3/1.0 | 1,090 (-8%) | 4mo | $105,000 | $96 | 46 |
| 2332 3rd St NW | 0.66mi | 3/1.0 | 1,336 (+12%) | 3mo | $110,000 | $82 | 42 |
Match score weights: distance 35% · size 25% · config 20% · recency 20%. Top-matched comps best support the ARV.
Projected returns pro-forma
-3.0% appreciation · 3.04% rent growth · sell at horizon
- IRR
- 0.5%
- Equity multiple
- 1.02×
- Total profit
- $514
- Equity at exit
- $14,895
- IRR
- 10.2%
- Equity multiple
- 1.79×
- Total profit
- $22,188
- Equity at exit
- $8,638
Cash invested: $27,972 (down + closing). Projections, not guarantees.
Landlord ↔ Tenant lean methodology
- Overall (STATE)
- 90 Strongly Landlord-Friendly
- State Alabama
- 90 Strongly Landlord-Friendly · R+15
- County
- — inherits STATE
- City
- — inherits STATE
ZIP-level market 35215
- Home prices YoY
- -34.4%
- Rents YoY
- 3.0%
- Active inventory
- 334
- Price-to-rent
- 6.7×
Monthly cashflow live
- Estimated rent
- $1,235 high interval (Pro) →
- Mortgage (P&I)
- −$524
- Tax from tax record
- −$150 /mo · $1,794/yr
- Insurance
- −$42
- HOA
- −$0
- Vacancy / Maint / Mgmt
- −$259
- Net cashflow
- $261
Break-even live
UW: 25.0% down · 7.5% · 30yr · 1.5% tax · 5.0% vac · 8.0% maint · 8.0% mgmt
Financing live
Cash to close
- Down payment
- $24,975
- Closing costs
- $2,997
- Reserves months
- —
- Total cash needed
- —
Loan-product check · same deal, 3 products live
Conventional
25% down · 7.5% · 30yr
- Down + closing
- —
- Monthly P&I
- —
- Monthly cashflow
- —
- DSCR
- —
- Eligible?
- —
Personal DTI + credit; lowest rate.
DSCR
20% down · 8.5% · 30yr
- Down + closing
- —
- Monthly P&I
- —
- Monthly cashflow
- —
- DSCR
- —
- Eligible?
- —
No personal income docs; deal must DSCR.
Hard money
10% down · 12.0% · 12mo
- Down + closing
- —
- Monthly P&I
- —
- Monthly cashflow
- —
- DSCR
- —
- Eligible?
- —
Short-term bridge; refi at stabilization.
Rent comps 40 comps
| Address | Beds | Baths | Sqft | Rent | $/sqft | DOM | Units | Dist |
|---|---|---|---|---|---|---|---|---|
| 124 21st Ave NE Unit 202 Center Point, AL | 2.0 | 1.0 | 830 | $750 | $0.90 | 16d | 1 | 0.24mi |
| 123 21st Ave NE Center Point, AL | 2.0 | 1.0 | 850 | $800 | $0.94 | 44d | 1 | 0.24mi |
| 107 Sterling Ct NW Center Point, AL | 2.0 | 1.5–2.0 | 1026 | $1,062 | $1.04 | 3d | 4 | 0.28mi |
| 1905 2nd St NW Center Point, AL | 3.0 | 1.0 | 1258 | $1,395 | $1.11 | 44d | 1 | 0.34mi |
| 2318 Raintree Ct Center Point, AL | 2.0 | 1.0 | 975 | $1,100 | $1.13 | 2d | 2 | 0.36mi |
| 113 19th Ave NW Center Point, AL | 3.0 | 2.0 | 1407 | $1,250 | $0.89 | 11d | 1 | 0.37mi |
| 2229 3rd St NE Center Point, AL | 3.0 | 1.0 | 1215 | $1,125 | $0.93 | 23d | 1 | 0.44mi |
| 2245 3rd St NW Center Point, AL | 3.0 | 1.0 | 1156 | $1,100 | $0.95 | 23d | 1 | 0.48mi |
| 2245 3rd St NE Center Point, AL | 3.0 | 1.0 | 1150 | $1,100 | $0.96 | 23d | 1 | 0.48mi |
| 305 18th Ct NW Center Point, AL | 3.0 | 1.5 | 1270 | $1,100 | $0.87 | 44d | 1 | 0.50mi |
| 424 Tupelo Way Center Point, AL | 4.0 | 2.0 | 1233 | $1,300 | $1.05 | 44d | 1 | 0.53mi |
| 319 23rd Ave NW Center Point, AL | 3.0 | 2.0 | 1284 | $1,395 | $1.09 | 44d | 1 | 0.53mi |
| 109 24th Ave NW Center Point, AL | 3.0 | 1.5 | 1023 | $1,215 | $1.19 | 44d | 1 | 0.57mi |
| 401 22nd Ave NE Center Point, AL | 2.0 | 1.5 | 850 | $745 | $0.88 | 16d | 1 | 0.57mi |
| 2109 Whetstone Ct Center Point, AL | 2.0 | 1.5 | 800 | $675 | $0.84 | 3d | 1 | 0.58mi |
| 2324 3rd St NE Center Point, AL | 3.0 | 2.0 | 1329 | $1,300 | $0.98 | 23d | 1 | 0.59mi |
| 1720 2nd St NE Center Point, AL | 3.0 | 2.0 | 1100 | $1,400 | $1.27 | 44d | 1 | 0.65mi |
| 405 18th Ave NW Center Point, AL | 3.0 | 2.0 | 1162 | $1,299 | $1.12 | 44d | 1 | 0.66mi |
| 332 23rd Ave NE Center Point, AL | 3.0 | 1.0 | 1100 | $1,350 | $1.23 | 3d | 1 | 0.66mi |
| 2323 4th St NW Center Point, AL | 3.0 | 1.0 | 1038 | $1,305 | $1.26 | 3d | 1 | 0.69mi |
| 1629 1st St NW Center Point, AL | 3.0 | 1.0 | 900 | $1,025 | $1.14 | 23d | 1 | 0.71mi |
| 1628 1st St NW Center Point, AL | 3.0 | 1.0 | 1124 | $1,150 | $1.02 | 44d | 1 | 0.71mi |
| 2320 5th St NW Center Point, AL | 3.0 | 1.0 | 1098 | $1,150 | $1.05 | 44d | 1 | 0.76mi |
| 1628 1st St NE Center Point, AL | 3.0 | 1.0 | 1027 | $1,165 | $1.13 | 44d | 1 | 0.78mi |
| 2249 4th Place Cir NE Center Point, AL | 3.0 | 1.5 | 1400 | $1,400 | $1.00 | 44d | 1 | 0.80mi |
| 1712 4th Pl NW Center Point, AL | 3.0 | 1.0 | 1182 | $1,150 | $0.97 | 23d | 1 | 0.82mi |
| 1700 4th Pl NW Center Point, AL | 3.0 | 1.0 | 914 | $1,075 | $1.18 | 23d | 1 | 0.82mi |
| 509 20th Ave NE Center Point, AL | 3.0 | 1.5 | 1008 | $1,200 | $1.19 | 23d | 1 | 0.88mi |
| 2412 4th St NW Center Point, AL | 3.0 | 1.0 | 1224 | $1,150 | $0.94 | 16d | 1 | 0.90mi |
| 1617 3rd Pl NW Center Point, AL | 3.0 | 2.0 | 1404 | $1,150 | $0.82 | 23d | 1 | 0.91mi |
| 2416 4th St NW Center Point, AL | 4.0 | 2.0 | 1400 | $1,500 | $1.07 | 23d | 1 | 0.92mi |
| 408 Sunhill Rd NW Center Point, AL | 3.0 | 1.5 | 1290 | $1,355 | $1.05 | 44d | 1 | 0.96mi |
| 127 Fox Hill Ct Center Point, AL | 3.0 | 2.0 | 1418 | $1,545 | $1.09 | 44d | 1 | 0.97mi |
| 2537 3rd St NE Center Point, AL | 3.0 | 2.0 | 1040 | $1,350 | $1.30 | 23d | 1 | 0.98mi |
| 2629 Wood Dr NE Center Point, AL | 3.0 | 1.0 | 1203 | $1,250 | $1.04 | 44d | 1 | 0.98mi |
| 1732 6th St NW Center Point, AL | 3.0 | 1.5 | 1300 | $1,250 | $0.96 | 3d | 1 | 1.02mi |
| 1541 Charter East Cir NE Birmingham, AL | 1.0–2.0 | 1.0–1.5 | 807 | $1,095 | $1.36 | 2d | 8 | 1.04mi |
| 1827 Carson Rd Unit 1 Birmingham, AL | 3.0 | 2.5 | 1332 | $1,125 | $0.84 | 44d | 1 | 1.04mi |
| 1827 Carson Rd Unit 7 Birmingham, AL | 3.0 | 2.5 | 1332 | $950 | $0.71 | 23d | 1 | 1.05mi |
| 1821 Carson Rd Unit 3 Birmingham, AL | 2.0 | 1.5 | 800 | $580 | $0.72 | 21d | 1 | 1.06mi |
Listing history 4 events
-
2026-04-01$99,900 Active 695-char remark
Show marketing remark (695 chars)
Welcome to 4 21st Ave NW — a quaint, all-brick single-level home nestled in the heart of Center Point. With approximately 1,188 square feet, this residence offers three cozy bedrooms and a functional layout that’s full of promise. This home has been meticulously maintained and presents a clean, inviting canvas for your personal touches and design vision. Set in a friendly, low-traffic neighborhood with convenient access to local schools, shopping, and routes into downtown Birmingham, this home is ready to reward both growing families and savvy investors. With some thoughtful updates, it’s poised to shine. Don't miss out on this classic charmer in a welcoming community!
-
2025-10-30price $125,000
-
2003-02-05soldstatus $45,000
-
1997-08-19soldstatus $21,000
ⓘ Source: listings_history table (triggers on properties + properties_extension) + one-shot
backfill from property_details.listing_events for pre-trigger history.
Tax reassessment forecast AL · Resets to sale price
- Current annual tax
- $1,794 · $150/mo
- Projected year-2 tax
- $1,794 · $150/mo
- Expected delta
- $0/yr ($0/mo · -0.0%)
ⓘ Screening estimate from a state-policy table — verify with the county assessor before closing.
Climate risk First Street
- Flood 1/10 Low FEMA zone X (unshaded) · 0% chance over 30 yrs
- Wildfire 1/10 Low
- Heat 6/10 Major 7 d/yr ≥106°F today · 19 d/yr by 30 yrs out
- Wind 6/10 Major 27% chance of damaging wind over 30 yrs
- Air quality 5/10 Major 7 unhealthy d/yr today · 9 by 30 yrs out
Nearby sold comps map
Loading sold comps map…
Walkable amenities ~0.75 mi
Loading nearby amenities…
Taxation est. · year 1
- Rental income
- $14,824
- − Mortgage interest
- −$5,596
- − Property taxes
- −$1,794
- − Insurance
- −$500
- − Repairs & maintenance
- −$1,186
- − Management
- −$1,186
- − Depreciation
- −$2,906
- Taxable income
- $1,657
- Est. tax owed @ 24.0%
- −$398
- After-tax cash flow
- $2,733/yr
For passive investors: Depreciation is non-cash, so a rental often shows a tax loss while cash-flowing — sheltering income. Rental losses are passive: they offset passive income freely, and up to $25,000/yr can offset ordinary (W-2) income if you actively participate and your MAGI is under $100k (phasing out to $0 by $150k); unused losses carry forward. On sale, claimed depreciation is recaptured at up to 25%, and gains may owe capital-gains tax (a 1031 exchange can defer both). Figures are a year-1 estimate at your 24.0% rate — not tax advice; consult a CPA.
Schools (NCES district)
- District
- Jefferson County
- NCES district ID
- 0101920
- Math proficiency
- 9% ▼ -24.00%
- Reading proficiency
- 32% ▼ -5.00%
- Median HH income
- $51,712
- Composite
- 18.4/100
- National rank
- #8937
- State rank
- #104 of 129 in AL
Livability — Center Point
- Score
- 63/100
- State rank
- #193
- US rank
- #15671
Category grades
Schools grade is shown separately in the Schools card above.
Census & demographics
- Census place
- Center Point, AL
- County
- Jefferson County · 527,445 people
- City population
- 43,903
- Metro
- Birmingham-Hoover, AL
- Population (ZIP)
- 43,903
- Household income
- $52,793
- Rent vs Own
- Severe rent burden
- 1729.0
Population outlook (Jefferson County) Hauer SSP2
- Today (2025)
- 669,185 people
- By 2030
- 669,694 · +0.1%
- By 2040
- 661,388 · -1.2%
- By 2050
- 643,086 · -3.9%
- By 2075
- 577,267 · -13.7%
- By 2100
- 474,758 · -29.1%
Race, ethnicity, and origin ACS 2023
- Neighborhood character
- Predominantly Black (75%)
- Race & ethnicity
- Black 75% White 15% Hispanic / Latino 7% Two or more races 3%
- Hispanic origin (detail)
- Mexican 4%
- Common ancestry
- Lithuanian 1% Italian 1% Slovak 1%
- Foreign-born
- 4% · Canada
- Languages at home
- 92% English-only · Spanish 7%
Political lean MEDSL · Jefferson
- 2024 margin
- D (+10.4) · D 54.6% · R 44.2% · Other 1.2%
- 2008→2024 swing
- +5.4pp toward D · 2008: 5.1pp · 2024: 10.4pp
- All cycles
- 2024: D+10.4 2020: D+13.2 2016: D+7.2 2012: D+6.0 2008: D+5.1
Not yet ingested
- Civics
- —
Market trends
- HPI YoY
- ▼ -112.97%
- Current HPI
- 215.0607
- Rent YoY
- ▲ 3.04%
- Metro
- Birmingham-Hoover, AL
- State GDP YoY
- ▲ 2.94%
- F500 in state
- 4
Industry mix (Fortune 500 HQ in AL)
| Industry | F500 HQs | Revenue |
|---|---|---|
| Financial Services | 1 | $8B |
|
||
| Healthcare | 1 | $5B |
|
||
Price history
+375.7% since first listed4 events — show timeline
- 2026-04-01 Listed $99,900 Greater Alabama MLS
- 2025-10-30 Price Changed $125,000 Greater Alabama MLS
- 2003-02-05 Sold (Public Records) $45,000 Public Records
- 1997-08-19 Sold (Public Records) $21,000 Public Records
Property tax history
+2.5%/yrLatest (2025): $1,794 · +7.0% YoY. Source: county tax records.
Cash-flow waterfall
monthlySold comps — $/sqft
last 12 mo · ≤1 miLoading sold comps…