88 Wild Turkey Cir · Salem, PA
Flood risk 1/10 · Minimal
- FEMA flood zone
- X (unshaded)
- Chance of flooding over 30 yrs
- 0.0%
- Est. flood insurance / yr
- $473 – $860
Fire risk 1/10 · Minimal
- Est. fire insurance / yr
- $511 – $949
Heat risk 2/10 · Minimal
- Hot days now (above 91°F)
- 7 days/yr
- Hot days in 30 yrs
- 15 days/yr
Wind risk 3/10 · Minor
- Chance of severe wind over 30 yrs
- 4.0%
Air-quality risk 2/10 · Minimal
- Unhealthy air days now
- 1 days/yr
- Unhealthy air days in 30 yrs
- 2 days/yr
Risk factors via First Street. Map © Google.
Why this score? — see what drove the F grade
The composite is a weighted blend of 9 inputs, each scored 0–100. Each bar is that input's sub-score; the figure is the points it added to the 100-point composite (weight × sub-score).
- Appreciation +10.0/10.0
- Cash flow +7.3/30.0
- Schools +4.4/10.0
- Rent growth +2.5/5.0
- Livability +2.5/5.0
- Condition / age +2.5/5.0
- 1% rule +1.6/10.0
- DSCR +1.5/10.0
- ARV discount +0.0/15.0
$350,000
🖨 Deal sheet (PDF) 📄 Offer letter ✓ Due diligence
Listing remarks
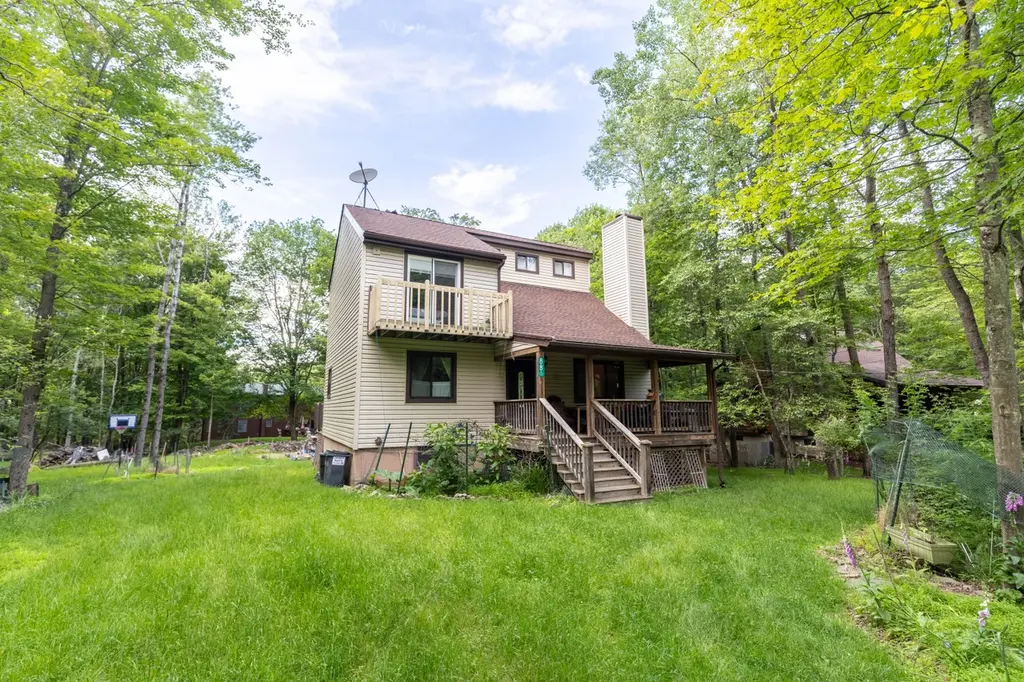
Welcome to this charming, fully furnished 3-bedroom plus a bonus room, 2-bath home in the desirable Indian Rocks community! Nestled among the trees and offering ultimate privacy, this home combines warmth, character, and modern living. Step inside to be greeted by soaring cathedral ceilings and an inviting open-concept layout anchored by a cozy wood-burning fireplace. Beautiful hardwood floors flow throughout the main living space, and the first-floor bedroom offers convenient flexibility for guests or a home office. Upstairs, you'll find three more generously sized bedrooms. Enjoy peaceful mornings on the covered front porch or entertain on the spacious back deck overlooking your garden ar
Key facts
- Covered front porch
- Spacious back deck
- Garden area
Tags
Property features AI
Finance
- Other: Private maintained road (unimproved surface and frontage)
- HOA & community: Homeowners association with annual fee (approximately $1,100); Community amenities include security, clubhouse, tennis courts, and pool
Exterior
- Parking: Open parking for 4 vehicles
- Utilities: Well water; Septic system (septic tank and mound septic)
- Home design: Single-family house; Recreational current use; Residential zoning
- Construction: Vinyl siding; Asphalt shingle roof; Built as a house
- Exterior features: Front covered porch; Gas grill
Interior
- Kitchen: Cooktop; Refrigerator; Dishwasher
- Flooring: Hardwood
- Bathrooms: 2 full bathrooms
- Heating & cooling: Baseboard heating; Electric heating; No central air
- Interior features: Cathedral ceilings; Wood-burning fireplace (1)
- Laundry & utility: Washer and Dryer; Laundry in basement
Neighborhood map
What this means for you Summary
Snapshot
- This is a 3-bed/2.0-bath single-family listed at $350k.
Deal economics
- At list price, monthly cash flow is $-465 ($-6k/yr) — negative.
- To cash-flow at today's rent, offer at most $268k (23.5% below list).
- To meet the 1% rule (rent ≥ 1% of price), the offer needs to be $230k (34.3% below list).
- Recommended offer: $230k (34.3% below list) — sets the bar for 1% rule.
Location & tenants
- Location reads: area grade F — affects rentability + tenant quality, not the cash-flow math above.
- Western Wayne SD (rural): math 39% / reading 63% proficiency, ranked #165 of 539 in PA (top 31%) — acceptable for families but not a draw, mixed tenant base, ~2y average lease.
- Zoned schools: Evergreen El Sch (math 42% / reading 68%, grade C, #498 of 1,518 statewide, top 33%, 506 students, 64% FRL); Western Wayne Ms (math 21% / reading 61%, grade F, #243 of 512 statewide, top 48%, 411 students, 57% FRL); Western Wayne Hs (math 77% / reading 24%, grade D+, #125 of 437 statewide, top 30%, 545 students, 49% FRL) — zoned schools average 56% FRL vs 41% district-wide (16 pts higher); higher-poverty schools than district average — tighter screening recommended.
- Market conditions: 341 active listings in the ZIP; 1 comparable units currently listed for rent nearby; 177 units permitted in Wayne County in 2024 (0 in 5+ unit buildings).
Forward outlook
- In year one you build about $37k of equity ($2k loan paydown + $35k appreciation (10.0% local appreciation)).
- Wayne County population projected at -17% by 2050 — secular population decline; favor cash flow + early exit over multi-decade hold.
- By year 2, paydown + projected appreciation supports a ~$60k cash-out refi (75% LTV) — recoverable capital for the next deal without selling this one.
Negotiation context
- Only 14 days on market — expect competitive offers; lowballing is unlikely to land.
- 2 sale attempts with the ask held roughly flat each time — persistent listings suggest the price (not the market) is what's stuck; bring a comps-based counter.
- Current owner paid $20k; list at $350k implies a 1650% gain — meaningful room to come down on a strong offer.
Questions for the listing agent
- What do current leases actually rent for vs. the listed asking? Can we see a recent rent roll and the last 12 months of T-12 income?
- What does the HOA fee cover, when was the last increase, and are there any pending special assessments or reserve-fund shortfalls?
- Is there a deadline driving the sale (1031 exchange, divorce, estate, relocation)? That informs how much negotiation room exists.
- The area grade is low — what's the realistic commute time and amenity access for the typical tenant pool here? Any planned neighborhood developments (good or bad) we should know about?
- What's the average days-on-market for RENTAL listings here right now (not sales)? A rising rental-DOM trend means longer vacancies and softer asking-rent achievability than the comps imply.
- What's the recent tenant-quality profile in this submarket — average credit score on applications, eviction rate, late-payment / NSF rate, and stable-employment percentage? A property-management company in the area should have these aggregated.
- How much new for-sale + rental construction is in the pipeline within 1–3 miles? Heavy new supply typically softens prices + rents 12–24 months out; constrained supply supports both.
Investment metrics
- 1% rule
- 0.66% ✗
- Cap rate
- 4.70%
- Cash-on-cash
- -5.70%
- DSCR
- 0.75
- GRM
- 12.7
CMA / ARV
- ARV (on-the-fly)
- $262,506
- Comps found
- 4
Show comp detail 4 sales within ~0.75 mi
| Address | Dist | Beds/Ba | Sqft | Sold | Price | $/sf | Match |
|---|---|---|---|---|---|---|---|
| 40 Honey Bear Rd | 0.49mi | 3/2.0 | 1,296 (-1%) | 11mo | $269,900 | $208 | 67 |
| 29 Black Bear Rd | 0.54mi | 3/1.5 | 1,354 (+4%) | 12mo | $255,000 | $188 | 57 |
| 9 Aries Mew | 0.70mi | 3/2.0 | 1,242 (-5%) | 16mo | $250,000 | $201 | 45 |
| 15 Cancer Mew | 0.67mi | 2/2.0 (-1) | 1,117 (-14%) | 20mo | $215,000 | $192 | 23 |
Match score weights: distance 35% · size 25% · config 20% · recency 20%. Top-matched comps best support the ARV.
Projected returns pro-forma
10.0% appreciation · 3.0% rent growth · sell at horizon
- IRR
- 20.2%
- Equity multiple
- 2.64×
- Total profit
- $160,947
- Equity at exit
- $315,308
- IRR
- 18.5%
- Equity multiple
- 6.07×
- Total profit
- $497,160
- Equity at exit
- $679,973
Cash invested: $98,000 (down + closing). Projections, not guarantees.
Landlord ↔ Tenant lean methodology
- Overall (STATE)
- 62 Landlord-Friendly
- State Pennsylvania
- 62 Landlord-Friendly · EVEN
- County
- — inherits STATE
- City
- — inherits STATE
ZIP-level market 18436
- Home prices YoY
- 16.9%
- Active inventory
- 341
- Price-to-rent
- 12.7×
Monthly cashflow live
- Estimated rent
- $2,300 medium interval (Pro) →
- Mortgage (P&I)
- −$1,835
- Tax from tax record
- −$209 /mo · $2,506/yr
- Insurance
- −$146
- HOA
- −$92
- Vacancy / Maint / Mgmt
- −$483
- Net cashflow
- $-465
Break-even live
Sensitivity live
| Price | -10% $-267 | -5% $-366 | +0% $-465 | +5% $-564 | +10% $-663 |
|---|---|---|---|---|---|
| Rent | -10% $-647 | -5% $-556 | +0% $-465 | +5% $-374 | +10% $-283 |
| Rate | -1.0pp $-289 | -0.5pp $-376 | base $-465 | +0.5pp $-556 | +1.0pp $-648 |
UW: 25.0% down · 7.5% · 30yr · 1.5% tax · 5.0% vac · 8.0% maint · 8.0% mgmt
Financing live
Cash to close
- Down payment
- $87,500
- Closing costs
- $10,500
- Reserves months
- —
- Total cash needed
- —
Loan-product check · same deal, 3 products live
Conventional
25% down · 7.5% · 30yr
- Down + closing
- —
- Monthly P&I
- —
- Monthly cashflow
- —
- DSCR
- —
- Eligible?
- —
Personal DTI + credit; lowest rate.
DSCR
20% down · 8.5% · 30yr
- Down + closing
- —
- Monthly P&I
- —
- Monthly cashflow
- —
- DSCR
- —
- Eligible?
- —
No personal income docs; deal must DSCR.
Hard money
10% down · 12.0% · 12mo
- Down + closing
- —
- Monthly P&I
- —
- Monthly cashflow
- —
- DSCR
- —
- Eligible?
- —
Short-term bridge; refi at stabilization.
Rent comps 1 comps
| Address | Beds | Baths | Sqft | Rent | $/sqft | DOM | Units | Dist |
|---|---|---|---|---|---|---|---|---|
| 12 Dogwood Ln Lake Ariel, PA | 3.0 | 2.0 | 1832 | $2,300 | $1.26 | 15d | 1 | 0.51mi |
HOA detail
- Monthly dues
- $92 · $1,104/yr
Listing history 11 events
-
2026-06-21days on market $350,000 Active 14 DOM
-
2026-06-18days on market $350,000 Active 11 DOM
-
2026-06-17days on market $350,000 Active 10 DOM
-
2026-06-16days on market $350,000 Active 9 DOM
-
2026-06-15days on market $350,000 Active 8 DOM
-
2026-06-14days on market $350,000 Active 6 DOM
-
2026-06-13days on market $350,000 Active 5 DOM
-
2026-06-10days on market $350,000 Active 3 DOM
-
2026-06-09days on market $350,000 Active 2 DOM
-
2026-06-07remarks 699-char remark
-
2026-06-07$350,000 Active 1 DOM
ⓘ Source: listings_history table (triggers on properties + properties_extension) + one-shot
backfill from property_details.listing_events for pre-trigger history.
Tax reassessment forecast PA · Partial reset (capped growth)
- Current annual tax
- $2,506 · $209/mo
- Projected year-2 tax
- $4,018 · $335/mo
- Expected delta
- +$1,512/yr (+$126/mo · 60.3%)
ⓘ Screening estimate from a state-policy table — verify with the county assessor before closing.
Climate risk First Street
- Flood 1/10 Low FEMA zone X (unshaded) · 0% chance over 30 yrs
- Wildfire 1/10 Low
- Heat 2/10 Low 7 d/yr ≥91°F today · 15 d/yr by 30 yrs out
- Wind 3/10 Moderate 4% chance of damaging wind over 30 yrs
- Air quality 2/10 Low 1 unhealthy d/yr today · 2 by 30 yrs out
Nearby sold comps map
Loading sold comps map…
Walkable amenities ~0.75 mi
Loading nearby amenities…
Taxation est. · year 1
- Rental income
- $27,600
- − Mortgage interest
- −$19,605
- − Property taxes
- −$2,506
- − Insurance
- −$1,750
- − Repairs & maintenance
- −$2,208
- − Management
- −$2,208
- − HOA
- −$1,104
- − Depreciation
- −$10,182
- Taxable loss
- −$11,963
- Est. tax savings @ 24.0%
- +$2,871
- After-tax cash flow
- $-2,710/yr
For passive investors: Depreciation is non-cash, so a rental often shows a tax loss while cash-flowing — sheltering income. Rental losses are passive: they offset passive income freely, and up to $25,000/yr can offset ordinary (W-2) income if you actively participate and your MAGI is under $100k (phasing out to $0 by $150k); unused losses carry forward. On sale, claimed depreciation is recaptured at up to 25%, and gains may owe capital-gains tax (a 1031 exchange can defer both). Figures are a year-1 estimate at your 24.0% rate — not tax advice; consult a CPA.
Schools (NCES district)
- District
- Western Wayne SD
- NCES district ID
- 4226070
- Math proficiency
- 39% ▼ -12.00%
- Reading proficiency
- 63% ▼ -6.00%
- Median HH income
- $51,358
- Composite
- 43.65/100
- National rank
- #2964
- State rank
- #165 of 539 in PA
Livability — Salem
No livability data for this city. (Only ~50 U.S. cities are tracked.)
Census & demographics
- Census place
- Indian Rocks, PA
- Population (ZIP)
- 13,225
Population outlook (Wayne County) Hauer SSP2
- Today (2025)
- 47,924 people
- By 2030
- 46,191 · -3.6%
- By 2040
- 42,815 · -10.7%
- By 2050
- 39,873 · -16.8%
- By 2075
- 34,556 · -27.9%
- By 2100
- 28,358 · -40.8%
Race, ethnicity, and origin ACS 2023
- Neighborhood character
- Predominantly White (95%)
- Race & ethnicity
- White 95% Two or more races 3% Hispanic / Latino 2%
- Common ancestry
- Romanian 9% Scotch-Irish 2% Iranian 2%
- Foreign-born
- 4%
- Languages at home
- 95% English-only · French/Haitian/Cajun 2% Russian/Polish/Slavic 1% Spanish 1%
Political lean MEDSL · Wayne
- 2024 margin
- Solid R (+37.1) · D 31.1% · R 68.2%
- 2008→2024 swing
- -24.8pp toward R · 2008: -12.3pp · 2024: -37.1pp
- All cycles
- 2024: R+37.1 2020: R+33.6 2016: R+39.7 2012: R+20.9 2008: R+12.3
Not yet ingested
- Civics
- —
Market trends
- HPI YoY
- ▲ 47.95%
- Current HPI
- 331.9645
- Rent YoY
- —
- Metro
- —
- State GDP YoY
- ▲ 1.68%
- F500 in state
- 34
Industry mix (Fortune 500 HQ in PA)
| Industry | F500 HQs | Revenue |
|---|---|---|
| Healthcare | 2 | $309B |
|
||
| Insurance | 2 | $27B |
|
||
| Telecommunications / Media | 1 | $124B |
|
||
| Industrial Distribution | 1 | $22B |
|
||
| Financial Services | 1 | $20B |
|
||
| Chemicals / Materials | 1 | $18B |
|
||
Price history
+1650.0% since first listed5 events — show timeline
- 2026-06-07 Listed $350,000 PMAR
- 2025-08-21 Price Changed $350,000 PMAR
- 2025-06-21 Price Changed $375,000 PMAR
- 2025-06-18 Listed $37,500 PMAR
- 1988-09-19 Sold (Public Records) $20,000 Public Records
Property tax history
+0.5%/yrLatest (2026): $2,506 · +3.1% YoY. Source: county tax records.
Cash-flow waterfall
monthlySold comps — $/sqft
last 12 mo · ≤1 miLoading sold comps…