2151 E Pacheco Blvd #78 · Los Banos, CA
Flood risk No data
- FEMA flood zone
- —
- Chance of flooding over 30 yrs
- —
- Est. flood insurance / yr
- —
Fire risk No data
- Est. fire insurance / yr
- —
Heat risk No data
- Hot days now (above threshold)
- —
- Hot days in 30 yrs
- —
Wind risk No data
- Chance of severe wind over 30 yrs
- —
Air-quality risk No data
- Unhealthy air days now
- —
- Unhealthy air days in 30 yrs
- —
Risk factors via First Street. Map © Google.
Why this score? — see what drove the B grade
The composite is a weighted blend of 9 inputs, each scored 0–100. Each bar is that input's sub-score; the figure is the points it added to the 100-point composite (weight × sub-score).
- Cash flow +30.0/30.0
- ARV discount +13.6/15.0
- 1% rule +10.0/10.0
- DSCR +10.0/10.0
- Rent growth +4.1/5.0
- Livability +3.4/5.0
- Condition / age +2.5/5.0
- Schools +0.9/10.0
- Appreciation +0.0/10.0
$110,000
🖨 Deal sheet 📄 Offer letter ✓ Due diligence
Listing remarks
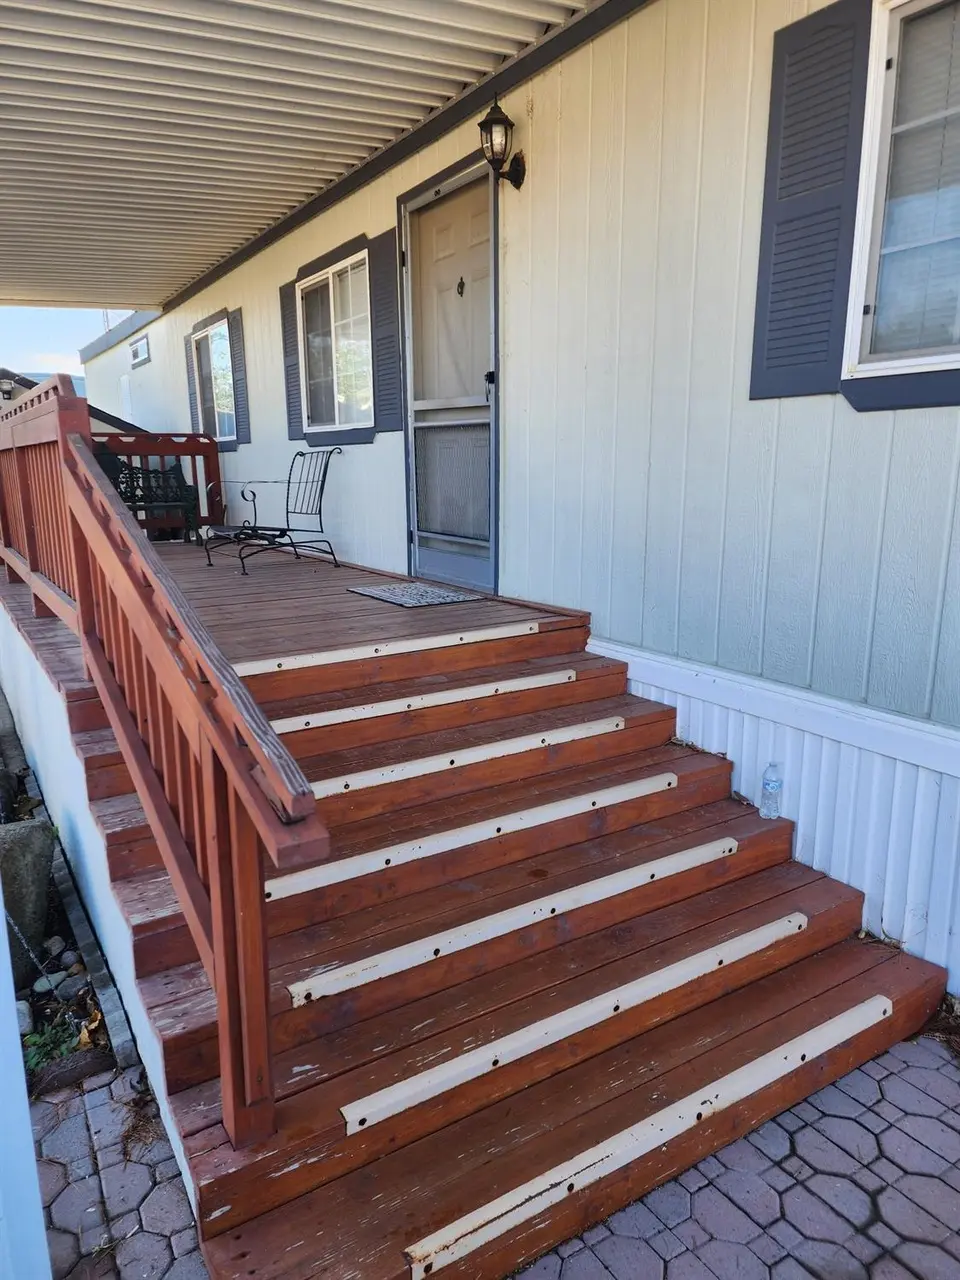
Well maintained mobile home in Los Banos most desirable mobile park. Covered porch with sitting area and covered car port. Walking distance to shopping and dining.
Key facts
- Covered porch
- Covered car port
- Sitting area
Tags
Neighborhood map
What this means for you Summary
Snapshot
- This is a 2-bed/1.0-bath manufactured listed at $110k.
Deal economics
- At list price, monthly cash flow is $737 ($9k/yr) — positive.
- The deal already cash-flows at list — no discount required.
- Meets the 1% rule at list price ($2k rent vs $110k).
- Recommended offer: $97k (12.0% below list) — sets the bar for market timing.
- Cap rate 14.3% vs local median 3.4% in Los Banos — top-decile yield for the area; either an underpriced asset or a hidden risk that comps aren't pricing in. Stress-test before assuming the spread holds.
Location & tenants
- Location reads 68/100 on livability (#270 in CA) — a middle-class / working-renter tenant base. Strengths: housing A+, health & safety A+, amenities B; Watch: schools D, commute F, cost of living F.
- Los Banos Unified (town): math 3% / reading 16% proficiency, ranked #503 of 517 in CA (top 97%) — low school quality limits family demand, transient renter base, plan for 1-2y turnover; 62% free/reduced lunch — lower-income household profile, screen leases tightly.
- Market conditions: Rents rising fast (+6.5%/yr); 211 active listings in the ZIP; 459 units permitted in Merced County in 2024 (0 in 5+ unit buildings).
- This rent runs 34% of the median local income ($67k/yr) — at the standard rent-burdened threshold; future hikes will face affordability resistance.
Forward outlook
- Local home prices are declining (-3.0%/yr); year-one equity from $761 of loan paydown is wiped out by about $3k of value loss. Plan a longer hold.
- Merced County population projected at +12% by 2050 — modest demand growth; plan on rents tracking national, not racing it.
- At projected returns (-3.0% appreciation + 6.5% rent growth), your $31k cash investment doubles in ~4 years — after that, you're playing with house money.
Negotiation context
- It's been on market 164 days — a 12% lower offer ($97k) is reasonable based on typical stale-listing flexibility.
Questions for the listing agent
- It's been on market 164 days. Have you received any prior offers? Is the seller open to a 12% concession, seller financing, or rate buy-down credit?
- Why hasn't it sold? Are there any deal-killer items the seller is aware of (foundation, flood, title, zoning, code violations)?
- Is there a deadline driving the sale (1031 exchange, divorce, estate, relocation)? That informs how much negotiation room exists.
- Schools are D-rated, which usually means shorter tenancies and higher turnover. Who's the typical renter profile here, and what's been the actual vacancy rate?
- What's the average days-on-market for RENTAL listings here right now (not sales)? A rising rental-DOM trend means longer vacancies and softer asking-rent achievability than the comps imply.
- What's the recent tenant-quality profile in this submarket — average credit score on applications, eviction rate, late-payment / NSF rate, and stable-employment percentage? A property-management company in the area should have these aggregated.
- How much new for-sale + rental construction is in the pipeline within 1–3 miles? Heavy new supply typically softens prices + rents 12–24 months out; constrained supply supports both.
Investment metrics
- 1% rule
- 1.72% ✓
- Cap rate
- 14.33%
- Cash-on-cash
- 28.70%
- DSCR
- 2.28
- GRM
- 4.8
CMA / ARV
- ARV (median comp)
- $127,092
- List price
- $110,000
- Delta
- -13.45%
- Verdict
- UNDERPRICED
- Comps
- 3 within 2.0 mi
Show comp detail 3 sales within ~0.75 mi
| Address | Dist | Beds/Ba | Sqft | Sold | Price | $/sf | Match |
|---|---|---|---|---|---|---|---|
| 2151 E Pacheco Blvd #53 | 0.00mi | 2/2.0 | 720 (+3%) | 21mo | $108,000 | $150 | 74 |
| 2151 Pacheco Blvd #13 | 0.22mi | 2/1.0 | 720 (+3%) | 23mo | $43,000 | $60 | 66 |
| 2151 E Pacheco Blvd #54 | 0.22mi | 2/1.0 | 732 (+5%) | 20mo | $105,000 | $143 | 65 |
Match score weights: distance 35% · size 25% · config 20% · recency 20%. Top-matched comps best support the ARV.
Projected returns pro-forma
-3.0% appreciation · 6.53% rent growth · sell at horizon
- IRR
- 27.0%
- Equity multiple
- 2.17×
- Total profit
- $36,087
- Equity at exit
- $16,401
- IRR
- 36.6%
- Equity multiple
- 4.98×
- Total profit
- $122,698
- Equity at exit
- $9,511
Cash invested: $30,800 (down + closing). Projections, not guarantees.
Landlord ↔ Tenant lean methodology
- Overall (STATE)
- 18 Strongly Tenant-Friendly
- State California
- 18 Strongly Tenant-Friendly · D+13
- County
- — inherits STATE
- City
- — inherits STATE
ZIP-level market 93635
- Rents YoY
- 6.5%
- Active inventory
- 211
- Price-to-rent
- 4.8×
Monthly cashflow live
- Estimated rent
- $1,895 medium interval (Pro) →
- Mortgage (P&I)
- −$577
- Tax est. 1.5%
- −$138 /mo · $1,650/yr
- Insurance
- −$46
- HOA
- −$0
- Vacancy / Maint / Mgmt
- −$398
- Net cashflow
- $737
Break-even live
UW: 25.0% down · 7.5% · 30yr · 1.5% tax · 5.0% vac · 8.0% maint · 8.0% mgmt
Financing live
Cash to close
- Down payment
- $27,500
- Closing costs
- $3,300
- Reserves months
- —
- Total cash needed
- —
Loan-product check · same deal, 3 products live
Conventional
25% down · 7.5% · 30yr
- Down + closing
- —
- Monthly P&I
- —
- Monthly cashflow
- —
- DSCR
- —
- Eligible?
- —
Personal DTI + credit; lowest rate.
DSCR
20% down · 8.5% · 30yr
- Down + closing
- —
- Monthly P&I
- —
- Monthly cashflow
- —
- DSCR
- —
- Eligible?
- —
No personal income docs; deal must DSCR.
Hard money
10% down · 12.0% · 12mo
- Down + closing
- —
- Monthly P&I
- —
- Monthly cashflow
- —
- DSCR
- —
- Eligible?
- —
Short-term bridge; refi at stabilization.
Listing history 14 events
-
2026-06-18days on market $110,000 Active 164 DOM
-
2026-06-17days on market $110,000 Active 163 DOM
-
2026-06-16days on market $110,000 Active 162 DOM
-
2026-06-15days on market $110,000 Active 161 DOM
-
2026-06-14days on market $110,000 Active 159 DOM
-
2026-06-13days on market $110,000 Active 158 DOM
-
2026-06-10days on market $110,000 Active 156 DOM
-
2026-06-09days on market $110,000 Active 155 DOM
-
2026-06-08days on market $110,000 Active 154 DOM
-
2026-06-07days on market $110,000 Active 153 DOM
-
2026-06-02days on market $110,000 Active 148 DOM
-
2026-06-01days on market $110,000 Active 147 DOM
-
2026-05-31days on market $110,000 Active 146 DOM
-
2026-05-30days on market $110,000 Active 145 DOM
ⓘ Source: listings_history table (triggers on properties + properties_extension) + one-shot
backfill from property_details.listing_events for pre-trigger history.
Nearby sold comps map
Loading sold comps map…
Walkable amenities ~0.75 mi
Loading nearby amenities…
Taxation est. · year 1
- Rental income
- $22,736
- − Mortgage interest
- −$6,162
- − Property taxes
- −$1,650
- − Insurance
- −$550
- − Repairs & maintenance
- −$1,819
- − Management
- −$1,819
- − Depreciation
- −$3,200
- Taxable income
- $7,537
- Est. tax owed @ 24.0%
- −$1,809
- After-tax cash flow
- $7,031/yr
For passive investors: Depreciation is non-cash, so a rental often shows a tax loss while cash-flowing — sheltering income. Rental losses are passive: they offset passive income freely, and up to $25,000/yr can offset ordinary (W-2) income if you actively participate and your MAGI is under $100k (phasing out to $0 by $150k); unused losses carry forward. On sale, claimed depreciation is recaptured at up to 25%, and gains may owe capital-gains tax (a 1031 exchange can defer both). Figures are a year-1 estimate at your 24.0% rate — not tax advice; consult a CPA.
Schools (NCES district)
- District
- Los Banos Unified
- NCES district ID
- 0622740
- Math proficiency
- 3% ▼ -23.00%
- Reading proficiency
- 16% ▼ -23.00%
- Median HH income
- $48,783
- Composite
- 9.04/100
- National rank
- #9875
- State rank
- #503 of 517 in CA
Livability — Los Banos
- Score
- 68/100
- State rank
- #270
- US rank
- #9141
Category grades
Schools grade is shown separately in the Schools card above.
Census & demographics
- Census place
- Los Banos, CA
- County
- Merced County · 205,386 people
- City population
- 50,149
- Metro
- Merced, CA
- Population (ZIP)
- 50,149
- Household income
- $67,129
- Rent vs Own
- Severe rent burden
- 1595.0
Population outlook (Merced County) Hauer SSP2
- Today (2025)
- 285,501 people
- By 2030
- 293,437 · +2.8%
- By 2040
- 308,808 · +8.2%
- By 2050
- 321,011 · +12.4%
- By 2075
- 338,497 · +18.6%
- By 2100
- 330,493 · +15.8%
Race, ethnicity, and origin ACS 2023
- Neighborhood character
- Predominantly Hispanic (73%)
- Race & ethnicity
- Hispanic / Latino 73% White 20% Two or more races 12% Native American 4% Asian 2% Black 2%
- Hispanic origin (detail)
- Mexican 68%
- Common ancestry
- Russian 3% Slovak 1%
- Foreign-born
- 28% · Canada, Vietnam
- Languages at home
- 48% English-only · Spanish 49% Other Indo-European 2%
Political lean MEDSL · Merced
- 2024 margin
- Toss-up / Even · D 46.5% · R 50.9% · Other 2.6%
- 2008→2024 swing
- -12.7pp toward R · 2008: 8.3pp · 2024: -4.4pp
- All cycles
- 2024: R+4.4 2020: D+10.6 2016: D+7.9 2012: D+5.4 2008: D+8.3
Not yet ingested
- Civics
- —
Market trends
- HPI YoY
- ▼ -357.30%
- Current HPI
- 217.6528
- Rent YoY
- ▲ 6.53%
- Metro
- Merced, CA
- State GDP YoY
- ▲ 3.21%
- F500 in state
- 116
Industry mix (Fortune 500 HQ in CA)
| Industry | F500 HQs | Revenue |
|---|---|---|
| Technology | 27 | $1,492B |
|
||
| Financial Services | 3 | $174B |
|
||
| Retail | 3 | $44B |
|
||
| Insurance | 3 | $26B |
|
||
| Media / Entertainment | 2 | $115B |
|
||
| Pharmaceuticals / Biotech | 2 | $62B |
|
||
Property tax history
-0.5%/yrLatest (2020): $186 · -0.2% YoY. Source: county tax records.
Cash-flow waterfall
monthlySold comps — $/sqft
last 12 mo · ≤1 miLoading sold comps…