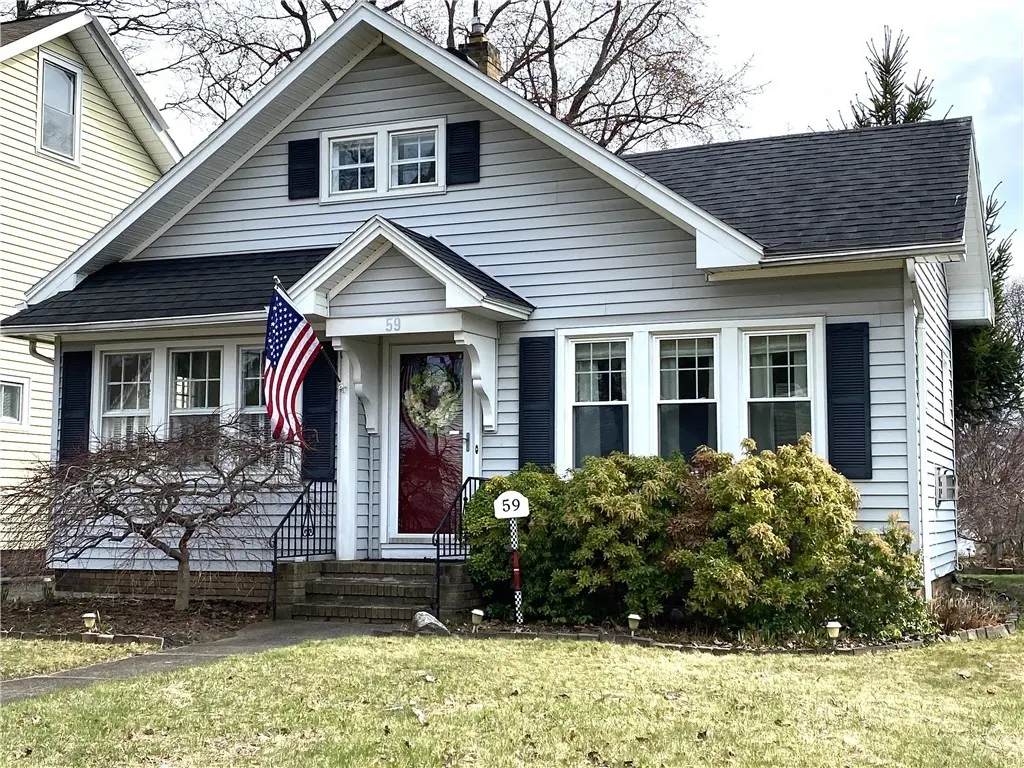
59 Armstrong Ave · Irondequoit, NY
Flood risk 1/10 · Minimal
- FEMA flood zone
- X (unshaded)
- Chance of flooding over 30 yrs
- 0.0%
- Est. flood insurance / yr
- $473 – $860
Fire risk 3/10 · Minor
- Est. fire insurance / yr
- $691 – $1,283
Heat risk 2/10 · Minimal
- Hot days now (above 96°F)
- 7 days/yr
- Hot days in 30 yrs
- 15 days/yr
Wind risk 1/10 · Minimal
- Chance of severe wind over 30 yrs
- —
Air-quality risk 2/10 · Minimal
- Unhealthy air days now
- 1 days/yr
- Unhealthy air days in 30 yrs
- 2 days/yr
Risk factors via First Street. Map © Google.
Why this score? — see what drove the D+ grade
The composite is a weighted blend of 9 inputs, each scored 0–100. Each bar is that input's sub-score; the figure is the points it added to the 100-point composite (weight × sub-score).
- ARV discount +15.0/15.0
- Cash flow +11.4/30.0
- Schools +6.2/10.0
- 1% rule +5.0/10.0
- Livability +4.0/5.0
- DSCR +3.3/10.0
- Rent growth +2.5/5.0
- Condition / age +2.5/5.0
- Appreciation +0.0/10.0
$175,900
🖨 Deal sheet 📄 Offer letter ✓ Due diligence
Listing remarks
Welcome to this cape cod style home in West Irondequoit that blends warmth, charm & inviting curb appeal. The bright, sunny updated kitchen features plenty of cabinets, tile flooring, 1 year old quartz sink & countertops and is large enough for family gatherings. The refrigerator is included-the stove is not (seller is taking) The living room with wall to wall carpeting over hardwoods, showcases a gas fireplace and has newer front windows. A full bath as well as 2 bedrooms round out the first floor. These rooms have newer double hung windows and the wall-to-wall carpeting covers hardwoods. The second floor has a bedroom, half bath and bonus room - perfect for sitting room, offic
Key facts
- Cape cod style home
- Gas fireplace
- Large patio
Tags
Property features AI
Exterior
- Parking: Detached garage with storage and electricity (approx. 1.5 car)
- Security: Owned security system
- Utilities: Electricity connected (circuit breakers); Public water connected; Sewer connected; High-speed internet available; Cable available
- Home design: 2-story house; Existing construction
- Construction: Asphalt roof; Vinyl siding; Block foundation; Attic/crawl hatchway(s) insulated; Blown-in insulation; Spray foam insulation; Copper plumbing
- Exterior features: Blacktop driveway; Partial fencing; Patio; Near public transit; Rectangular residential lot; City street frontage
Interior
- Kitchen: Refrigerator; Eat-in layout; Quartz counters
- Bedrooms: 2 bedrooms on the main level
- Flooring: Carpet; Ceramic tile; Hardwood; Varied flooring
- Bathrooms: 1 full bathroom; 1 half bathroom; 1 main-level bathroom
- Heating & cooling: Gas forced-air heating; Central air conditioning
- Interior features: Ceiling fans; Eat-in kitchen; Separate/formal living room; Country-style kitchen; Quartz countertops; Thermal windows; Bedroom on main level; Has basement (partial finished)
- Laundry & utility: Laundry in basement; Gas water heater
Neighborhood map
What this means for you Summary
Snapshot
- This is a 3-bed/1.5-bath single-family listed at $176k.
Deal economics
- At list price, monthly cash flow is $-63 ($-751/yr) — negative.
- To cash-flow at today's rent, offer at most $165k (6.3% below list).
- To meet the 1% rule (rent ≥ 1% of price), the offer needs to be $175k (0.2% below list).
- Recommended offer: $165k (6.3% below list) — sets the bar for cash-flow.
- Cap rate 5.9% vs local median 4.5% in Irondequoit — top-decile yield for the area; either an underpriced asset or a hidden risk that comps aren't pricing in. Stress-test before assuming the spread holds.
Location & tenants
- Location reads 81/100 on livability (#92 in NY, #1,414 nationally) — a professional / high-income tenant draw. Strengths: housing A+, health & safety A+, crime B+; Watch: amenities F.
- West Irondequoit Central School District (suburban): math 73% / reading 70% proficiency, ranked #126 of 590 in NY (top 21%) — strong family-tenant draw, lease renewals of 3-5y typical; only 18% free/reduced lunch — higher-income household profile.
- Market conditions: 102 active listings in the ZIP; 13 comparable units currently listed for rent nearby; rentals at typical pace (median 15d on market — plan ~3-4 weeks tenant-placement turnaround); solid renter incomes; 1,169 units permitted in Monroe County in 2024 (591 in 5+ unit buildings).
Forward outlook
- Local home prices are declining (-3.0%/yr); year-one equity from $1k of loan paydown is wiped out by about $5k of value loss. Plan a longer hold.
- Monroe County population projected to shrink 6% by 2050 — rents likely to lag national; underwrite the cash flow, not the appreciation.
Negotiation context
- Only 8 days on market — expect competitive offers; lowballing is unlikely to land.
Risks & watch-outs
- Watch-outs: property tax is 3.1% of price; built in 1926 — expect roof / HVAC / electrical / plumbing capex.
Questions for the listing agent
- What do current leases actually rent for vs. the listed asking? Can we see a recent rent roll and the last 12 months of T-12 income?
- Built in 1926 — when were the roof, HVAC, electrical panel, plumbing, and water heater last replaced?
- Property tax is high relative to price — has the assessment been appealed recently, and will the sale trigger a re-assessment?
- Is there a deadline driving the sale (1031 exchange, divorce, estate, relocation)? That informs how much negotiation room exists.
- Schools are B-rated — typically a magnet for longer-tenancy family renters. What's the average tenant stay here, and is there a school-zone premium baked into asking?
- The area grade is low — what's the realistic commute time and amenity access for the typical tenant pool here? Any planned neighborhood developments (good or bad) we should know about?
- What's the average days-on-market for RENTAL listings here right now (not sales)? A rising rental-DOM trend means longer vacancies and softer asking-rent achievability than the comps imply.
- What's the recent tenant-quality profile in this submarket — average credit score on applications, eviction rate, late-payment / NSF rate, and stable-employment percentage? A property-management company in the area should have these aggregated.
- How much new for-sale + rental construction is in the pipeline within 1–3 miles? Heavy new supply typically softens prices + rents 12–24 months out; constrained supply supports both.
Investment metrics
- 1% rule
- 1.00% ✗
- Cap rate
- 5.87%
- Cash-on-cash
- -1.52%
- DSCR
- 0.93
- GRM
- 8.4
CMA / ARV
- ARV (on-the-fly)
- $251,790
- Comps found
- 12
Show comp detail 12 sales within ~0.75 mi
| Address | Dist | Beds/Ba | Sqft | Sold | Price | $/sf | Match |
|---|---|---|---|---|---|---|---|
| 59 Armstrong Ave | 0.00mi | 3/1.5 | 1,090 (0%) | 1mo | $258,000 | $237 | 100 |
| 2042 N Clinton Ave | 0.40mi | 3/2.0 | 1,150 (+6%) | 2mo | $275,000 | $239 | 68 |
| 25 Maplehurst Rd | 0.27mi | 3/1.0 | 1,161 (+6%) | 7mo | $290,000 | $250 | 68 |
| 127 Barry Rd | 0.21mi | 2/2.0 (-1) | 1,163 (+7%) | 5mo | $200,000 | $172 | 68 |
| 9 Burwell Rd | 0.24mi | 3/1.5 | 1,200 (+10%) | 9mo | $277,500 | $231 | 64 |
| 472 Barry Rd | 0.62mi | 2/1.0 (-1) | 1,092 (+0%) | 2mo | $270,740 | $248 | 62 |
| 223 Navarre Rd | 0.48mi | 3/1.0 | 1,200 (+10%) | 8mo | $210,000 | $175 | 52 |
| 334 E Ridge Rd | 0.66mi | 3/1.0 | 1,176 (+8%) | 4mo | $194,900 | $166 | 50 |
| 209 Versailles Rd | 0.57mi | 3/1.0 | 1,175 (+8%) | 10mo | $170,000 | $145 | 50 |
| 78 Parkside Cres | 0.67mi | 3/1.0 | 1,175 (+8%) | 8mo | $262,000 | $223 | 47 |
| 105 Pontiac Dr | 0.72mi | 2/1.5 (-1) | 1,144 (+5%) | 9mo | $270,000 | $236 | 45 |
| 107 Long Meadow Dr | 0.63mi | 3/1.5 | 1,245 (+14%) | 6mo | $214,000 | $172 | 42 |
Match score weights: distance 35% · size 25% · config 20% · recency 20%. Top-matched comps best support the ARV.
Projected returns pro-forma
-3.0% appreciation · 3.0% rent growth · sell at horizon
- IRR
- -18.7%
- Equity multiple
- 0.34×
- Total profit
- $-32,320
- Equity at exit
- $26,227
- IRR
- -10.9%
- Equity multiple
- 0.34×
- Total profit
- $-32,587
- Equity at exit
- $15,209
Cash invested: $49,252 (down + closing). Projections, not guarantees.
Landlord ↔ Tenant lean methodology
- Overall (STATE)
- 15 Strongly Tenant-Friendly
- State New York
- 15 Strongly Tenant-Friendly · D+10
- County
- — inherits STATE
- City
- — inherits STATE
ZIP-level market 14617
- Active inventory
- 102
- Price-to-rent
- 8.4×
Monthly cashflow live
- Estimated rent
- $1,755 high interval (Pro) →
- Mortgage (P&I)
- −$922
- Tax from tax record
- −$453 /mo · $5,438/yr
- Insurance
- −$73
- HOA
- −$0
- Vacancy / Maint / Mgmt
- −$369
- Net cashflow
- $-63
Break-even live
UW: 25.0% down · 7.5% · 30yr · 1.5% tax · 5.0% vac · 8.0% maint · 8.0% mgmt
Financing live
Cash to close
- Down payment
- $43,975
- Closing costs
- $5,277
- Reserves months
- —
- Total cash needed
- —
Loan-product check · same deal, 3 products live
Conventional
25% down · 7.5% · 30yr
- Down + closing
- —
- Monthly P&I
- —
- Monthly cashflow
- —
- DSCR
- —
- Eligible?
- —
Personal DTI + credit; lowest rate.
DSCR
20% down · 8.5% · 30yr
- Down + closing
- —
- Monthly P&I
- —
- Monthly cashflow
- —
- DSCR
- —
- Eligible?
- —
No personal income docs; deal must DSCR.
Hard money
10% down · 12.0% · 12mo
- Down + closing
- —
- Monthly P&I
- —
- Monthly cashflow
- —
- DSCR
- —
- Eligible?
- —
Short-term bridge; refi at stabilization.
Rent comps 13 comps
| Address | Beds | Baths | Sqft | Rent | $/sqft | DOM | Units | Dist |
|---|---|---|---|---|---|---|---|---|
| 83 Navarre Rd Rochester, NY | 3.0 | 2.0 | 1322 | $2,250 | $1.70 | 2d | 1 | 0.38mi |
| 14-42 Seneca Manor Dr Rochester, NY | 1.0–2.0 | 1.0 | 800 | $1,120 | $1.40 | 43d | 1 | 0.81mi |
| 1750 Hudson Ave Irondequoit, NY | 1.0–2.0 | 1.0 | 654 | $1,900 | $2.90 | 2d | 4 | 0.92mi |
| 116 Ridgeway Ave Rochester, NY | 3.0 | 2.0 | 1032 | $1,650 | $1.60 | 2d | 1 | 0.99mi |
| 248 Flower City Park Rochester, NY | 3.0 | 1.0 | 1350 | $1,800 | $1.33 | 3d | 1 | 1.00mi |
| 230 Pullman Ave Unit 1 Rochester, NY | 2.0 | 1.0 | 900 | $1,100 | $1.22 | 14d | 1 | 1.02mi |
| 493 Hollenbeck St Rochester, NY | 2.0 | 1.5 | 936 | $1,275 | $1.36 | 14d | 1 | 1.03mi |
| 45 Clay Ave Rochester, NY | 3.0 | 1.0 | 1000 | $1,700 | $1.70 | 14d | 1 | 1.08mi |
| 1902 Dewey Ave Unit 1896 Rochester, NY | 2.0 | 1.0 | 900 | $1,150 | $1.28 | 23d | 1 | 1.08mi |
| 39 Chelsea Rd Rochester, NY | 3.0 | 1.5 | 1108 | $2,350 | $2.12 | 23d | 1 | 1.24mi |
| 56 Brambury Dr Rochester, NY | 1.0–2.0 | 1.0 | 720 | $1,425 | $1.98 | 10d | 1 | 1.33mi |
| 60 Cheltenham Rd Unit Down Rochester, NY | 2.0 | 1.0 | 1014 | $1,300 | $1.28 | 14d | 1 | 1.37mi |
| 1016 Lake Ave Unit 1 Rochester, NY | 3.0 | 1.0 | 1300 | $1,600 | $1.23 | 43d | 1 | 1.48mi |
Listing history 2 events
-
2026-04-14status Pending
-
2026-04-06$175,900 Active
ⓘ Source: listings_history table (triggers on properties + properties_extension) + one-shot
backfill from property_details.listing_events for pre-trigger history.
Tax reassessment forecast NY · Partial reset (capped growth)
- Current annual tax
- $5,438 · $453/mo
- Projected year-2 tax
- $5,438 · $453/mo
- Expected delta
- $0/yr ($0/mo · 0.0%)
ⓘ Screening estimate from a state-policy table — verify with the county assessor before closing.
Climate risk First Street
- Flood 1/10 Low FEMA zone X (unshaded) · 0% chance over 30 yrs
- Wildfire 3/10 Moderate
- Heat 2/10 Low 7 d/yr ≥96°F today · 15 d/yr by 30 yrs out
- Wind 1/10 Low
- Air quality 2/10 Low 1 unhealthy d/yr today · 2 by 30 yrs out
Nearby sold comps map
Loading sold comps map…
Walkable amenities ~0.75 mi
Loading nearby amenities…
Taxation est. · year 1
- Rental income
- $21,058
- − Mortgage interest
- −$9,853
- − Property taxes
- −$5,438
- − Insurance
- −$880
- − Repairs & maintenance
- −$1,685
- − Management
- −$1,685
- − Depreciation
- −$5,117
- Taxable loss
- −$3,599
- Est. tax savings @ 24.0%
- +$864
- After-tax cash flow
- $113/yr
For passive investors: Depreciation is non-cash, so a rental often shows a tax loss while cash-flowing — sheltering income. Rental losses are passive: they offset passive income freely, and up to $25,000/yr can offset ordinary (W-2) income if you actively participate and your MAGI is under $100k (phasing out to $0 by $150k); unused losses carry forward. On sale, claimed depreciation is recaptured at up to 25%, and gains may owe capital-gains tax (a 1031 exchange can defer both). Figures are a year-1 estimate at your 24.0% rate — not tax advice; consult a CPA.
Schools (NCES district)
- District
- West Irondequoit Central School District
- NCES district ID
- 3615390
- Math proficiency
- 73% ▲ 3.00%
- Reading proficiency
- 70% ▲ 5.00%
- Median HH income
- $60,218
- Composite
- 61.61/100
- National rank
- #748
- State rank
- #126 of 590 in NY
Livability — Irondequoit
- Score
- 81/100
- State rank
- #92
- US rank
- #1414
Category grades
Schools grade is shown separately in the Schools card above.
Census & demographics
- Census place
- Irondequoit, NY
- County
- Monroe County · 674,131 people
- City population
- 74,252
- Metro
- Rochester, NY
- Population (ZIP)
- 21,788
- Household income
- $90,192
- Rent vs Own
- Severe rent burden
- 426.0
Population outlook (Monroe County) Hauer SSP2
- Today (2025)
- 759,460 people
- By 2030
- 757,154 · -0.3%
- By 2040
- 740,644 · -2.5%
- By 2050
- 714,443 · -5.9%
- By 2075
- 645,883 · -15.0%
- By 2100
- 547,084 · -28.0%
Race, ethnicity, and origin ACS 2023
- Neighborhood character
- Predominantly White (85%)
- Race & ethnicity
- White 85% Hispanic / Latino 8% Two or more races 6% Black 4%
- Hispanic origin (detail)
- Puerto Rican 4%
- Common ancestry
- Romanian 6% Iranian 3% Lithuanian 3%
- Foreign-born
- 4% · Canada
- Languages at home
- 93% English-only · Spanish 4% Other Indo-European 1% Russian/Polish/Slavic 1%
Political lean MEDSL · Monroe
- 2024 margin
- D (+19.1) · D 59.5% · R 40.5%
- 2008→2024 swing
- +1.4pp toward D · 2008: 17.7pp · 2024: 19.1pp
- All cycles
- 2024: D+19.1 2020: D+21.0 2016: D+14.1 2012: D+17.4 2008: D+17.7
Not yet ingested
- Civics
- —
Market trends
- HPI YoY
- ▼ -148.22%
- Current HPI
- 263.9973
- Rent YoY
- —
- Metro
- Rochester, NY
- State GDP YoY
- ▲ 2.60%
- F500 in state
- 92
Industry mix (Fortune 500 HQ in NY)
| Industry | F500 HQs | Revenue |
|---|---|---|
| Financial Services | 10 | $950B |
|
||
| Consumer Goods | 9 | $162B |
|
||
| Insurance | 4 | $225B |
|
||
| Telecommunications | 2 | $144B |
|
||
| Pharmaceuticals | 2 | $112B |
|
||
| Media / Entertainment | 2 | $69B |
|
||
Price history
2 events — show timeline
- 2026-04-14 Pending — UNYREIS
- 2026-04-06 Listed $175,900 UNYREIS
Property tax history
+4.5%/yrLatest (2025): $5,438 · +52.2% YoY. Source: county tax records.
Cash-flow waterfall
monthlySold comps — $/sqft
last 12 mo · ≤1 miLoading sold comps…