7610 Carmil Ct · Louisville/Jefferson County metro government (balance), KY
Flood risk 1/10 · Minimal
- FEMA flood zone
- X (unshaded)
- Chance of flooding over 30 yrs
- 0.0%
- Est. flood insurance / yr
- $473 – $860
Fire risk 1/10 · Minimal
- Est. fire insurance / yr
- $839 – $1,559
Heat risk 5/10 · Moderate
- Hot days now (above 104°F)
- 7 days/yr
- Hot days in 30 yrs
- 19 days/yr
Wind risk 2/10 · Minimal
- Chance of severe wind over 30 yrs
- 3.0%
Air-quality risk 3/10 · Minor
- Unhealthy air days now
- 2 days/yr
- Unhealthy air days in 30 yrs
- 3 days/yr
Risk factors via First Street. Map © Google.
Why this score? — see what drove the D+ grade
The composite is a weighted blend of 9 inputs, each scored 0–100. Each bar is that input's sub-score; the figure is the points it added to the 100-point composite (weight × sub-score).
- ARV discount +15.0/15.0
- Cash flow +13.5/30.0
- Rent growth +5.0/5.0
- DSCR +4.1/10.0
- 1% rule +3.5/10.0
- Livability +2.5/5.0
- Condition / age +2.5/5.0
- Schools +2.3/10.0
- Appreciation +0.0/10.0
$270,000
🖨 Deal sheet 📄 Offer letter ✓ Due diligence
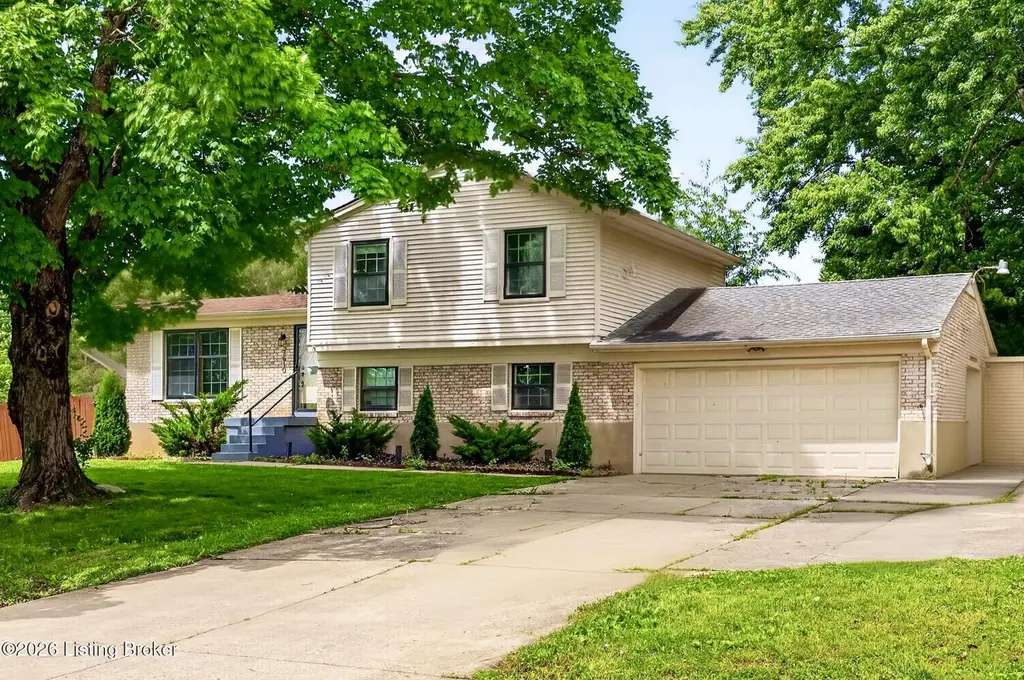
Listing remarks MLS
Four bedroom, 2 full bathroom home on a large corner lot with fenced in back yard. Home has a formal dining room, eat in kitchen, and attached 2 car garage. Home is being sold as is: proof of funds/ pre-approval with offer. Sq ft and utilities to be verified by buyer. Please read agent notes!
Key facts
- Beautiful deck
- Private backyard
- Peaceful cul-de-sac
Tags
Property features AI
Finance
- Other: Subdivision: GAINSBOROUGH
- HOA & community: No association fee
Exterior
- Parking: Attached 2-car garage
- Utilities: Electricity connected; One HVAC unit
- Home design: Single family residence; 3 stories; Built in 1974
- Construction: Vinyl siding exterior; Shingle roof; Poured concrete foundation
- Exterior features: Privacy wood fencing; Corner lot; Located on a cul-de-sac; Lot dimensions approximately 22 x 25 x 22 x 27
Interior
- Kitchen: Kitchen on the first floor; Dining room on the first floor
- Bedrooms: 4 bedrooms total; Primary bedroom on the second floor; Three additional bedrooms on the second floor; One bedroom on the third floor; No first-floor or basement bedrooms
- Bathrooms: 2 full bathrooms; Full bathrooms located on the third floor
- Heating & cooling: Forced air heating; Central air conditioning
- Interior features: Unfinished basement; 7 closets; 9 rooms on main floor count (11 rooms total)
- Laundry & utility: Laundry room in the basement; First-floor laundry not available
Neighborhood map
What this means for you Summary
Snapshot
- This is a 4-bed/2.0-bath single-family listed at $270k.
Deal economics
- At list price, monthly cash flow is $11 ($132/yr) — positive.
- The deal already cash-flows at list — no discount required.
- To meet the 1% rule (rent ≥ 1% of price), the offer needs to be $230k (14.7% below list).
- Recommended offer: $230k (14.7% below list) — sets the bar for 1% rule.
- Cap rate 6.3% vs local median 4.0% in Louisville/Jefferson County metro government (balance) — top-decile yield for the area; either an underpriced asset or a hidden risk that comps aren't pricing in. Stress-test before assuming the spread holds.
Location & tenants
- Location reads: area grade D — affects rentability + tenant quality, not the cash-flow math above.
- Jefferson County (urban): math 19% / reading 35% proficiency, ranked #121 of 165 in KY (top 73%) — low school quality limits family demand, transient renter base, plan for 1-2y turnover.
- Market conditions: Rents rising fast (+15.0%/yr); 291 active listings in the ZIP; 8 comparable units currently listed for rent nearby; rentals at typical pace (median 24d on market — plan ~3-4 weeks tenant-placement turnaround); solid renter incomes; 2,836 units permitted in Jefferson County in 2024 (1,558 in 5+ unit buildings).
- This rent runs 34% of the median local income ($81k/yr) — at the standard rent-burdened threshold; future hikes will face affordability resistance.
Forward outlook
- Local home prices are declining (-3.0%/yr); year-one equity from $2k of loan paydown is wiped out by about $8k of value loss. Plan a longer hold.
- Jefferson County population projected at +13% by 2050 — modest demand growth; plan on rents tracking national, not racing it.
Negotiation context
- Only 7 days on market — expect competitive offers; lowballing is unlikely to land.
- 5 sale attempts since 23y ago with the ask held roughly flat each time — persistent listings suggest the price (not the market) is what's stuck; bring a comps-based counter.
- Current owner paid $145k; list at $270k implies a 86% gain — meaningful room to come down on a strong offer.
Risks & watch-outs
- Climate carrying-cost: extreme-heat days projected 7→19/yr by 2055 (HVAC capex compounding) — expect insurance premiums to compound above CPI over the hold.
Questions for the listing agent
- Built in 1974 — when were the roof, HVAC, electrical panel, plumbing, and water heater last replaced?
- Is there a deadline driving the sale (1031 exchange, divorce, estate, relocation)? That informs how much negotiation room exists.
- The area grade is low — what's the realistic commute time and amenity access for the typical tenant pool here? Any planned neighborhood developments (good or bad) we should know about?
- What's the average days-on-market for RENTAL listings here right now (not sales)? A rising rental-DOM trend means longer vacancies and softer asking-rent achievability than the comps imply.
- What's the recent tenant-quality profile in this submarket — average credit score on applications, eviction rate, late-payment / NSF rate, and stable-employment percentage? A property-management company in the area should have these aggregated.
- How much new for-sale + rental construction is in the pipeline within 1–3 miles? Heavy new supply typically softens prices + rents 12–24 months out; constrained supply supports both.
Investment metrics
- 1% rule
- 0.85% ✗
- Cap rate
- 6.34%
- Cash-on-cash
- 0.17%
- DSCR
- 1.01
- GRM
- 9.8
CMA / ARV
- ARV (on-the-fly)
- $394,108
- Comps found
- 12
Show comp detail 12 sales within ~0.75 mi
| Address | Dist | Beds/Ba | Sqft | Sold | Price | $/sf | Match |
|---|---|---|---|---|---|---|---|
| 7414 Spring House Ln | 0.39mi | 4/2.0 | 2,341 (+0%) | 3mo | $306,000 | $131 | 79 |
| 8411 Happiness Way | 0.26mi | 3/2.0 (-1) | 2,381 (+2%) | 4mo | $323,000 | $136 | 76 |
| 8001 Mary Sue Dr | 0.30mi | 4/2.0 | 2,246 (-4%) | 5mo | $315,000 | $140 | 76 |
| 8403 Old Boundary Rd | 0.48mi | 4/2.5 | 2,203 (-6%) | 6mo | $300,000 | $136 | 61 |
| 7106 Mckenna Ct | 0.58mi | 3/2.5 (-1) | 2,390 (+2%) | 4mo | $265,000 | $111 | 58 |
| 7308 Jacks Lndg | 0.56mi | 4/2.5 | 2,015 (-14%) | 1mo | $344,900 | $171 | 49 |
| 7305 Jacks Lndg | 0.57mi | 4/2.5 | 2,015 (-14%) | 1mo | $339,900 | $169 | 48 |
| 8702 Mckenna Way | 0.63mi | 3/1.5 (-1) | 2,160 (-7%) | 5mo | $270,000 | $125 | 48 |
| Lot 14 Farmgate Crossings | 0.57mi | 4/2.5 | 2,015 (-14%) | 2mo | $344,900 | $171 | 47 |
| 8201 Jacks Hidden Cv | 0.58mi | 4/2.5 | 2,015 (-14%) | 3mo | $347,400 | $172 | 46 |
| 7204 Jacks Lndg | 0.52mi | 4/2.5 | 2,015 (-14%) | 6mo | $339,900 | $169 | 46 |
| Lot 4 Farmgate Crossings | 0.58mi | 4/2.5 | 2,015 (-14%) | 5mo | $339,900 | $169 | 44 |
Match score weights: distance 35% · size 25% · config 20% · recency 20%. Top-matched comps best support the ARV.
Projected returns pro-forma
-3.0% appreciation · 8.0% rent growth · sell at horizon
- IRR
- -10.7%
- Equity multiple
- 0.59×
- Total profit
- $-30,884
- Equity at exit
- $40,258
- IRR
- 4.4%
- Equity multiple
- 1.39×
- Total profit
- $29,388
- Equity at exit
- $23,345
Cash invested: $75,600 (down + closing). Projections, not guarantees.
Landlord ↔ Tenant lean methodology
- Overall (STATE)
- 83 Strongly Landlord-Friendly
- State Kentucky
- 83 Strongly Landlord-Friendly · R+16
- County
- — inherits STATE
- City
- — inherits STATE
ZIP-level market 40291
- Rents YoY
- 15.0%
- Active inventory
- 291
- Price-to-rent
- 9.8×
Monthly cashflow live
- Estimated rent
- $2,303 high interval (Pro) →
- Mortgage (P&I)
- −$1,416
- Tax from tax record
- −$280 /mo · $3,355/yr
- Insurance
- −$112
- HOA
- −$0
- Vacancy / Maint / Mgmt
- −$484
- Net cashflow
- $11
Break-even live
UW: 25.0% down · 7.5% · 30yr · 1.5% tax · 5.0% vac · 8.0% maint · 8.0% mgmt
Financing live
Cash to close
- Down payment
- $67,500
- Closing costs
- $8,100
- Reserves months
- —
- Total cash needed
- —
Loan-product check · same deal, 3 products live
Conventional
25% down · 7.5% · 30yr
- Down + closing
- —
- Monthly P&I
- —
- Monthly cashflow
- —
- DSCR
- —
- Eligible?
- —
Personal DTI + credit; lowest rate.
DSCR
20% down · 8.5% · 30yr
- Down + closing
- —
- Monthly P&I
- —
- Monthly cashflow
- —
- DSCR
- —
- Eligible?
- —
No personal income docs; deal must DSCR.
Hard money
10% down · 12.0% · 12mo
- Down + closing
- —
- Monthly P&I
- —
- Monthly cashflow
- —
- DSCR
- —
- Eligible?
- —
Short-term bridge; refi at stabilization.
Rent comps 8 comps
| Address | Beds | Baths | Sqft | Rent | $/sqft | DOM | Units | Dist |
|---|---|---|---|---|---|---|---|---|
| 8509 Gainsborough Dr Louisville, KY | 3.0 | 2.0 | 1764 | $2,130 | $1.21 | 19d | 1 | 0.10mi |
| 8217 Zelma Fields Ave Louisville, KY | 4.0 | 1.5 | 1644 | $1,795 | $1.09 | 23d | 1 | 0.44mi |
| 7017 Field View Ct Louisville, KY | 3.0 | 2.0 | 2600 | $2,330 | $0.90 | 2d | 1 | 0.65mi |
| 8001 Zelma Fields Ave Louisville, KY | 3.0 | 1.5 | 2422 | $1,900 | $0.78 | 23d | 1 | 0.67mi |
| 9041 Black Powder Ln Louisville, KY | 3.0 | 2.0 | 1650 | $1,799 | $1.09 | 23d | 1 | 1.12mi |
| 8116 Cedar Crest Ln Unit 1 Louisville, KY | 3.0 | 2.0 | 1806 | $2,300 | $1.27 | 23d | 1 | 1.14mi |
| 6306 Labor Ln Louisville, KY | 3.0 | 2.5 | 1880 | $1,999 | $1.06 | 15d | 1 | 1.36mi |
| 8909 Gentlewind Way Louisville, KY | 4.0 | 2.5 | 2509 | $2,600 | $1.04 | 10d | 1 | 1.36mi |
Listing history 6 events
-
2026-06-16status $270,000 Pending 7 DOM
-
2026-06-15days on market $270,000 Active 7 DOM
-
2026-06-13pricestatusdays on market $270,000 Active 5 DOM
-
2026-06-03statusdays on market $280,000 Pending 2 DOM
-
2026-06-02remarks 689-char remark
-
2026-06-02$280,000 Active 1 DOM
ⓘ Source: listings_history table (triggers on properties + properties_extension) + one-shot
backfill from property_details.listing_events for pre-trigger history.
Tax reassessment forecast KY · Resets to sale price
- Current annual tax
- $3,355 · $280/mo
- Projected year-2 tax
- $3,355 · $280/mo
- Expected delta
- $0/yr ($0/mo · 0.0%)
ⓘ Screening estimate from a state-policy table — verify with the county assessor before closing.
Climate risk First Street
- Flood 1/10 Low FEMA zone X (unshaded) · 0% chance over 30 yrs
- Wildfire 1/10 Low
- Heat 5/10 Major 7 d/yr ≥104°F today · 19 d/yr by 30 yrs out
- Wind 2/10 Low 3% chance of damaging wind over 30 yrs
- Air quality 3/10 Moderate 2 unhealthy d/yr today · 3 by 30 yrs out
Nearby sold comps map
Loading sold comps map…
Walkable amenities ~0.75 mi
Loading nearby amenities…
Taxation est. · year 1
- Rental income
- $27,630
- − Mortgage interest
- −$15,124
- − Property taxes
- −$3,355
- − Insurance
- −$1,350
- − Repairs & maintenance
- −$2,210
- − Management
- −$2,210
- − Depreciation
- −$7,855
- Taxable loss
- −$4,474
- Est. tax savings @ 24.0%
- +$1,074
- After-tax cash flow
- $1,206/yr
For passive investors: Depreciation is non-cash, so a rental often shows a tax loss while cash-flowing — sheltering income. Rental losses are passive: they offset passive income freely, and up to $25,000/yr can offset ordinary (W-2) income if you actively participate and your MAGI is under $100k (phasing out to $0 by $150k); unused losses carry forward. On sale, claimed depreciation is recaptured at up to 25%, and gains may owe capital-gains tax (a 1031 exchange can defer both). Figures are a year-1 estimate at your 24.0% rate — not tax advice; consult a CPA.
Schools (NCES district)
- District
- Jefferson County
- NCES district ID
- 2102990
- Math proficiency
- 19% ▼ -17.00%
- Reading proficiency
- 35% ▼ -11.00%
- Median HH income
- $47,885
- Composite
- 23.45/100
- National rank
- #7884
- State rank
- #121 of 165 in KY
Livability — Louisville/Jefferson County metro government (balance)
No livability data for this city. (Only ~50 U.S. cities are tracked.)
Census & demographics
- Census place
- Louisville/Jefferson County metro government (balance), KY
- County
- Jefferson County · 790,184 people
- City population
- 419,741
- Metro
- Louisville/Jefferson County, KY-IN
- Population (ZIP)
- 41,222
- Household income
- $81,267
- Rent vs Own
- Severe rent burden
- 790.0
Population outlook (Jefferson County) Hauer SSP2
- Today (2025)
- 823,112 people
- By 2030
- 849,343 · +3.2%
- By 2040
- 895,696 · +8.8%
- By 2050
- 933,630 · +13.4%
- By 2075
- 1,028,262 · +24.9%
- By 2100
- 1,072,675 · +30.3%
Race, ethnicity, and origin ACS 2023
- Neighborhood character
- Predominantly White (66%)
- Race & ethnicity
- White 66% Black 19% Two or more races 8% Hispanic / Latino 8% Asian 3%
- Hispanic origin (detail)
- Mexican 4%
- Common ancestry
- Italian 4% Slovak 3% Lithuanian 2%
- Foreign-born
- 7% · Canada, India, Vietnam
- Languages at home
- 89% English-only · Spanish 4% Russian/Polish/Slavic 1% French/Haitian/Cajun 1%
Political lean MEDSL · Jefferson
- 2024 margin
- D (+16.6) · D 57.4% · R 40.9% · Other 1.7%
- 2008→2024 swing
- +4.5pp toward D · 2008: 12.0pp · 2024: 16.6pp
- All cycles
- 2024: D+16.6 2020: D+20.1 2016: D+13.3 2012: D+11.1 2008: D+12.0
Not yet ingested
- Civics
- —
Market trends
- HPI YoY
- ▼ -279.15%
- Current HPI
- 218.0784
- Rent YoY
- ▲ 14.96%
- Metro
- Louisville/Jefferson County, KY-IN
- State GDP YoY
- ▲ 1.81%
- F500 in state
- 4
Industry mix (Fortune 500 HQ in KY)
| Industry | F500 HQs | Revenue |
|---|---|---|
| Healthcare | 1 | $118B |
|
||
| Food / Beverage | 1 | $7B |
|
||
Price history
+100.1% since first listed14 events — show timeline
- 2026-06-01 Listed $280,000 Metro Search MLS
- 2022-08-14 Listing Removed — Metro Search MLS
- 2022-05-07 Price Changed $287,000 Metro Search MLS
- 2022-05-07 Listed $287,000 Metro Search MLS
- 2019-03-11 Sold (MLS) $145,000 Metro Search MLS
- 2019-01-24 Pending — Metro Search MLS
- 2018-12-12 Relisted — Metro Search MLS
- 2018-12-12 Price Changed $149,900 Metro Search MLS
- 2018-12-12 Price Changed $159,000 Metro Search MLS
- 2018-10-26 Pending — Metro Search MLS
- 2018-10-17 Listed $164,500 Metro Search MLS
- 2003-12-10 Sold (Public Records) $145,000 Public Records
- 2003-12-10 Sold (MLS) $145,000 Metro Search MLS
- 2003-09-25 Listed $139,900 Metro Search MLS
Property tax history
+6.7%/yrLatest (2025): $3,355 · +49.9% YoY. Source: county tax records.
Cash-flow waterfall
monthlySold comps — $/sqft
last 12 mo · ≤1 miLoading sold comps…