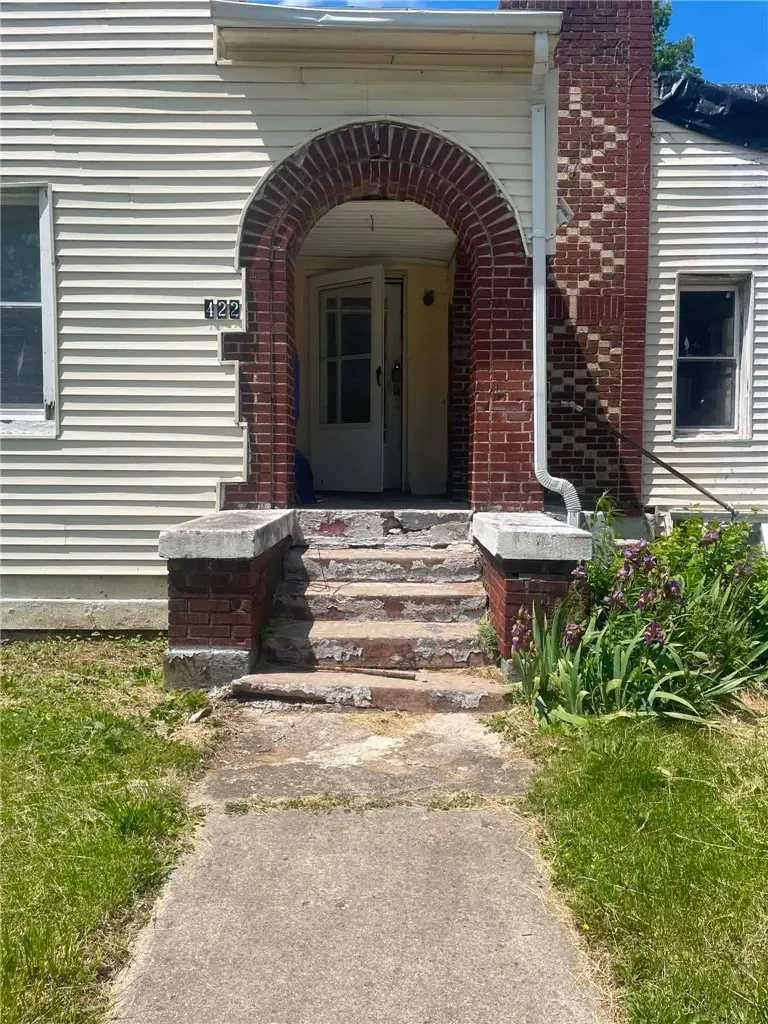
422 N Columbus St · Xenia, OH
Flood risk 1/10 · Minimal
- FEMA flood zone
- X (unshaded)
- Chance of flooding over 30 yrs
- 0.0%
- Est. flood insurance / yr
- $473 – $860
Fire risk 1/10 · Minimal
- Est. fire insurance / yr
- $713 – $1,323
Heat risk 3/10 · Minor
- Hot days now (above 99°F)
- 7 days/yr
- Hot days in 30 yrs
- 18 days/yr
Wind risk 2/10 · Minimal
- Chance of severe wind over 30 yrs
- 1.0%
Air-quality risk 3/10 · Minor
- Unhealthy air days now
- 3 days/yr
- Unhealthy air days in 30 yrs
- 3 days/yr
Risk factors via First Street. Map © Google.
Why this score? — see what drove the D+ grade
The composite is a weighted blend of 9 inputs, each scored 0–100. Each bar is that input's sub-score; the figure is the points it added to the 100-point composite (weight × sub-score).
- Cash flow +15.0/30.0
- ARV discount +7.5/15.0
- 1% rule +5.0/10.0
- DSCR +5.0/10.0
- Schools +4.0/10.0
- Rent growth +3.9/5.0
- Livability +3.8/5.0
- Condition / age +2.5/5.0
- Appreciation +0.0/10.0
$30,000
🖨 Deal sheet (PDF) 📄 Offer letter ✓ Due diligence
Listing remarks MLS
This one is for the experienced handy investor, Property had some major water damage (missing roof), priced to allow for a lot of repairs. This project is not for everyone. SELLING AS IS. Buyer and agent must sign hold harmless letter if they want to walk through property.
Key facts
- Full renovation
- Investor opportunity
- 5,663 sq ft lot
Tags
Property features AI
Finance
- Financial info: Offered for sale
Exterior
- Parking: No garage
- Utilities: Natural gas available; Has heating
- Home design: Single-story; Brick, frame, stucco and vinyl siding exterior
- Construction: Brick, frame, stucco and vinyl siding construction
- Exterior features: Lot approximately 45 x 126 (0.13 acre); Residential zoning
Interior
- Bedrooms: Main level bedroom (11 x 13); Main level bedroom (11 x 11); Main level room (10 x 19)
- Bathrooms: 1 full bathroom (main level)
- Heating & cooling: Forced air heating; Natural gas heating
- Interior features: Unfinished basement; 6 total rooms
Neighborhood map
What this means for you Summary
Snapshot
- This is a 2-bed/1.0-bath single-family listed at $30k.
Deal economics
- At list price, monthly cash flow is $789 ($9k/yr) — positive.
- The deal already cash-flows at list — no discount required.
- Meets the 1% rule at list price ($1k rent vs $30k).
- Recommended offer: $30k (1.5% below list) — sets the bar for market timing.
- Cap rate 37.8% vs local median 3.6% in Xenia — top-decile yield for the area; either an underpriced asset or a hidden risk that comps aren't pricing in. Stress-test before assuming the spread holds.
Location & tenants
- Location reads 75/100 on livability (#244 in OH, #3,892 nationally) — a middle-class / working-renter tenant base. Strengths: cost of living A+, housing A+, health & safety B+; Watch: amenities D+, commute F, employment F.
- Xenia Community City (suburban): math 42% / reading 53% proficiency, ranked #478 of 656 in OH (top 73%) — families likely to look elsewhere, expect single-tenant / working-renter base with shorter leases.
- Zoned schools: Arrowood Elementary (math 55% / reading 50%, grade C-, #846 of 1,584 statewide, top 54%, 419 students, 0% FRL); Warner Middle School (math 35% / reading 45%, grade F, #511 of 654 statewide, top 79%, 848 students, 0% FRL); Xenia High School (math 25% / reading 63%, grade F, #489 of 781 statewide, top 63%, 985 students, 48% FRL) — zoned schools average 16% FRL vs 50% district-wide (34 pts lower); this property's tenant base skews higher-income than the district average.
- Market conditions: Rents rising fast (+5.5%/yr); 240 active listings in the ZIP; 8 comparable units currently listed for rent nearby; rentals leasing fast (median 13d on market — plan ~1-2 weeks tenant-placement turnaround); solid renter incomes; 797 units permitted in Greene County in 2024 (148 in 5+ unit buildings).
Forward outlook
- Local home prices are declining (-3.0%/yr); year-one equity from $207 of loan paydown is wiped out by about $900 of value loss. Plan a longer hold.
- At projected returns (-3.0% appreciation + 5.5% rent growth), your $8k cash investment doubles in ~1 year — after that, you're playing with house money.
Negotiation context
- It's been on market 16 days — a 2% lower offer ($30k) is reasonable based on typical stale-listing flexibility.
- 4 sale attempts since 7y ago with the ask held roughly flat each time — persistent listings suggest the price (not the market) is what's stuck; bring a comps-based counter.
Risks & watch-outs
- Watch-outs: built in 1932 — expect roof / HVAC / electrical / plumbing capex.
Questions for the listing agent
- Built in 1932 — when were the roof, HVAC, electrical panel, plumbing, and water heater last replaced?
- Is there a deadline driving the sale (1031 exchange, divorce, estate, relocation)? That informs how much negotiation room exists.
- The area grade is low — what's the realistic commute time and amenity access for the typical tenant pool here? Any planned neighborhood developments (good or bad) we should know about?
- What's the average days-on-market for RENTAL listings here right now (not sales)? A rising rental-DOM trend means longer vacancies and softer asking-rent achievability than the comps imply.
- What's the recent tenant-quality profile in this submarket — average credit score on applications, eviction rate, late-payment / NSF rate, and stable-employment percentage? A property-management company in the area should have these aggregated.
- How much new for-sale + rental construction is in the pipeline within 1–3 miles? Heavy new supply typically softens prices + rents 12–24 months out; constrained supply supports both.
Investment metrics
- 1% rule
- 4.24% ✓
- Cap rate
- 37.85%
- Cash-on-cash
- 112.70%
- DSCR
- 6.01
- GRM
- 2.0
CMA / ARV
- ARV (median comp)
- $173,196
- List price
- $30,000
- Delta
- -82.68%
- Verdict
- UNDERPRICED
- Comps
- 20 within 1.0 mi
Show comp detail 12 sales within ~0.75 mi
| Address | Dist | Beds/Ba | Sqft | Sold | Price | $/sf | Match |
|---|---|---|---|---|---|---|---|
| 422 N Columbus St | 0.00mi | 2/1.0 | 1,400 (0%) | 1mo | $30,000 | $21 | 100 |
| 348 S Stadium Dr | 0.23mi | 3/1.0 (+1) | 1,388 (-1%) | 6mo | $220,000 | $159 | 78 |
| 244 Edison Blvd | 0.39mi | 3/1.0 (+1) | 1,395 (-0%) | 3mo | $205,900 | $148 | 74 |
| 513 Redbud Ln | 0.37mi | 3/2.0 (+1) | 1,425 (+2%) | 4mo | $244,900 | $172 | 68 |
| 230 Hayes Ave | 0.33mi | 3/2.0 (+1) | 1,344 (-4%) | 8mo | $230,000 | $171 | 62 |
| 470 Marshall Dr | 0.32mi | 3/1.5 (+1) | 1,296 (-7%) | 9mo | $198,000 | $153 | 58 |
| 273 Edison Blvd | 0.35mi | 3/1.5 (+1) | 1,568 (+12%) | 3mo | $235,000 | $150 | 54 |
| 137 Pleasant St | 0.66mi | 3/1.0 (+1) | 1,440 (+3%) | 7mo | $200,000 | $139 | 54 |
| 758 E Main St | 0.34mi | 3/1.0 (+1) | 1,220 (-13%) | 8mo | $60,000 | $49 | 51 |
| 214 Corwin Ave | 0.48mi | 3/1.5 (+1) | 1,546 (+10%) | 7mo | $235,000 | $152 | 48 |
| 1293 E Main St | 0.75mi | 3/1.0 (+1) | 1,274 (-9%) | 4mo | $160,000 | $126 | 42 |
| 745 Doral Dr | 0.51mi | 3/2.0 (+1) | 1,585 (+13%) | 4mo | $285,900 | $180 | 42 |
Match score weights: distance 35% · size 25% · config 20% · recency 20%. Top-matched comps best support the ARV.
Projected returns pro-forma
-3.0% appreciation · 5.48% rent growth · sell at horizon
- IRR
- —
- Equity multiple
- 6.79×
- Total profit
- $48,660
- Equity at exit
- $4,473
- IRR
- —
- Equity multiple
- 15.43×
- Total profit
- $121,216
- Equity at exit
- $2,594
Cash invested: $8,400 (down + closing). Projections, not guarantees.
Landlord ↔ Tenant lean methodology
- Overall (STATE)
- 73 Landlord-Friendly
- State Ohio
- 73 Landlord-Friendly · R+6
- County
- — inherits STATE
- City
- — inherits STATE
ZIP-level market 45385
- Rents YoY
- 5.5%
- Active inventory
- 240
- Price-to-rent
- 2.0×
Monthly cashflow live
- Estimated rent
- $1,272 high interval (Pro) →
- Mortgage (P&I)
- −$157
- Tax from tax record
- −$46 /mo · $558/yr
- Insurance
- −$12
- HOA
- −$0
- Vacancy / Maint / Mgmt
- −$267
- Net cashflow
- $789
Break-even live
Sensitivity live
| Price | -10% $806 | -5% $797 | +0% $789 | +5% $780 | +10% $772 |
|---|---|---|---|---|---|
| Rent | -10% $688 | -5% $739 | +0% $789 | +5% $839 | +10% $889 |
| Rate | -1.0pp $804 | -0.5pp $796 | base $789 | +0.5pp $781 | +1.0pp $773 |
UW: 25.0% down · 7.5% · 30yr · 1.5% tax · 5.0% vac · 8.0% maint · 8.0% mgmt
Financing live
Cash to close
- Down payment
- $7,500
- Closing costs
- $900
- Reserves months
- —
- Total cash needed
- —
Loan-product check · same deal, 3 products live
Conventional
25% down · 7.5% · 30yr
- Down + closing
- —
- Monthly P&I
- —
- Monthly cashflow
- —
- DSCR
- —
- Eligible?
- —
Personal DTI + credit; lowest rate.
DSCR
20% down · 8.5% · 30yr
- Down + closing
- —
- Monthly P&I
- —
- Monthly cashflow
- —
- DSCR
- —
- Eligible?
- —
No personal income docs; deal must DSCR.
Hard money
10% down · 12.0% · 12mo
- Down + closing
- —
- Monthly P&I
- —
- Monthly cashflow
- —
- DSCR
- —
- Eligible?
- —
Short-term bridge; refi at stabilization.
Rent comps 8 comps
| Address | Beds | Baths | Sqft | Rent | $/sqft | DOM | Units | Dist |
|---|---|---|---|---|---|---|---|---|
| 398 N Columbus St Xenia, OH | 2.0 | 1.0 | 1001 | $1,195 | $1.19 | 4d | 1 | 0.03mi |
| 52 N Collier St Xenia, OH | 2.0 | 1.0 | 900 | $1,050 | $1.17 | 13d | 1 | 0.44mi |
| 48 N Collier St Xenia, OH | 2.0 | 1.0 | 900 | $1,050 | $1.17 | 23d | 1 | 0.45mi |
| 85 W 2nd St Unit 4 Xenia, OH | 1.0 | 1.0 | 932 | $790 | $0.85 | 4d | 1 | 0.72mi |
| 655 Eavey St Xenia, OH | 3.0 | 1.0 | 1040 | $1,495 | $1.44 | 13d | 1 | 0.89mi |
| 329 Cincinnati Ave Xenia, OH | 3.0 | 1.5 | 1866 | $2,300 | $1.23 | 25d | 1 | 1.08mi |
| 451 Cincinnati Ave Xenia, OH | 3.0 | 1.0 | 1024 | $1,275 | $1.25 | 16d | 1 | 1.19mi |
| 87 Poe Ln Xenia, OH | 3.0 | 1.0 | 912 | $1,400 | $1.54 | 4d | 1 | 1.46mi |
Listing history 9 events
-
2026-05-11$30,000 Active 947-char remark
-
2025-09-15soldstatus $21,000 Closed 273-char remark
Show marketing remark (273 chars)
This one is for the experienced handy investor, Property had some major water damage (missing roof), priced to allow for a lot of repairs. This project is not for everyone. SELLING AS IS. Buyer and agent must sign hold harmless letter if they want to walk through property.
-
2025-08-28status Pending 273-char remark
Show marketing remark (273 chars)
This one is for the experienced handy investor, Property had some major water damage (missing roof), priced to allow for a lot of repairs. This project is not for everyone. SELLING AS IS. Buyer and agent must sign hold harmless letter if they want to walk through property.
-
2025-08-26status Active 273-char remark
Show marketing remark (273 chars)
This one is for the experienced handy investor, Property had some major water damage (missing roof), priced to allow for a lot of repairs. This project is not for everyone. SELLING AS IS. Buyer and agent must sign hold harmless letter if they want to walk through property.
-
2025-08-21status Pending 273-char remark
Show marketing remark (273 chars)
This one is for the experienced handy investor, Property had some major water damage (missing roof), priced to allow for a lot of repairs. This project is not for everyone. SELLING AS IS. Buyer and agent must sign hold harmless letter if they want to walk through property.
-
2025-08-06$29,000 Active 273-char remark
Show marketing remark (273 chars)
This one is for the experienced handy investor, Property had some major water damage (missing roof), priced to allow for a lot of repairs. This project is not for everyone. SELLING AS IS. Buyer and agent must sign hold harmless letter if they want to walk through property.
-
2019-11-16historical
-
2019-04-24$25,000 Active
-
1993-08-27soldstatus $18,000
ⓘ Source: listings_history table (triggers on properties + properties_extension) + one-shot
backfill from property_details.listing_events for pre-trigger history.
Tax reassessment forecast OH · Partial reset (capped growth)
- Current annual tax
- $558 · $46/mo
- Projected year-2 tax
- $558 · $46/mo
- Expected delta
- $0/yr ($0/mo · 0.0%)
ⓘ Screening estimate from a state-policy table — verify with the county assessor before closing.
Climate risk First Street
- Flood 1/10 Low FEMA zone X (unshaded) · 0% chance over 30 yrs
- Wildfire 1/10 Low
- Heat 3/10 Moderate 7 d/yr ≥99°F today · 18 d/yr by 30 yrs out
- Wind 2/10 Low 100% chance of damaging wind over 30 yrs
- Air quality 3/10 Moderate 3 unhealthy d/yr today · 3 by 30 yrs out
Nearby sold comps map
Loading sold comps map…
Walkable amenities ~0.75 mi
Loading nearby amenities…
Taxation est. · year 1
- Rental income
- $15,268
- − Mortgage interest
- −$1,680
- − Property taxes
- −$558
- − Insurance
- −$150
- − Repairs & maintenance
- −$1,221
- − Management
- −$1,221
- − Depreciation
- −$873
- Taxable income
- $9,564
- Est. tax owed @ 24.0%
- −$2,295
- After-tax cash flow
- $7,171/yr
For passive investors: Depreciation is non-cash, so a rental often shows a tax loss while cash-flowing — sheltering income. Rental losses are passive: they offset passive income freely, and up to $25,000/yr can offset ordinary (W-2) income if you actively participate and your MAGI is under $100k (phasing out to $0 by $150k); unused losses carry forward. On sale, claimed depreciation is recaptured at up to 25%, and gains may owe capital-gains tax (a 1031 exchange can defer both). Figures are a year-1 estimate at your 24.0% rate — not tax advice; consult a CPA.
Schools (NCES district)
- District
- Xenia Community City
- NCES district ID
- 3904515
- Math proficiency
- 42% ▼ -16.00%
- Reading proficiency
- 53% ▼ -5.00%
- Median HH income
- $46,206
- Composite
- 40.31/100
- National rank
- #3752
- State rank
- #478 of 656 in OH
Livability — Xenia
- Score
- 75/100
- State rank
- #244
- US rank
- #3892
Category grades
Schools grade is shown separately in the Schools card above.
Census & demographics
- Census place
- Xenia, OH
- County
- Greene County · 132,120 people
- City population
- 40,617
- Metro
- Dayton-Kettering, OH
- Population (ZIP)
- 40,617
- Household income
- $76,564
- Rent vs Own
- Severe rent burden
- 906.0
Population outlook (Greene County) Hauer SSP2
- Today (2025)
- 170,301 people
- By 2030
- 171,840 · +0.9%
- By 2040
- 171,408 · +0.7%
- By 2050
- 167,806 · -1.5%
- By 2075
- 154,430 · -9.3%
- By 2100
- 138,669 · -18.6%
Race, ethnicity, and origin ACS 2023
- Neighborhood character
- Predominantly White (83%)
- Race & ethnicity
- White 83% Two or more races 6% Black 6% Hispanic / Latino 2% Asian 2%
- Common ancestry
- Slovak 3% Italian 2% Serbian 1%
- Foreign-born
- 3% · Canada
- Languages at home
- 96% English-only · Other Indo-European 1% Spanish 1%
Political lean MEDSL · Greene
- 2024 margin
- R (+19.8) · D 39.5% · R 59.3% · Other 1.2%
- 2008→2024 swing
- -1.4pp toward R · 2008: -18.4pp · 2024: -19.8pp
- All cycles
- 2024: R+19.8 2020: R+19.5 2016: R+24.5 2012: R+21.8 2008: R+18.4
Not yet ingested
- Civics
- —
Market trends
- HPI YoY
- ▼ -158.15%
- Current HPI
- 239.0473
- Rent YoY
- ▲ 5.48%
- Metro
- Dayton-Kettering, OH
- State GDP YoY
- ▲ 1.98%
- F500 in state
- 48
Industry mix (Fortune 500 HQ in OH)
| Industry | F500 HQs | Revenue |
|---|---|---|
| Insurance | 3 | $145B |
|
||
| Industrial Machinery | 3 | $49B |
|
||
| Financial Services | 3 | $24B |
|
||
| Consumer Goods | 2 | $93B |
|
||
| Aerospace / Defense | 2 | $47B |
|
||
| Utilities | 2 | $33B |
|
||
Price history
+66.7% since first listed11 events — show timeline
- 2026-06-05 Sold (MLS) $30,000 Dayton MLS
- 2026-05-27 Pending — Dayton MLS
- 2026-05-11 Listed $30,000 Dayton MLS
- 2025-09-15 Sold (MLS) $21,000 Dayton MLS
- 2025-08-28 Pending — Dayton MLS
- 2025-08-26 Relisted — Dayton MLS
- 2025-08-21 Pending — Dayton MLS
- 2025-08-06 Listed $29,000 Dayton MLS
- 2019-11-16 Listing Removed — Dayton MLS
- 2019-04-24 Listed $25,000 Dayton MLS
- 1993-08-27 Sold (Public Records) $18,000 Public Records
Property tax history
+0.5%/yrLatest (2025): $558 · +1.8% YoY. Source: county tax records.
Cash-flow waterfall
monthlySold comps — $/sqft
last 12 mo · ≤1 miLoading sold comps…