 Multi-family
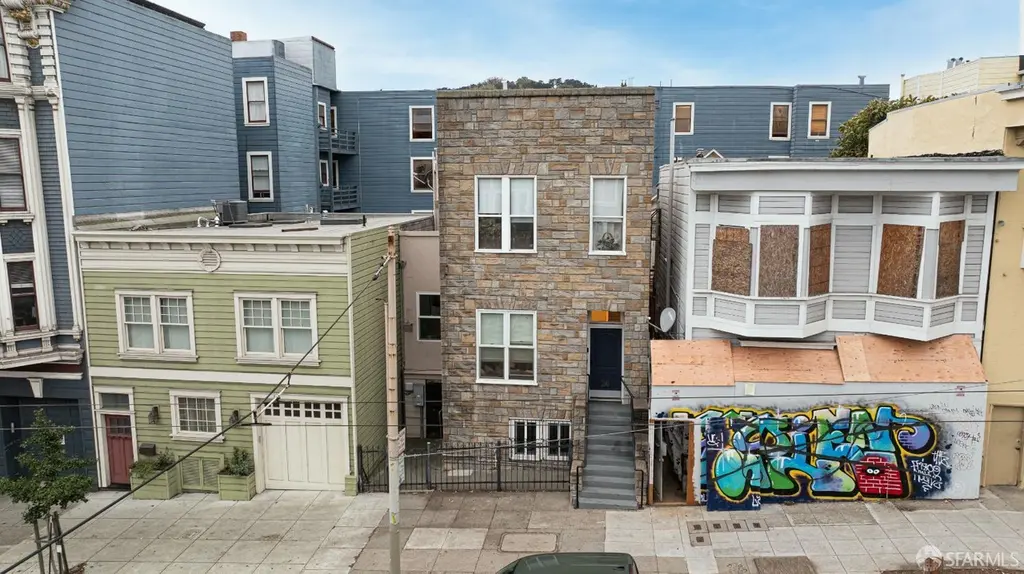
26 Church St · San Francisco, CA
Flood risk 1/10 · Minimal
- FEMA flood zone
- X (unshaded)
- Chance of flooding over 30 yrs
- 0.0%
- Est. flood insurance / yr
- $507 – $1,088
Fire risk 1/10 · Minimal
- Est. fire insurance / yr
- $659 – $1,223
Heat risk 2/10 · Minimal
- Hot days now (above 78°F)
- 8 days/yr
- Hot days in 30 yrs
- 18 days/yr
Wind risk 1/10 · Minimal
- Chance of severe wind over 30 yrs
- —
Air-quality risk 8/10 · Major
- Unhealthy air days now
- 15 days/yr
- Unhealthy air days in 30 yrs
- 15 days/yr
Risk factors via First Street. Map © Google.
Why this score? — see what drove the B grade
The composite is a weighted blend of 9 inputs, each scored 0–100. Each bar is that input's sub-score; the figure is the points it added to the 100-point composite (weight × sub-score).
- Cash flow +22.4/30.0
- ARV discount +12.2/15.0
- Appreciation +9.8/10.0
- DSCR +7.2/10.0
- Rent growth +5.0/5.0
- Schools +5.0/10.0
- 1% rule +4.7/10.0
- Livability +3.8/5.0
- Condition / age +2.5/5.0
$1,600,000
🖨 Deal sheet 📄 Offer letter ✓ Due diligence
Multi-family units
County records classify this as Multi-Family (5+ Unit). Listing-text estimate: 1 unit. estimate disagrees with records
5+ unit building — per-unit beds/baths from public records are typically unavailable; the breakdown below (if shown) is an estimate from the listing text.
Listing remarks MLS
26 Church Street is a 2,950 square foot multifamily property ideally situated at the intersection of Duboce Triangle, The Castro, and Hayes Valleythree of San Francisco's most desirable neighborhoods. Surrounded by the charm of the tree-lined streets and stunning views of the city, this property offers a unique opportunity to be part of one of San Francisco's coveted neighborhoods. The property benefits from its close proximity to Duboce Park, neighborhood retail, cafs, and excellent public transit options. The property is comprised of one (1) - studio, one (1) junior one bedroom and two (2) one bedroom apartment units. The building features a storage unit, a RUBS (Ratio Utility Billing System) for utilities, and well-maintained common areas, offering both efficiency and value for ownership. This central location, combined with consistent tenant demand and walkable amenities, makes 26 Church Street a stable, long-term investment opportunity in a highly sought-after rental corridor.
Key facts
- 1,995 sq ft lot
- Built 1880
- Listed 65 days
Neighborhood map
What this means for you Summary
Snapshot
- This is a 5-bed/5.0-bath multifamily listed at $1.60M.
Deal economics
- At list price, monthly cash flow is $3k ($32k/yr) — positive.
- The deal already cash-flows at list — no discount required.
- To meet the 1% rule (rent ≥ 1% of price), the offer needs to be $1.55M (3.3% below list).
- Recommended offer: $1.50M (6.0% below list) — sets the bar for market timing.
- Cap rate 8.3% vs local median 2.1% in San Francisco — top-decile yield for the area; either an underpriced asset or a hidden risk that comps aren't pricing in. Stress-test before assuming the spread holds.
Location & tenants
- Location reads 76/100 on livability (#90 in CA, #3,143 nationally) — a middle-class / working-renter tenant base. Strengths: amenities A+, commute A+, employment A+; Watch: crime F, cost of living F.
- San Francisco Unified (urban): math 50% / reading 56% proficiency, ranked #322 of 1,400 in CA (top 23%) — acceptable for families but not a draw, mixed tenant base, ~2y average lease.
- Market conditions: Rents rising fast (+14.4%/yr); 116 active listings in the ZIP; 5 comparable units currently listed for rent nearby; rentals at typical pace (median 19d on market — plan ~3-4 weeks tenant-placement turnaround); 40% of comp listings sitting > 30 days — soft ceiling on asking rent; high-income renter base; 750 units permitted in San Francisco County in 2024 (688 in 5+ unit buildings).
- At $15,475/mo this rent would consume 91% of the median local household income ($204k/yr) (locally 1336% of renters already pay >50% of income on rent) — very limited rent-growth headroom before tenants either downsize or default.
Forward outlook
- In year one you build about $163k of equity ($11k loan paydown + $152k appreciation (9.5% local appreciation)).
- San Francisco County population projected at +39% by 2050 — long-run rental-demand tailwind backs the buy-and-hold thesis.
- At projected returns (9.5% appreciation + 8.0% rent growth), your $448k cash investment doubles in ~3 years — after that, you're playing with house money.
- By year 2, paydown + projected appreciation supports a ~$262k cash-out refi (75% LTV) — recoverable capital for the next deal without selling this one.
Negotiation context
- It's been on market 65 days — a 6% lower offer ($1.50M) is reasonable based on typical stale-listing flexibility.
- 8 sale attempts since 33y ago; this cycle's ask has dropped $95k (6%) from the opening price — seller is motivated, your offer sets the floor, not the list.
- Current owner paid $1.15M; 39% above their basis — modest negotiation headroom, anchor on the comps not their cost.
Risks & watch-outs
- Watch-outs: built in 1880 — expect roof / HVAC / electrical / plumbing capex.
Questions for the listing agent
- It's been on market 65 days. Have you received any prior offers? Is the seller open to a 6% concession, seller financing, or rate buy-down credit?
- Built in 1880 — when were the roof, HVAC, electrical panel, plumbing, and water heater last replaced?
- Why hasn't it sold? Are there any deal-killer items the seller is aware of (foundation, flood, title, zoning, code violations)?
- Is there a deadline driving the sale (1031 exchange, divorce, estate, relocation)? That informs how much negotiation room exists.
- Schools are B-rated — typically a magnet for longer-tenancy family renters. What's the average tenant stay here, and is there a school-zone premium baked into asking?
- Crime grade is F in this area — have there been break-ins, vandalism, or insurance claims at this property in the last 3 years? What carrier currently insures it and at what premium?
- What's the average days-on-market for RENTAL listings here right now (not sales)? A rising rental-DOM trend means longer vacancies and softer asking-rent achievability than the comps imply.
- What's the recent tenant-quality profile in this submarket — average credit score on applications, eviction rate, late-payment / NSF rate, and stable-employment percentage? A property-management company in the area should have these aggregated.
- How much new apartment / multifamily construction is in the pipeline within 1–3 miles? Heavy new supply (>2% of stock underway) typically softens rents 12–24 months out; light construction supports rent growth.
Investment metrics
- 1% rule
- 0.97% ✗
- Cap rate
- 8.29%
- Cash-on-cash
- 7.13%
- DSCR
- 1.32
- GRM
- 8.6
CMA / ARV
- ARV (median comp)
- $1,788,446
- List price
- $1,600,000
- Delta
- -10.54%
- Verdict
- UNDERPRICED
- Comps
- 20 within 1.0 mi
Show comp detail 12 sales within ~0.75 mi
| Address | Dist | Beds/Ba | Sqft | Sold | Price | $/sf | Match |
|---|---|---|---|---|---|---|---|
| 1059 Haight St | 0.56mi | 5/4.0 | 2,630 (-2%) | 8mo | $1,500,000 | $570 | 60 |
| 50-52 Ramona Ave | 0.29mi | 5/2.0 | 2,950 (+10%) | 1mo | $1,650,000 | $559 | 57 |
| 72 Pearl St | 0.29mi | 4/1.0 (-1) | 2,830 (+6%) | 6mo | $1,685,000 | $595 | 52 |
| 3640-3642 17th St | 0.48mi | 4/1.0 (-1) | 2,595 (-3%) | 3mo | $2,800,000 | $1,079 | 50 |
| 39-41 Dolores Ter | 0.55mi | 4/3.0 (-1) | 2,477 (-8%) | 1mo | $4,215,000 | $1,702 | 48 |
| 2275 15th St | 0.42mi | 6/3.0 (+1) | 2,908 (+8%) | 12mo | $2,605,000 | $896 | 43 |
| 171-73 Buena Vista Ave | 0.48mi | 4/3.0 (-1) | 2,995 (+12%) | 4mo | $3,050,000 | $1,018 | 42 |
| 943-945 Haight St | 0.46mi | 4/4.0 (-1) | 3,040 (+13%) | 12mo | $2,500,000 | $822 | 37 |
| 48 Sycamore St | 0.70mi | 4/4.0 (-1) | 2,950 (+10%) | 7mo | $1,703,000 | $577 | 36 |
| 29-31 Collingwood St | 0.66mi | 5/3.0 | 2,400 (-10%) | 15mo | $1,800,000 | $750 | 31 |
| 527-529 Noe St | 0.66mi | 6/4.0 (+1) | 3,000 (+12%) | 14mo | $2,150,000 | $717 | 28 |
| 431-433 Broderick St | 0.63mi | 4/3.0 (-1) | 3,050 (+14%) | 10mo | $2,600,000 | $852 | 26 |
Match score weights: distance 35% · size 25% · config 20% · recency 20%. Top-matched comps best support the ARV.
Projected returns pro-forma
9.51% appreciation · 8.0% rent growth · sell at horizon
- IRR
- 30.4%
- Equity multiple
- 3.38×
- Total profit
- $1,068,325
- Equity at exit
- $1,384,247
- IRR
- 28.0%
- Equity multiple
- 8.15×
- Total profit
- $3,201,024
- Equity at exit
- $2,926,377
Cash invested: $448,000 (down + closing). Projections, not guarantees.
Landlord ↔ Tenant lean methodology
- Overall (CITY)
- 0 Strongly Tenant-Friendly
- State California
- 18 Strongly Tenant-Friendly · D+13
- County
- — inherits STATE
- City San Francisco
- 0 Strongly Tenant-Friendly · D+57
ZIP-level market 94114
- Home prices YoY
- 4.4%
- Rents YoY
- 14.4%
- Active inventory
- 116
- Price-to-rent
- 25.8×
Monthly cashflow live
- Estimated rent
- $15,475 high interval (Pro) →
- Mortgage (P&I)
- −$8,391
- Tax from tax record
- −$506 /mo · $6,070/yr
- Insurance
- −$667
- HOA
- −$0
- Vacancy / Maint / Mgmt
- −$3,250
- Net cashflow
- $2,662
Break-even live
3-unit breakdown (identical units grouped — click to expand)
| Units | Beds | Baths | Est. rent |
|---|---|---|---|
| 3× units | 1 | 1 | $15,474 |
| #1 | 1 | 1 | $5,158 |
| #2 | 1 | 1 | $5,158 |
| #3 | 1 | 1 | $5,158 |
| Total (3 units) | $15,475 | ||
UW: 25.0% down · 7.5% · 30yr · 1.5% tax · 5.0% vac · 8.0% maint · 8.0% mgmt
Financing live
Cash to close
- Down payment
- $400,000
- Closing costs
- $48,000
- Reserves months
- —
- Total cash needed
- —
Loan-product check · same deal, 3 products live
Conventional
25% down · 7.5% · 30yr
- Down + closing
- —
- Monthly P&I
- —
- Monthly cashflow
- —
- DSCR
- —
- Eligible?
- —
Personal DTI + credit; lowest rate.
DSCR
20% down · 8.5% · 30yr
- Down + closing
- —
- Monthly P&I
- —
- Monthly cashflow
- —
- DSCR
- —
- Eligible?
- —
No personal income docs; deal must DSCR.
Hard money
10% down · 12.0% · 12mo
- Down + closing
- —
- Monthly P&I
- —
- Monthly cashflow
- —
- DSCR
- —
- Eligible?
- —
Short-term bridge; refi at stabilization.
Rent comps 5 comps
| Address | Beds | Baths | Sqft | Rent | $/sqft | DOM | Units | Dist |
|---|---|---|---|---|---|---|---|---|
| 471 S Van Ness Ave San Francisco, CA | 4.0 | 3.0 | 2140 | $11,000 | $5.14 | 15d | 1 | 0.70mi |
| 143 Corbett Ave San Francisco, CA | 4.0 | 4.0 | 2500 | $10,500 | $4.20 | 44d | 1 | 0.90mi |
| 701 Castro St San Francisco, CA | 5.0 | 4.0 | 3300 | $22,995 | $6.97 | 18d | 1 | 0.91mi |
| 753 Castro St San Francisco, CA | 4.0 | 3.0 | 2467 | $10,950 | $4.44 | 44d | 1 | 0.96mi |
| 2577 Post St San Francisco, CA | 4.0 | 3.0 | 2754 | $15,000 | $5.45 | 3d | 1 | 1.25mi |
Listing history 24 events
-
2026-06-18days on market $1,600,000 Active 65 DOM
-
2026-06-17days on market $1,600,000 Active 64 DOM
-
2026-06-16days on market $1,600,000 Active 63 DOM
-
2026-06-15days on market $1,600,000 Active 62 DOM
-
2026-06-13days on market $1,600,000 Active 60 DOM
-
2026-06-13days on market $1,600,000 Active 59 DOM
-
2026-06-09days on market $1,600,000 Active 56 DOM
-
2026-06-08days on market $1,600,000 Active 55 DOM
-
2026-06-07days on market $1,600,000 Active 54 DOM
-
2026-06-04days on market $1,600,000 Active 51 DOM
-
2026-06-03days on market $1,600,000 Active 50 DOM
-
2026-06-02days on market $1,600,000 Active 49 DOM
-
2026-06-01days on market $1,600,000 Active 48 DOM
-
2026-05-31days on market $1,600,000 Active 47 DOM
-
2026-04-14$1,695,000 Active 996-char remark
Show marketing remark (996 chars)
26 Church Street is a 2,950 square foot multifamily property ideally situated at the intersection of Duboce Triangle, The Castro, and Hayes Valleythree of San Francisco's most desirable neighborhoods. Surrounded by the charm of the tree-lined streets and stunning views of the city, this property offers a unique opportunity to be part of one of San Francisco's coveted neighborhoods. The property benefits from its close proximity to Duboce Park, neighborhood retail, cafs, and excellent public transit options. The property is comprised of one (1) - studio, one (1) junior one bedroom and two (2) one bedroom apartment units. The building features a storage unit, a RUBS (Ratio Utility Billing System) for utilities, and well-maintained common areas, offering both efficiency and value for ownership. This central location, combined with consistent tenant demand and walkable amenities, makes 26 Church Street a stable, long-term investment opportunity in a highly sought-after rental corridor.
-
2025-12-22status Active
-
2025-12-16historical Contingent - No Show
-
2025-12-01$1,700,000 Active
-
2025-07-17soldstatus $1,150,000
-
2025-03-26$1,295,000 Active
-
1995-05-01$239,500
-
1994-09-26$289,000
-
1994-06-01$349,000
-
1993-06-25$375,000
ⓘ Source: listings_history table (triggers on properties + properties_extension) + one-shot
backfill from property_details.listing_events for pre-trigger history.
Tax reassessment forecast CA · Resets to sale price
- Current annual tax
- $6,070 · $506/mo
- Projected year-2 tax
- $12,160 · $1,013/mo
- Expected delta
- +$6,090/yr (+$508/mo · 100.3%)
ⓘ Screening estimate from a state-policy table — verify with the county assessor before closing.
Climate risk First Street
- Flood 1/10 Low FEMA zone X (unshaded) · 0% chance over 30 yrs
- Wildfire 1/10 Low
- Heat 2/10 Low 8 d/yr ≥78°F today · 18 d/yr by 30 yrs out
- Wind 1/10 Low
- Air quality 8/10 Severe 15 unhealthy d/yr today · 15 by 30 yrs out
Nearby sold comps map
Loading sold comps map…
Walkable amenities ~0.75 mi
Loading nearby amenities…
Taxation est. · year 1
- Rental income
- $185,700
- − Mortgage interest
- −$89,625
- − Property taxes
- −$6,070
- − Insurance
- −$8,000
- − Repairs & maintenance
- −$14,856
- − Management
- −$14,856
- − Depreciation
- −$46,545
- Taxable income
- $5,748
- Est. tax owed @ 24.0%
- −$1,379
- After-tax cash flow
- $30,567/yr
For passive investors: Depreciation is non-cash, so a rental often shows a tax loss while cash-flowing — sheltering income. Rental losses are passive: they offset passive income freely, and up to $25,000/yr can offset ordinary (W-2) income if you actively participate and your MAGI is under $100k (phasing out to $0 by $150k); unused losses carry forward. On sale, claimed depreciation is recaptured at up to 25%, and gains may owe capital-gains tax (a 1031 exchange can defer both). Figures are a year-1 estimate at your 24.0% rate — not tax advice; consult a CPA.
Schools (NCES district)
- District
- San Francisco Unified
- NCES district ID
- 0634410
- Math proficiency
- 50% ▬ 0.00%
- Reading proficiency
- 56% ▲ 1.00%
- Median HH income
- $81,249
- Composite
- 50.14/100
- National rank
- #4088
- State rank
- #322 of 1400 in CA
Livability — San Francisco
- Score
- 76/100
- State rank
- #90
- US rank
- #3143
Category grades
Schools grade is shown separately in the Schools card above.
Census & demographics
- Census place
- San Francisco, CA
- County
- San Francisco County · 827,552 people
- City population
- 827,552
- Metro
- San Francisco-Oakland-Berkeley, CA
- Population (ZIP)
- 33,020
- Household income
- $204,134
- Rent vs Own
- Severe rent burden
- 1336.0
Population outlook (San Francisco County) Hauer SSP2
- Today (2025)
- 1,030,936 people
- By 2030
- 1,110,409 · +7.7%
- By 2040
- 1,270,010 · +23.2%
- By 2050
- 1,435,001 · +39.2%
- By 2075
- 1,779,074 · +72.6%
- By 2100
- 1,966,767 · +90.8%
Race, ethnicity, and origin ACS 2023
- Neighborhood character
- Predominantly White (65%)
- Race & ethnicity
- White 65% Asian 14% Two or more races 12% Hispanic / Latino 10% Black 2%
- Hispanic origin (detail)
- Mexican 5%
- Common ancestry
- Lithuanian 4% Italian 4% Romanian 3%
- Foreign-born
- 20% · Canada, China, Vietnam
- Languages at home
- 77% English-only · Spanish 6% Chinese 4% Other Indo-European 4%
Political lean MEDSL · San Francisco
- 2024 margin
- Solid D (+64.8) · D 80.3% · R 15.5% · Other 4.1%
- 2008→2024 swing
- -5.7pp toward R · 2008: 70.5pp · 2024: 64.8pp
- All cycles
- 2024: D+64.8 2020: D+72.5 2016: D+76.1 2012: D+70.2 2008: D+70.5
Not yet ingested
- Civics
- —
Market trends
- HPI YoY
- ▲ 9.51%
- Current HPI
- 223.6988
- Rent YoY
- ▲ 14.40%
- Metro
- San Francisco-Oakland-Berkeley, CA
- State GDP YoY
- ▲ 3.21%
- F500 in state
- 116
Industry mix (Fortune 500 HQ in CA)
| Industry | F500 HQs | Revenue |
|---|---|---|
| Technology | 27 | $1,492B |
|
||
| Financial Services | 3 | $174B |
|
||
| Retail | 3 | $44B |
|
||
| Insurance | 3 | $26B |
|
||
| Media / Entertainment | 2 | $115B |
|
||
| Pharmaceuticals / Biotech | 2 | $62B |
|
||
Price history
+352.0% since first listed10 events — show timeline
- 2026-04-14 Listed $1,695,000 San Francisco MLS
- 2025-12-22 Relisted — San Francisco MLS
- 2025-12-16 Contingent — San Francisco MLS
- 2025-12-01 Listed $1,700,000 San Francisco MLS
- 2025-07-17 Sold (Public Records) $1,150,000 Public Records
- 2025-03-26 Listed $1,295,000 San Francisco MLS
- 1995-05-01 Listed $239,500 San Francisco MLS
- 1994-09-26 Listed $289,000 San Francisco MLS
- 1994-06-01 Listed $349,000 San Francisco MLS
- 1993-06-25 Listed $375,000 San Francisco MLS
Property tax history
+2.3%/yrLatest (2025): $6,070 · +3.1% YoY. Source: county tax records.
Cash-flow waterfall
monthlySold comps — $/sqft
last 12 mo · ≤1 miLoading sold comps…