52 Cr 2602 · Rocky Mound, TX
Flood risk 1/10 · Minimal
- FEMA flood zone
- —
- Chance of flooding over 30 yrs
- 0.0%
- Est. flood insurance / yr
- —
Fire risk 5/10 · Moderate
- Est. fire insurance / yr
- $1,222 – $2,270
Heat risk 7/10 · Major
- Hot days now (above 111°F)
- 7 days/yr
- Hot days in 30 yrs
- 23 days/yr
Wind risk 6/10 · Moderate
- Chance of severe wind over 30 yrs
- 27.0%
Air-quality risk 2/10 · Minimal
- Unhealthy air days now
- 0 days/yr
- Unhealthy air days in 30 yrs
- 1 days/yr
Risk factors via First Street. Map © Google.
Why this score? — see what drove the B- grade
The composite is a weighted blend of 9 inputs, each scored 0–100. Each bar is that input's sub-score; the figure is the points it added to the 100-point composite (weight × sub-score).
- Cash flow +30.0/30.0
- 1% rule +10.0/10.0
- DSCR +10.0/10.0
- ARV discount +7.5/15.0
- Schools +4.1/10.0
- Rent growth +2.5/5.0
- Condition / age +2.5/5.0
- Livability +2.1/5.0
- Appreciation +0.0/10.0
$75,000
🖨 Deal sheet (PDF) 📄 Offer letter ✓ Due diligence
Listing remarks MLS
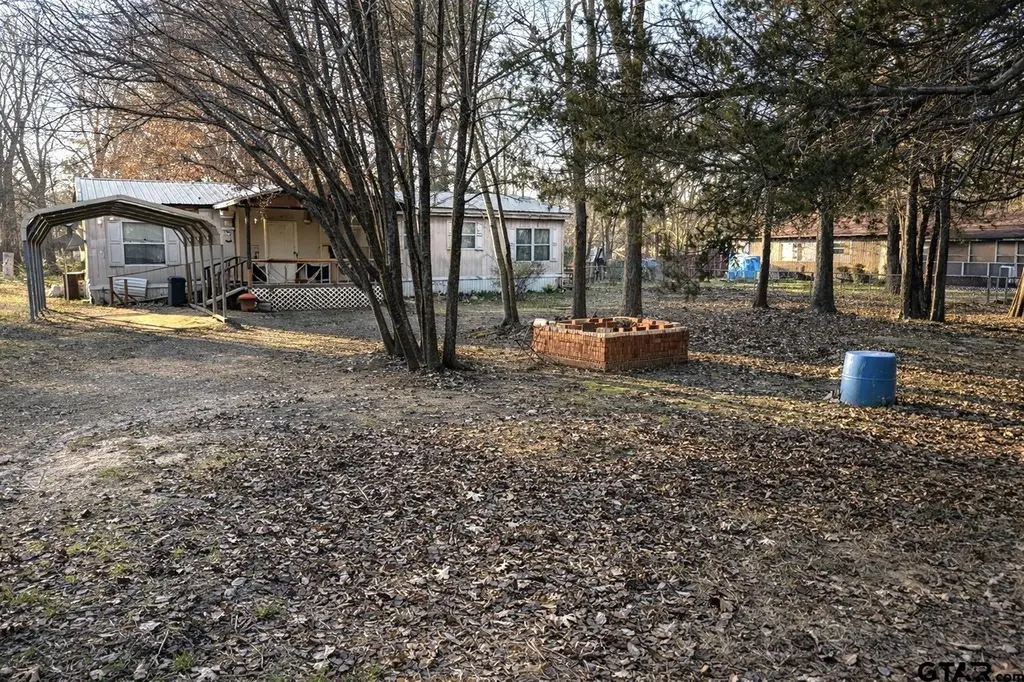
3BR/2BA Manufactured Home in Thunderbird Point – Lake Bob Sandlin Well-maintained 3-bedroom, 2-bath manufactured home located in the Thunderbird Point subdivision at Lake Bob Sandlin. This home features a spacious kitchen with ample cabinet space, oversized bedrooms, and a large primary bath. Second bathroom features a handicap-accessible shower. Enjoy relaxing on the covered front porch in this peaceful lake community. Residents have access to a private boat ramp, community swimming pool, and volunteer fire department. Ideal for full-time living or a weekend lake retreat.
Key facts
- Covered front porch
- Spacious kitchen
- Private boat ramp
Tags
Neighborhood map
What this means for you Summary
Snapshot
- This is a 3-bed/2.0-bath manufactured listed at $75k.
Deal economics
- At list price, monthly cash flow is $938 ($11k/yr) — positive.
- The deal already cash-flows at list — no discount required.
- Meets the 1% rule at list price ($2k rent vs $75k).
- Recommended offer: $68k (9.0% below list) — sets the bar for market timing.
- Cap rate 21.3% vs local median 1.1% in Rocky Mound — top-decile yield for the area; either an underpriced asset or a hidden risk that comps aren't pricing in. Stress-test before assuming the spread holds.
Location & tenants
- Location reads 43/100 on livability (#1,576 in TX) — a working-class tenant base; expect higher turnover. Strengths: cost of living A+, crime A; Watch: schools F, amenities F, commute F.
- Pittsburg ISD (town): math 54% / reading 44% proficiency, ranked #216 of 826 in TX (top 26%) — families likely to look elsewhere, expect single-tenant / working-renter base with shorter leases; 68% free/reduced lunch — lower-income household profile, screen leases tightly.
- Market conditions: 313 active listings in the ZIP; 3 units permitted in Camp County in 2024 (0 in 5+ unit buildings).
Forward outlook
- Local home prices are declining (-3.0%/yr); year-one equity from $519 of loan paydown is wiped out by about $2k of value loss. Plan a longer hold.
- Camp County population projected at +13% by 2050 — modest demand growth; plan on rents tracking national, not racing it.
- At projected returns (-3.0% appreciation + 3.0% rent growth), your $21k cash investment doubles in ~3 years — after that, you're playing with house money.
Negotiation context
- It's been on market 116 days — a 9% lower offer ($68k) is reasonable based on typical stale-listing flexibility.
Risks & watch-outs
- Climate carrying-cost: major wind risk, 27% chance of damaging wind over 30y; moderate wildfire risk; extreme-heat days projected 7→23/yr by 2055 (HVAC capex compounding) — expect insurance premiums to compound above CPI over the hold.
Questions for the listing agent
- It's been on market 116 days. Have you received any prior offers? Is the seller open to a 9% concession, seller financing, or rate buy-down credit?
- What does the HOA fee cover, when was the last increase, and are there any pending special assessments or reserve-fund shortfalls?
- Why hasn't it sold? Are there any deal-killer items the seller is aware of (foundation, flood, title, zoning, code violations)?
- Is there a deadline driving the sale (1031 exchange, divorce, estate, relocation)? That informs how much negotiation room exists.
- Schools are F-rated, which usually means shorter tenancies and higher turnover. Who's the typical renter profile here, and what's been the actual vacancy rate?
- What's the average days-on-market for RENTAL listings here right now (not sales)? A rising rental-DOM trend means longer vacancies and softer asking-rent achievability than the comps imply.
- What's the recent tenant-quality profile in this submarket — average credit score on applications, eviction rate, late-payment / NSF rate, and stable-employment percentage? A property-management company in the area should have these aggregated.
- How much new for-sale + rental construction is in the pipeline within 1–3 miles? Heavy new supply typically softens prices + rents 12–24 months out; constrained supply supports both.
Investment metrics
- 1% rule
- 2.43% ✓
- Cap rate
- 21.31%
- Cash-on-cash
- 53.62%
- DSCR
- 3.39
- GRM
- 3.4
CMA / ARV
No comps found within radius.
Projected returns pro-forma
-3.0% appreciation · 3.0% rent growth · sell at horizon
- IRR
- 51.7%
- Equity multiple
- 3.27×
- Total profit
- $47,625
- Equity at exit
- $11,183
- IRR
- 57.1%
- Equity multiple
- 6.64×
- Total profit
- $118,490
- Equity at exit
- $6,485
Cash invested: $21,000 (down + closing). Projections, not guarantees.
Landlord ↔ Tenant lean methodology
- Overall (STATE)
- 87 Strongly Landlord-Friendly
- State Texas
- 87 Strongly Landlord-Friendly · R+5
- County
- — inherits STATE
- City
- — inherits STATE
ZIP-level market 75686
- Home prices YoY
- -21.6%
- Active inventory
- 313
- Price-to-rent
- 3.4×
Monthly cashflow live
- Estimated rent
- $1,821 medium interval (Pro) →
- Mortgage (P&I)
- −$393
- Tax from tax record
- −$55 /mo · $657/yr
- Insurance
- −$31
- HOA
- −$21
- Vacancy / Maint / Mgmt
- −$382
- Net cashflow
- $938
Break-even live
Sensitivity live
| Price | -10% $981 | -5% $960 | +0% $938 | +5% $917 | +10% $896 |
|---|---|---|---|---|---|
| Rent | -10% $794 | -5% $866 | +0% $938 | +5% $1,010 | +10% $1,082 |
| Rate | -1.0pp $976 | -0.5pp $957 | base $938 | +0.5pp $919 | +1.0pp $899 |
UW: 25.0% down · 7.5% · 30yr · 1.5% tax · 5.0% vac · 8.0% maint · 8.0% mgmt
Financing live
Cash to close
- Down payment
- $18,750
- Closing costs
- $2,250
- Reserves months
- —
- Total cash needed
- —
Loan-product check · same deal, 3 products live
Conventional
25% down · 7.5% · 30yr
- Down + closing
- —
- Monthly P&I
- —
- Monthly cashflow
- —
- DSCR
- —
- Eligible?
- —
Personal DTI + credit; lowest rate.
DSCR
20% down · 8.5% · 30yr
- Down + closing
- —
- Monthly P&I
- —
- Monthly cashflow
- —
- DSCR
- —
- Eligible?
- —
No personal income docs; deal must DSCR.
Hard money
10% down · 12.0% · 12mo
- Down + closing
- —
- Monthly P&I
- —
- Monthly cashflow
- —
- DSCR
- —
- Eligible?
- —
Short-term bridge; refi at stabilization.
HOA detail
- Monthly dues
- $21 · $252/yr
- Likely covers
- pool
Listing history 21 events
-
2026-06-21days on market $75,000 Active 116 DOM
-
2026-06-19days on market $75,000 Active 114 DOM
-
2026-06-18days on market $75,000 Active 113 DOM
-
2026-06-17days on market $75,000 Active 112 DOM
-
2026-06-16days on market $75,000 Active 111 DOM
-
2026-06-15days on market $75,000 Active 110 DOM
-
2026-06-14days on market $75,000 Active 108 DOM
-
2026-06-12days on market $75,000 Active 107 DOM
-
2026-06-09days on market $75,000 Active 104 DOM
-
2026-06-08days on market $75,000 Active 103 DOM
-
2026-06-07days on market $75,000 Active 102 DOM
-
2026-06-05days on market $75,000 Active 100 DOM
-
2026-06-03days on market $75,000 Active 98 DOM
-
2026-06-02days on market $75,000 Active 97 DOM
-
2026-06-01days on market $75,000 Active 96 DOM
-
2026-05-31days on market $75,000 Active 95 DOM
-
2026-05-30days on market $75,000 Active 94 DOM
-
2026-05-14price $75,000 585-char remark
Show marketing remark (585 chars)
3BR/2BA Manufactured Home in Thunderbird Point – Lake Bob Sandlin Well-maintained 3-bedroom, 2-bath manufactured home located in the Thunderbird Point subdivision at Lake Bob Sandlin. This home features a spacious kitchen with ample cabinet space, oversized bedrooms, and a large primary bath. Second bathroom features a handicap-accessible shower. Enjoy relaxing on the covered front porch in this peaceful lake community. Residents have access to a private boat ramp, community swimming pool, and volunteer fire department. Ideal for full-time living or a weekend lake retreat.
-
2026-03-25price $85,000 585-char remark
Show marketing remark (585 chars)
3BR/2BA Manufactured Home in Thunderbird Point – Lake Bob Sandlin Well-maintained 3-bedroom, 2-bath manufactured home located in the Thunderbird Point subdivision at Lake Bob Sandlin. This home features a spacious kitchen with ample cabinet space, oversized bedrooms, and a large primary bath. Second bathroom features a handicap-accessible shower. Enjoy relaxing on the covered front porch in this peaceful lake community. Residents have access to a private boat ramp, community swimming pool, and volunteer fire department. Ideal for full-time living or a weekend lake retreat.
-
2026-02-26$95,000 Active 585-char remark
Show marketing remark (585 chars)
3BR/2BA Manufactured Home in Thunderbird Point – Lake Bob Sandlin Well-maintained 3-bedroom, 2-bath manufactured home located in the Thunderbird Point subdivision at Lake Bob Sandlin. This home features a spacious kitchen with ample cabinet space, oversized bedrooms, and a large primary bath. Second bathroom features a handicap-accessible shower. Enjoy relaxing on the covered front porch in this peaceful lake community. Residents have access to a private boat ramp, community swimming pool, and volunteer fire department. Ideal for full-time living or a weekend lake retreat.
-
2026-02-13soldstatus
ⓘ Source: listings_history table (triggers on properties + properties_extension) + one-shot
backfill from property_details.listing_events for pre-trigger history.
Tax reassessment forecast TX · Resets to sale price
- Current annual tax
- $657 · $55/mo
- Projected year-2 tax
- $1,372 · $114/mo
- Expected delta
- +$716/yr (+$60/mo · 108.9%)
ⓘ Screening estimate from a state-policy table — verify with the county assessor before closing.
Climate risk First Street
- Flood 1/10 Low 0% chance over 30 yrs
- Wildfire 5/10 Major
- Heat 7/10 Severe 7 d/yr ≥111°F today · 23 d/yr by 30 yrs out
- Wind 6/10 Major 27% chance of damaging wind over 30 yrs
- Air quality 2/10 Low 0 unhealthy d/yr today · 1 by 30 yrs out
Nearby sold comps map
Loading sold comps map…
Walkable amenities ~0.75 mi
Loading nearby amenities…
Taxation est. · year 1
- Rental income
- $21,852
- − Mortgage interest
- −$4,201
- − Property taxes
- −$657
- − Insurance
- −$375
- − Repairs & maintenance
- −$1,748
- − Management
- −$1,748
- − HOA
- −$252
- − Depreciation
- −$2,182
- Taxable income
- $10,689
- Est. tax owed @ 24.0%
- −$2,565
- After-tax cash flow
- $8,694/yr
For passive investors: Depreciation is non-cash, so a rental often shows a tax loss while cash-flowing — sheltering income. Rental losses are passive: they offset passive income freely, and up to $25,000/yr can offset ordinary (W-2) income if you actively participate and your MAGI is under $100k (phasing out to $0 by $150k); unused losses carry forward. On sale, claimed depreciation is recaptured at up to 25%, and gains may owe capital-gains tax (a 1031 exchange can defer both). Figures are a year-1 estimate at your 24.0% rate — not tax advice; consult a CPA.
Schools (NCES district)
- District
- Pittsburg ISD
- NCES district ID
- 4835010
- Math proficiency
- 54% ▼ -16.00%
- Reading proficiency
- 44% ▼ -16.00%
- Median HH income
- $38,136
- Composite
- 40.87/100
- National rank
- #3627
- State rank
- #216 of 826 in TX
Livability — Rocky Mound
- Score
- 43/100
- State rank
- #1576
- US rank
- #26922
Category grades
Schools grade is shown separately in the Schools card above.
Census & demographics
- Population (ZIP)
- 13,427
Population outlook (Camp County) Hauer SSP2
- Today (2025)
- 13,403 people
- By 2030
- 13,741 · +2.5%
- By 2040
- 14,436 · +7.7%
- By 2050
- 15,135 · +12.9%
- By 2075
- 16,836 · +25.6%
- By 2100
- 17,582 · +31.2%
Race, ethnicity, and origin ACS 2023
- Neighborhood character
- Diverse neighborhood (Simpson 0.63)
- Race & ethnicity
- White 52% Hispanic / Latino 28% Two or more races 16% Black 14% Asian 1%
- Hispanic origin (detail)
- Mexican 25%
- Common ancestry
- Slovak 1% Scottish 1% Serbian 1%
- Foreign-born
- 11% · Canada, Vietnam, Dominican Republic
- Languages at home
- 79% English-only · Spanish 20% Vietnamese 1%
Political lean MEDSL · Camp
- 2024 margin
- Solid R (+53.6) · D 22.9% · R 76.5%
- 2008→2024 swing
- -30.3pp toward R · 2008: -23.3pp · 2024: -53.6pp
- All cycles
- 2024: R+53.6 2020: R+44.1 2016: R+42.7 2012: R+33.5 2008: R+23.3
Not yet ingested
- Civics
- —
Market trends
- HPI YoY
- ▼ -50.12%
- Current HPI
- 181.5522
- Rent YoY
- —
- Metro
- —
- State GDP YoY
- ▲ 3.95%
- F500 in state
- 110
Industry mix (Fortune 500 HQ in TX)
| Industry | F500 HQs | Revenue |
|---|---|---|
| Energy | 16 | $1,198B |
|
||
| Technology | 5 | $198B |
|
||
| Engineering / Construction | 4 | $72B |
|
||
| Energy Services | 3 | $60B |
|
||
| Utilities | 3 | $41B |
|
||
| Healthcare | 2 | $330B |
|
||
Price history
-21.1% since first listed4 events — show timeline
- 2026-05-14 Price Changed $75,000 GTAR
- 2026-03-25 Price Changed $85,000 GTAR
- 2026-02-26 Listed $95,000 GTAR
- 2026-02-13 Sold (Public Records) — Public Records
Property tax history
+1.5%/yrLatest (2025): $657 · +10.0% YoY. Source: county tax records.
Cash-flow waterfall
monthlySold comps — $/sqft
last 12 mo · ≤1 miLoading sold comps…