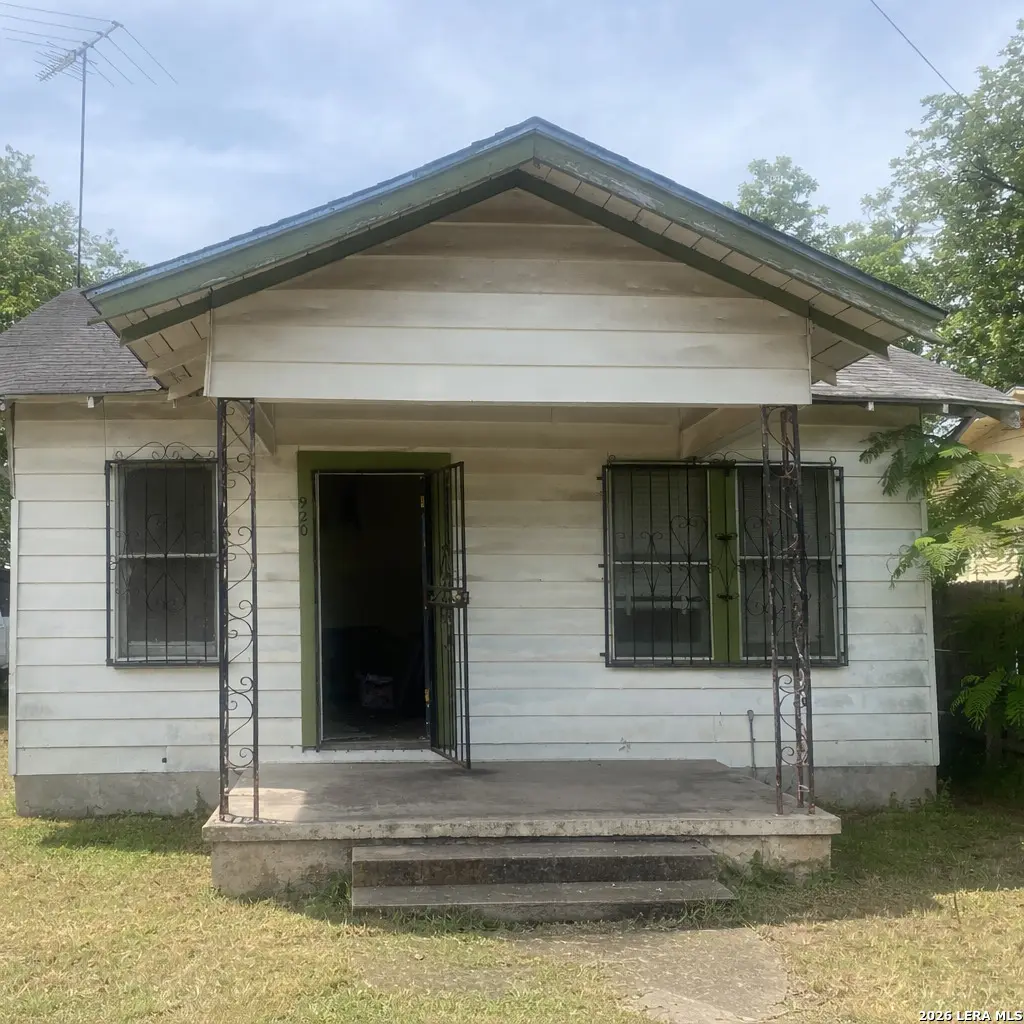
920 Saldana St · San Antonio, TX
Flood risk 1/10 · Minimal
- FEMA flood zone
- X (unshaded)
- Chance of flooding over 30 yrs
- 0.0%
- Est. flood insurance / yr
- $507 – $1,088
Fire risk 1/10 · Minimal
- Est. fire insurance / yr
- $1,222 – $2,270
Heat risk 8/10 · Major
- Hot days now (above 109°F)
- 7 days/yr
- Hot days in 30 yrs
- 22 days/yr
Wind risk 8/10 · Major
- Chance of severe wind over 30 yrs
- 80.0%
Air-quality risk 2/10 · Minimal
- Unhealthy air days now
- 1 days/yr
- Unhealthy air days in 30 yrs
- 2 days/yr
Risk factors via First Street. Map © Google.
Why this score? — see what drove the B- grade
The composite is a weighted blend of 9 inputs, each scored 0–100. Each bar is that input's sub-score; the figure is the points it added to the 100-point composite (weight × sub-score).
- Cash flow +21.3/30.0
- ARV discount +15.0/15.0
- 1% rule +6.9/10.0
- DSCR +6.8/10.0
- Appreciation +5.0/10.0
- Livability +4.0/5.0
- Rent growth +2.5/5.0
- Condition / age +2.5/5.0
- Schools +1.4/10.0
$89,000
🖨 Deal sheet (PDF) 📄 Offer letter ✓ Due diligence
Listing remarks MLS
Located in a popular Southside area of San Antonio, this fixer-upper presents a strong opportunity for investors looking to add value. The property currently offers a 2-bedroom, 1-bathroom layout and needs work, making it ideal for renovation or redevelopment. Situated on a large double lot, the site provides flexibility and added upside for future improvements. The home has good bones, offering a solid starting point for your vision. Architectural plans have already been completed and approved by the city to expand the property to a 3-bedroom, 2-bathroom home totaling 1,335 square feet. These plans may convey with the sale. Owner-Financing also available for this compelling investment opportunity in a high-demand area with clear potential for growth and return.
Key facts
- Large double lot
- 6,250 sq ft lot
- Built 1925
Tags
Neighborhood map
What this means for you Summary
Snapshot
- This is a 2-bed/1.0-bath single-family listed at $89k.
Deal economics
- At list price, monthly cash flow is $131 ($2k/yr) — positive.
- The deal already cash-flows at list — no discount required.
- Meets the 1% rule at list price ($1k rent vs $89k).
- Recommended offer: $78k (12.0% below list) — sets the bar for market timing.
- Cap rate 8.1% vs local median 3.8% in San Antonio — top-decile yield for the area; either an underpriced asset or a hidden risk that comps aren't pricing in. Stress-test before assuming the spread holds.
Location & tenants
- Location reads 80/100 on livability (#31 in TX, #1,616 nationally) — a professional / high-income tenant draw. Strengths: amenities A+, commute A+, cost of living A+; Watch: crime F.
- San Antonio ISD (urban): math 12% / reading 22% proficiency, ranked #805 of 826 in TX (top 98%) — low school quality limits family demand, transient renter base, plan for 1-2y turnover; 80% free/reduced lunch — lower-income household profile, screen leases tightly.
- Zoned schools: Hillcrest El (math 8% / reading 12%, grade F, #4,259 of 4,322 statewide, top 99%, 354 students, 93% FRL); Harris Middle (math 11% / reading 23%, grade F, #1,520 of 1,662 statewide, top 92%, 762 students, 94% FRL, charter); Burbank H S (math 9% / reading 20%, grade F, #1,522 of 1,632 statewide, top 94%, 1,319 students, 90% FRL, charter).
- Market conditions: 1 active listings in the ZIP; 33 comparable units currently listed for rent nearby; rentals at typical pace (median 22d on market — plan ~3-4 weeks tenant-placement turnaround); 8,308 units permitted in Bexar County in 2024 (2,506 in 5+ unit buildings).
Forward outlook
- In year one you build about $3k of equity ($615 loan paydown + $3k appreciation (3.0% local appreciation)).
- Bexar County population projected at +50% by 2050 — long-run rental-demand tailwind backs the buy-and-hold thesis.
- At projected returns (3.0% appreciation + 3.0% rent growth), your $25k cash investment doubles in ~5 years — after that, you're playing with house money.
- By year 10, paydown + projected appreciation supports a ~$32k cash-out refi (75% LTV) — recoverable capital for the next deal without selling this one.
Negotiation context
- It's been on market 136 days — a 12% lower offer ($78k) is reasonable based on typical stale-listing flexibility.
- 2 sale attempts since 2y ago with the ask held roughly flat each time — persistent listings suggest the price (not the market) is what's stuck; bring a comps-based counter.
Risks & watch-outs
- Watch-outs: property tax is 2.7% of price; built in 1925 — expect roof / HVAC / electrical / plumbing capex.
- Climate carrying-cost: severe wind risk, 80% chance of damaging wind over 30y; extreme-heat days projected 7→22/yr by 2055 (HVAC capex compounding) — expect insurance premiums to compound above CPI over the hold.
Questions for the listing agent
- It's been on market 136 days. Have you received any prior offers? Is the seller open to a 12% concession, seller financing, or rate buy-down credit?
- Built in 1925 — when were the roof, HVAC, electrical panel, plumbing, and water heater last replaced?
- Property tax is high relative to price — has the assessment been appealed recently, and will the sale trigger a re-assessment?
- Why hasn't it sold? Are there any deal-killer items the seller is aware of (foundation, flood, title, zoning, code violations)?
- Is there a deadline driving the sale (1031 exchange, divorce, estate, relocation)? That informs how much negotiation room exists.
- Crime grade is F in this area — have there been break-ins, vandalism, or insurance claims at this property in the last 3 years? What carrier currently insures it and at what premium?
- What's the average days-on-market for RENTAL listings here right now (not sales)? A rising rental-DOM trend means longer vacancies and softer asking-rent achievability than the comps imply.
- What's the recent tenant-quality profile in this submarket — average credit score on applications, eviction rate, late-payment / NSF rate, and stable-employment percentage? A property-management company in the area should have these aggregated.
- How much new for-sale + rental construction is in the pipeline within 1–3 miles? Heavy new supply typically softens prices + rents 12–24 months out; constrained supply supports both.
Investment metrics
- 1% rule
- 1.19% ✓
- Cap rate
- 8.06%
- Cash-on-cash
- 6.31%
- DSCR
- 1.28
- GRM
- 7.0
CMA / ARV
- ARV (median comp)
- $135,118
- List price
- $89,000
- Delta
- -34.13%
- Verdict
- UNDERPRICED
- Comps
- 20 within 1.0 mi
Show comp detail 12 sales within ~0.75 mi
| Address | Dist | Beds/Ba | Sqft | Sold | Price | $/sf | Match |
|---|---|---|---|---|---|---|---|
| 941 Ripford | 0.11mi | 2/1.0 | 832 (+11%) | 2mo | $160,000 | $192 | 75 |
| 147 Walton | 0.26mi | 2/1.0 | 800 (+7%) | 4mo | $219,999 | $275 | 73 |
| 702 W Malone | 0.36mi | 2/1.0 | 696 (-7%) | 1mo | $110,000 | $158 | 71 |
| 617 Dewitt | 0.60mi | 2/1.0 | 748 (0%) | 3mo | $160,000 | $214 | 70 |
| 719 W Malone | 0.33mi | 2/1.0 | 830 (+11%) | 5mo | $112,000 | $135 | 62 |
| 1101 Prado St | 0.30mi | 2/1.0 | 690 (-8%) | 14mo | $72,000 | $104 | 62 |
| 347 Carroll St | 0.59mi | 2/1.0 | 792 (+6%) | 8mo | $106,000 | $134 | 56 |
| 112 Conception St | 0.32mi | 3/1.0 (+1) | 808 (+8%) | 13mo | $109,900 | $136 | 56 |
| 231 Carroll | 0.40mi | 2/1.0 | 852 (+14%) | 10mo | $125,000 | $147 | 50 |
| 203 Big Foot | 0.69mi | 2/2.0 | 714 (-4%) | 10mo | $139,900 | $196 | 48 |
| 439 W Lubbock St | 0.58mi | 3/1.0 (+1) | 838 (+12%) | 11mo | $125,000 | $149 | 39 |
| 515 Pruitt Ave | 0.63mi | 3/1.0 (+1) | 840 (+12%) | 13mo | $84,900 | $101 | 35 |
Match score weights: distance 35% · size 25% · config 20% · recency 20%. Top-matched comps best support the ARV.
Projected returns pro-forma
3.0% appreciation · 3.0% rent growth · sell at horizon
- IRR
- 13.4%
- Equity multiple
- 1.77×
- Total profit
- $19,137
- Equity at exit
- $40,018
- IRR
- 15.4%
- Equity multiple
- 3.27×
- Total profit
- $56,539
- Equity at exit
- $61,673
Cash invested: $24,920 (down + closing). Projections, not guarantees.
Landlord ↔ Tenant lean methodology
- Overall (STATE)
- 87 Strongly Landlord-Friendly
- State Texas
- 87 Strongly Landlord-Friendly · R+5
- County
- — inherits STATE
- City
- — inherits STATE
ZIP-level market 78225-1553
- Active inventory
- 1
- Price-to-rent
- 7.0×
Monthly cashflow live
- Estimated rent
- $1,056 high interval (Pro) →
- Mortgage (P&I)
- −$467
- Tax from tax record
- −$199 /mo · $2,390/yr
- Insurance
- −$37
- HOA
- −$0
- Vacancy / Maint / Mgmt
- −$222
- Net cashflow
- $131
Break-even live
Sensitivity live
| Price | -10% $181 | -5% $156 | +0% $131 | +5% $106 | +10% $81 |
|---|---|---|---|---|---|
| Rent | -10% $48 | -5% $89 | +0% $131 | +5% $173 | +10% $214 |
| Rate | -1.0pp $176 | -0.5pp $154 | base $131 | +0.5pp $108 | +1.0pp $85 |
UW: 25.0% down · 7.5% · 30yr · 1.5% tax · 5.0% vac · 8.0% maint · 8.0% mgmt
Financing live
Cash to close
- Down payment
- $22,250
- Closing costs
- $2,670
- Reserves months
- —
- Total cash needed
- —
Loan-product check · same deal, 3 products live
Conventional
25% down · 7.5% · 30yr
- Down + closing
- —
- Monthly P&I
- —
- Monthly cashflow
- —
- DSCR
- —
- Eligible?
- —
Personal DTI + credit; lowest rate.
DSCR
20% down · 8.5% · 30yr
- Down + closing
- —
- Monthly P&I
- —
- Monthly cashflow
- —
- DSCR
- —
- Eligible?
- —
No personal income docs; deal must DSCR.
Hard money
10% down · 12.0% · 12mo
- Down + closing
- —
- Monthly P&I
- —
- Monthly cashflow
- —
- DSCR
- —
- Eligible?
- —
Short-term bridge; refi at stabilization.
Rent comps 33 comps
| Address | Beds | Baths | Sqft | Rent | $/sqft | DOM | Units | Dist |
|---|---|---|---|---|---|---|---|---|
| 815 Ripford St San Antonio, TX | 2.0 | 1.0 | 728 | $1,300 | $1.79 | 6d | 1 | 0.14mi |
| 520 Prado St Unit 1 San Antonio, TX | 2.0 | 1.0 | 620 | $799 | $1.29 | 45d | 1 | 0.36mi |
| 330 Barrett Pl San Antonio, TX | 1.0 | 1.0 | 400 | $900 | $2.25 | 14d | 1 | 0.44mi |
| 350 Barrett Pl San Antonio, TX | 2.0 | 1.0 | 616 | $1,225 | $1.99 | 6d | 1 | 0.48mi |
| 416 Collingsworth Unit 2 San Antonio, TX | 2.0 | 1.0 | 570 | $1,100 | $1.93 | 45d | 1 | 0.51mi |
| 834 Division Ave San Antonio, TX | 2.0 | 1.0 | 700 | $1,050 | $1.50 | 25d | 1 | 0.88mi |
| 131 Klein St #1 San Antonio, TX | 2.0 | 1.0 | 653 | $1,395 | $2.14 | 46d | 1 | 0.91mi |
| 2600 S Flores St San Antonio, TX | 2.0 | 1.0 | 705 | $900 | $1.28 | 25d | 3 | 0.92mi |
| 205 W Lambert St San Antonio, TX | 2.0 | 1.0 | 550 | $995 | $1.81 | 19d | 1 | 0.93mi |
| 1901 S San Marcos Unit 610 San Antonio, TX | 1.0 | 1.0 | 750 | $954 | $1.27 | 0d | 1 | 0.97mi |
| 226 E Malone Ave San Antonio, TX | 2.0 | 1.0 | 693 | $1,100 | $1.59 | 23d | 1 | 0.97mi |
| 125 Forrest Ave San Antonio, TX | 2.0 | 1.0 | 616 | $1,275 | $2.07 | 17d | 1 | 1.01mi |
| 107 Stanley Ct Apt 4 San Antonio, TX | 1.0 | 1.0 | 375 | $825 | $2.20 | 6d | 1 | 1.02mi |
| 107 Stanley Ct Apt 3 San Antonio, TX | 2.0 | 1.0 | 575 | $950 | $1.65 | 21d | 1 | 1.02mi |
| 150 Bank St Unit C San Antonio, TX | 1.0 | 1.0 | 600 | $749 | $1.25 | 21d | 1 | 1.02mi |
| 150 Bank St San Antonio, TX | 1.0 | 1.0 | 700 | $795 | $1.14 | 45d | 1 | 1.02mi |
| 103 Stanley Ct Unit 1 San Antonio, TX | 1.0 | 1.0 | 450 | $900 | $2.00 | 21d | 1 | 1.02mi |
| 1202 Division Ave San Antonio, TX | 1.0 | 1.0 | 550 | $1,100 | $2.00 | 25d | 1 | 1.03mi |
| 112 Oelkers San Antonio, TX | 1.0 | 1.0 | 420 | $1,100 | $2.62 | 5d | 1 | 1.03mi |
| 112 Oelkers St Unit 2 San Antonio, TX | 1.0 | 1.0 | 375 | $950 | $2.53 | 45d | 1 | 1.03mi |
| 165 Division Ave Unit 2 San Antonio, TX | 1.0 | 1.0 | 617 | $700 | $1.13 | 23d | 1 | 1.14mi |
| 165 Division Ave Unit 2 San Antonio, TX | 1.0 | 1.0 | 617 | $725 | $1.18 | 45d | 1 | 1.14mi |
| 165 Division Ave San Antonio, TX | 1.0 | 1.0 | 617 | $700 | $1.13 | 0d | 1 | 1.14mi |
| 128 Saint Francis Ave Unit 3 San Antonio, TX | 1.0 | 1.0 | 528 | $775 | $1.47 | 25d | 1 | 1.14mi |
| 323 W Mitchell St San Antonio, TX | 1.0–3.0 | 1.0–2.0 | 873 | $1,248 | $1.43 | 0d | 1 | 1.17mi |
| 1938 S Zarzamora St Unit 610 San Antonio, TX | 1.0 | 1.0 | 744 | $907 | $1.22 | 0d | 1 | 1.25mi |
| 2003 S Zarzamora St San Antonio, TX | 1.0–4.0 | 1.0–2.0 | 1028 | $1,120 | $1.09 | 25d | 1 | 1.26mi |
| 1222 Brighton Ave Unit B San Antonio, TX | 3.0 | 1.0 | 725 | $999 | $1.38 | 0d | 1 | 1.27mi |
| 1222 Brighton Ave Unit B San Antonio, TX | 3.0 | 1.0 | 725 | $999 | $1.38 | 19d | 1 | 1.27mi |
| 121 E Mitchell St San Antonio, TX | 2.0 | 1.0 | 528 | $850 | $1.61 | 45d | 1 | 1.35mi |
| 515 Humble Ave San Antonio, TX | 1.0 | 1.0 | 700 | $810 | $1.16 | 45d | 1 | 1.39mi |
| 302 W Cevallos Unit 2 San Antonio, TX | 1.0 | 1.0 | 400 | $1,250 | $3.12 | 45d | 1 | 1.43mi |
| 218 Tampico St San Antonio, TX | 2.0 | 1.0–2.0 | 808 | $1,645 | $2.03 | 0d | 29 | 1.49mi |
Listing history 17 events
-
2026-06-18days on market $89,000 Active 136 DOM
-
2026-06-17days on market $89,000 Active 135 DOM
-
2026-06-16days on market $89,000 Active 134 DOM
-
2026-06-15days on market $89,000 Active 133 DOM
-
2026-06-13days on market $89,000 Active 131 DOM
-
2026-06-09days on market $89,000 Active 127 DOM
-
2026-06-08days on market $89,000 Active 126 DOM
-
2026-06-07days on market $89,000 Active 125 DOM
-
2026-06-04days on market $89,000 Active 122 DOM
-
2026-06-03days on market $89,000 Active 121 DOM
-
2026-06-02days on market $89,000 Active 120 DOM
-
2026-06-01days on market $89,000 Active 119 DOM
-
2026-05-31days on market $89,000 Active 118 DOM
-
2026-02-02$89,000 New 776-char remark
Show marketing remark (776 chars)
Located in a popular Southside area of San Antonio, this fixer-upper presents a strong opportunity for investors looking to add value. The property currently offers a 2-bedroom, 1-bathroom layout and needs work, making it ideal for renovation or redevelopment. Situated on a large double lot, the site provides flexibility and added upside for future improvements. The home has good bones, offering a solid starting point for your vision. Architectural plans have already been completed and approved by the city to expand the property to a 3-bedroom, 2-bathroom home totaling 1,335 square feet. These plans may convey with the sale. Owner-Financing also available for this compelling investment opportunity in a high-demand area with clear potential for growth and return.
-
2024-09-18historical
-
2024-08-21price $85,000
-
2024-08-12$93,000 New
ⓘ Source: listings_history table (triggers on properties + properties_extension) + one-shot
backfill from property_details.listing_events for pre-trigger history.
Tax reassessment forecast TX · Resets to sale price
- Current annual tax
- $2,390 · $199/mo
- Projected year-2 tax
- $2,390 · $199/mo
- Expected delta
- $0/yr ($0/mo · 0.0%)
ⓘ Screening estimate from a state-policy table — verify with the county assessor before closing.
Climate risk First Street
- Flood 1/10 Low FEMA zone X (unshaded) · 0% chance over 30 yrs
- Wildfire 1/10 Low
- Heat 8/10 Severe 7 d/yr ≥109°F today · 22 d/yr by 30 yrs out
- Wind 8/10 Severe 80% chance of damaging wind over 30 yrs
- Air quality 2/10 Low 1 unhealthy d/yr today · 2 by 30 yrs out
Nearby sold comps map
Loading sold comps map…
Walkable amenities ~0.75 mi
Loading nearby amenities…
Taxation est. · year 1
- Rental income
- $12,668
- − Mortgage interest
- −$4,985
- − Property taxes
- −$2,390
- − Insurance
- −$445
- − Repairs & maintenance
- −$1,013
- − Management
- −$1,013
- − Depreciation
- −$2,589
- Taxable income
- $232
- Est. tax owed @ 24.0%
- −$56
- After-tax cash flow
- $1,517/yr
For passive investors: Depreciation is non-cash, so a rental often shows a tax loss while cash-flowing — sheltering income. Rental losses are passive: they offset passive income freely, and up to $25,000/yr can offset ordinary (W-2) income if you actively participate and your MAGI is under $100k (phasing out to $0 by $150k); unused losses carry forward. On sale, claimed depreciation is recaptured at up to 25%, and gains may owe capital-gains tax (a 1031 exchange can defer both). Figures are a year-1 estimate at your 24.0% rate — not tax advice; consult a CPA.
Schools (NCES district)
- District
- San Antonio ISD
- NCES district ID
- 4838730
- Math proficiency
- 12% ▼ -21.00%
- Reading proficiency
- 22% ▼ -7.00%
- Median HH income
- $30,952
- Composite
- 13.57/100
- National rank
- #9512
- State rank
- #805 of 826 in TX
Livability — San Antonio
- Score
- 80/100
- State rank
- #31
- US rank
- #1616
Category grades
Schools grade is shown separately in the Schools card above.
Census & demographics
- Census place
- San Antonio, TX
Population outlook (Bexar County) Hauer SSP2
- Today (2025)
- 2,336,851 people
- By 2030
- 2,560,728 · +9.6%
- By 2040
- 3,020,569 · +29.3%
- By 2050
- 3,493,522 · +49.5%
- By 2075
- 4,668,459 · +99.8%
- By 2100
- 5,533,242 · +136.8%
Not yet ingested
- Political lean
- —
- Race & ethnicity
- —
- Common origin
- —
- Civics
- —
Market trends
- HPI YoY
- —
- Current HPI
- —
- Rent YoY
- —
- Metro
- —
- State GDP YoY
- ▲ 3.95%
- F500 in state
- 110
Industry mix (Fortune 500 HQ in TX)
| Industry | F500 HQs | Revenue |
|---|---|---|
| Energy | 16 | $1,198B |
|
||
| Technology | 5 | $198B |
|
||
| Engineering / Construction | 4 | $72B |
|
||
| Energy Services | 3 | $60B |
|
||
| Utilities | 3 | $41B |
|
||
| Healthcare | 2 | $330B |
|
||
Price history
-4.3% since first listed4 events — show timeline
- 2026-02-02 Listed $89,000 LERA
- 2024-09-18 Listing Removed — LERA
- 2024-08-21 Price Changed $85,000 LERA
- 2024-08-12 Listed $93,000 LERA
Property tax history
+7.4%/yrLatest (2025): $2,390 · -3.7% YoY. Source: county tax records.
Cash-flow waterfall
monthlySold comps — $/sqft
last 12 mo · ≤1 miLoading sold comps…