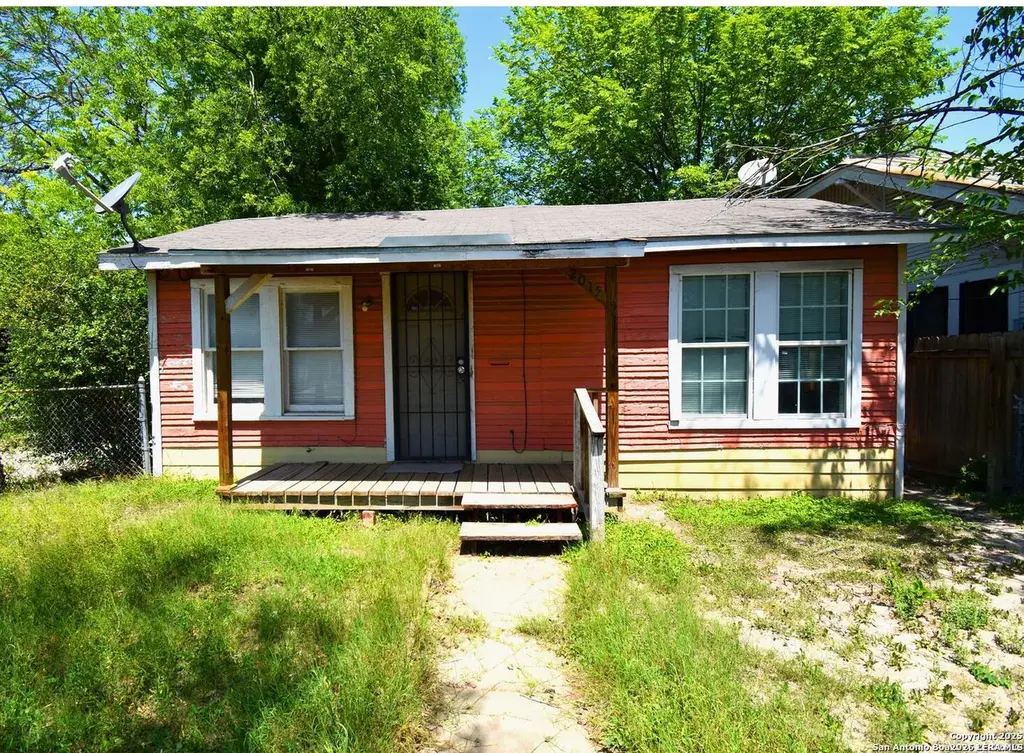
2015 Martin Luther King · San Antonio, TX
Flood risk 1/10 · Minimal
- FEMA flood zone
- X (unshaded)
- Chance of flooding over 30 yrs
- 0.0%
- Est. flood insurance / yr
- $507 – $1,088
Fire risk 1/10 · Minimal
- Est. fire insurance / yr
- $1,222 – $2,270
Heat risk 8/10 · Major
- Hot days now (above 108°F)
- 6 days/yr
- Hot days in 30 yrs
- 17 days/yr
Wind risk 8/10 · Major
- Chance of severe wind over 30 yrs
- 80.0%
Air-quality risk 2/10 · Minimal
- Unhealthy air days now
- 1 days/yr
- Unhealthy air days in 30 yrs
- 2 days/yr
Risk factors via First Street. Map © Google.
Why this score? — see what drove the A- grade
The composite is a weighted blend of 9 inputs, each scored 0–100. Each bar is that input's sub-score; the figure is the points it added to the 100-point composite (weight × sub-score).
- Cash flow +29.4/30.0
- ARV discount +15.0/15.0
- 1% rule +10.0/10.0
- DSCR +10.0/10.0
- Appreciation +5.7/10.0
- Rent growth +5.0/5.0
- Livability +4.0/5.0
- Condition / age +2.5/5.0
- Schools +1.4/10.0
$75,000
🖨 Deal sheet (PDF) 📄 Offer letter ✓ Due diligence
Listing remarks MLS
Investor special in one of San Antonio's fastest-growing corridors! Located at 2015 Martin Luther King Dr, this downtown property presents a prime opportunity for a full renovation with substantial upside potential. Just minutes from Downtown San Antonio and the AT&T Center, this home sits directly in the path of the highly anticipated Project Marvel development-an upcoming large-scale expansion expected to bring significant growth, redevelopment, and increased property values to the area. Adding even more value, the land itself is already appraising above the current list price, offering built-in equity from day one. Whether you're looking to execute a profitable flip, develop a high-demand Airbnb, or secure a cash-flowing rental, this location is primed for strong appreciation and long-term equity growth. With high visibility, excellent access, and proximity to major attractions, this is a true blank canvas ready to be transformed into a standout investment. Perfect for new or seasoned investors looking to capitalize on a rapidly transitioning neighborhood-opportunities like this are becoming increasingly rare as development continues to push values upward.
Key facts
- Full renovation
- Excellent access
- High visibility
Tags
Neighborhood map
What this means for you Summary
Snapshot
- This is a 2-bed/1.0-bath single-family listed at $75k.
Deal economics
- At list price, monthly cash flow is $266 ($3k/yr) — positive.
- The deal already cash-flows at list — no discount required.
- Meets the 1% rule at list price ($1k rent vs $75k).
- Recommended offer: $70k (6.0% below list) — sets the bar for market timing.
- Cap rate 10.5% vs local median 3.8% in San Antonio — top-decile yield for the area; either an underpriced asset or a hidden risk that comps aren't pricing in. Stress-test before assuming the spread holds.
Location & tenants
- Location reads 80/100 on livability (#31 in TX, #1,616 nationally) — a professional / high-income tenant draw. Strengths: amenities A+, commute A+, cost of living A+; Watch: schools C-, crime F.
- San Antonio ISD (urban): math 12% / reading 22% proficiency, ranked #805 of 826 in TX (top 98%) — low school quality limits family demand, transient renter base, plan for 1-2y turnover; 80% free/reduced lunch — lower-income household profile, screen leases tightly.
- Market conditions: Rents rising fast (+10.9%/yr); 99 active listings in the ZIP; 40 comparable units currently listed for rent nearby; rentals at typical pace (median 25d on market — plan ~3-4 weeks tenant-placement turnaround); lower-income renter base — watch delinquency; 8,308 units permitted in Bexar County in 2024 (2,506 in 5+ unit buildings).
- This rent runs 43% of the median local income ($36k/yr) — at the standard rent-burdened threshold; future hikes will face affordability resistance.
Forward outlook
- In year one you build about $2k of equity ($519 loan paydown + $1k appreciation (1.3% local appreciation)).
- Bexar County population projected at +50% by 2050 — long-run rental-demand tailwind backs the buy-and-hold thesis.
- At projected returns (1.3% appreciation + 8.0% rent growth), your $21k cash investment doubles in ~4 years — after that, you're playing with house money.
Negotiation context
- It's been on market 72 days — a 6% lower offer ($70k) is reasonable based on typical stale-listing flexibility.
- 5 sale attempts since 21y ago with the ask held roughly flat each time — persistent listings suggest the price (not the market) is what's stuck; bring a comps-based counter.
Risks & watch-outs
- Watch-outs: property tax is 4.9% of price; built in 1945 — expect roof / HVAC / electrical / plumbing capex.
- Climate carrying-cost: severe wind risk, 80% chance of damaging wind over 30y; extreme-heat days projected 6→17/yr by 2055 (HVAC capex compounding) — expect insurance premiums to compound above CPI over the hold.
Questions for the listing agent
- It's been on market 72 days. Have you received any prior offers? Is the seller open to a 6% concession, seller financing, or rate buy-down credit?
- Built in 1945 — when were the roof, HVAC, electrical panel, plumbing, and water heater last replaced?
- Property tax is high relative to price — has the assessment been appealed recently, and will the sale trigger a re-assessment?
- Why hasn't it sold? Are there any deal-killer items the seller is aware of (foundation, flood, title, zoning, code violations)?
- Is there a deadline driving the sale (1031 exchange, divorce, estate, relocation)? That informs how much negotiation room exists.
- Crime grade is F in this area — have there been break-ins, vandalism, or insurance claims at this property in the last 3 years? What carrier currently insures it and at what premium?
- What's the average days-on-market for RENTAL listings here right now (not sales)? A rising rental-DOM trend means longer vacancies and softer asking-rent achievability than the comps imply.
- What's the recent tenant-quality profile in this submarket — average credit score on applications, eviction rate, late-payment / NSF rate, and stable-employment percentage? A property-management company in the area should have these aggregated.
- How much new for-sale + rental construction is in the pipeline within 1–3 miles? Heavy new supply typically softens prices + rents 12–24 months out; constrained supply supports both.
Investment metrics
- 1% rule
- 1.68% ✓
- Cap rate
- 10.55%
- Cash-on-cash
- 15.20%
- DSCR
- 1.68
- GRM
- 5.0
CMA / ARV
- ARV (median comp)
- $114,672
- List price
- $75,000
- Delta
- -34.60%
- Verdict
- UNDERPRICED
- Comps
- 20 within 1.0 mi
Show comp detail 7 sales within ~0.75 mi
| Address | Dist | Beds/Ba | Sqft | Sold | Price | $/sf | Match |
|---|---|---|---|---|---|---|---|
| 330 Vine | 0.35mi | 2/1.0 | 796 (+2%) | 20mo | $95,900 | $120 | 63 |
| 2117 Virginia Blvd | 0.17mi | 2/1.0 | 876 (+12%) | 19mo | $95,000 | $108 | 56 |
| 1038 Paso Hondo | 0.70mi | 2/1.0 | 720 (-8%) | 14mo | $80,000 | $111 | 43 |
| 310 N Gevers | 0.63mi | 2/1.0 | 876 (+12%) | 11mo | $85,000 | $97 | 41 |
| 1012 Porter St | 0.54mi | 2/1.0 | 690 (-12%) | 23mo | $65,000 | $94 | 36 |
| 1424 Montana | 0.62mi | 2/1.0 | 855 (+10%) | 23mo | $72,500 | $85 | 36 |
| 339 Cooper St | 0.51mi | 2/1.0 | 665 (-15%) | 20mo | $130,000 | $195 | 35 |
Match score weights: distance 35% · size 25% · config 20% · recency 20%. Top-matched comps best support the ARV.
Projected returns pro-forma
1.34% appreciation · 8.0% rent growth · sell at horizon
- IRR
- 22.9%
- Equity multiple
- 2.26×
- Total profit
- $26,392
- Equity at exit
- $26,922
- IRR
- 29.1%
- Equity multiple
- 5.35×
- Total profit
- $91,338
- Equity at exit
- $36,819
Cash invested: $21,000 (down + closing). Projections, not guarantees.
Landlord ↔ Tenant lean methodology
- Overall (STATE)
- 87 Strongly Landlord-Friendly
- State Texas
- 87 Strongly Landlord-Friendly · R+5
- County
- — inherits STATE
- City
- — inherits STATE
ZIP-level market 78203
- Home prices YoY
- 0.5%
- Rents YoY
- 10.9%
- Active inventory
- 99
- Price-to-rent
- 5.0×
Monthly cashflow live
- Estimated rent
- $1,260 high interval (Pro) →
- Mortgage (P&I)
- −$393
- Tax from tax record
- −$305 /mo · $3,657/yr
- Insurance
- −$31
- HOA
- −$0
- Vacancy / Maint / Mgmt
- −$265
- Net cashflow
- $266
Break-even live
Sensitivity live
| Price | -10% $529 | -5% $503 | +0% $266 | +5% $245 | +10% $224 |
|---|---|---|---|---|---|
| Rent | -10% $166 | -5% $216 | +0% $266 | +5% $316 | +10% $366 |
| Rate | -1.0pp $304 | -0.5pp $285 | base $266 | +0.5pp $247 | +1.0pp $227 |
UW: 25.0% down · 7.5% · 30yr · 1.5% tax · 5.0% vac · 8.0% maint · 8.0% mgmt
Financing live
Cash to close
- Down payment
- $18,750
- Closing costs
- $2,250
- Reserves months
- —
- Total cash needed
- —
Loan-product check · same deal, 3 products live
Conventional
25% down · 7.5% · 30yr
- Down + closing
- —
- Monthly P&I
- —
- Monthly cashflow
- —
- DSCR
- —
- Eligible?
- —
Personal DTI + credit; lowest rate.
DSCR
20% down · 8.5% · 30yr
- Down + closing
- —
- Monthly P&I
- —
- Monthly cashflow
- —
- DSCR
- —
- Eligible?
- —
No personal income docs; deal must DSCR.
Hard money
10% down · 12.0% · 12mo
- Down + closing
- —
- Monthly P&I
- —
- Monthly cashflow
- —
- DSCR
- —
- Eligible?
- —
Short-term bridge; refi at stabilization.
Rent comps 40 comps
| Address | Beds | Baths | Sqft | Rent | $/sqft | DOM | Units | Dist |
|---|---|---|---|---|---|---|---|---|
| 314 Maryland St Unit 102 San Antonio, TX | 2.0 | 2.5 | 1055 | $1,295 | $1.23 | 44d | 1 | 0.17mi |
| 227 S Grimes St Unit 202 San Antonio, TX | 3.0 | 2.5 | 1089 | $1,550 | $1.42 | 44d | 1 | 0.26mi |
| 1431 Aransas Ave San Antonio, TX | 3.0 | 1.0 | 1108 | $1,195 | $1.08 | 15d | 1 | 0.28mi |
| 125 Magendie St San Antonio, TX | 2.0 | 2.0 | 820 | $1,323 | $1.61 | 5d | 1 | 0.29mi |
| 420 Clark Ave San Antonio, TX | 2.0 | 1.0 | 756 | $1,295 | $1.71 | 18d | 1 | 0.35mi |
| 342 Vine St San Antonio, TX | 2.0 | 1.0 | 768 | $995 | $1.30 | 24d | 1 | 0.37mi |
| 342 Vine St Unit B San Antonio, TX | 2.0 | 1.0 | 768 | $875 | $1.14 | 44d | 1 | 0.37mi |
| 515 Clark Ave San Antonio, TX | 3.0 | 2.0 | 528 | $1,250 | $2.37 | 24d | 1 | 0.38mi |
| 143 Ranger Unit 101 San Antonio, TX | 3.0 | 2.0 | 876 | $1,099 | $1.25 | 2d | 1 | 0.41mi |
| 512 Cooper St San Antonio, TX | 2.0 | 1.0 | 1116 | $1,295 | $1.16 | 24d | 1 | 0.44mi |
| 526 Cooper St Unit B San Antonio, TX | 1.0 | 1.0 | 600 | $895 | $1.49 | 44d | 1 | 0.45mi |
| 610 Belmont San Antonio, TX | 2.0 | 1.0 | 1050 | $1,195 | $1.14 | 44d | 1 | 0.45mi |
| 308 Belmont San Antonio, TX | 1.0 | 1.0 | 700 | $850 | $1.21 | 24d | 1 | 0.49mi |
| 1435 Gibbs San Antonio, TX | 3.0 | 1.0 | 975 | $1,435 | $1.47 | 24d | 1 | 0.55mi |
| 616 Porter St Unit 618-p San Antonio, TX | 1.0 | 1.0 | 680 | $895 | $1.32 | 5d | 1 | 0.68mi |
| 1101 Gibbs San Antonio, TX | 3.0 | 1.0 | 1100 | $1,345 | $1.22 | 15d | 1 | 0.69mi |
| 1101 Gibbs San Antonio, TX | 3.0 | 1.0 | 1100 | $1,345 | $1.22 | 24d | 1 | 0.69mi |
| 706 Canton San Antonio, TX | 2.0 | 1.0 | 994 | $1,545 | $1.55 | 24d | 1 | 0.69mi |
| 639 Canton San Antonio, TX | 2.0 | 1.0 | 1008 | $1,295 | $1.28 | 44d | 1 | 0.72mi |
| 413 Nopal St Unit 102 San Antonio, TX | 2.0 | 1.0 | 743 | $1,450 | $1.95 | 2d | 1 | 0.74mi |
| 311 Spriggsdale Ave Unit 710 San Antonio, TX | 2.0 | 2.0 | 890 | $981 | $1.10 | 3d | 1 | 0.75mi |
| 311 Spriggsdale Ave Unit 610 San Antonio, TX | 1.0 | 1.0 | 745 | $892 | $1.20 | 3d | 1 | 0.75mi |
| 136 Nelson Ave San Antonio, TX | 3.0 | 1.0 | 1092 | $1,316 | $1.21 | 44d | 1 | 0.77mi |
| 1005 Essex St Unit 101 San Antonio, TX | 2.0 | 2.0 | 800 | $1,425 | $1.78 | 2d | 1 | 0.79mi |
| 1005 Essex St Unit 202 San Antonio, TX | 2.0 | 2.0 | 800 | $1,450 | $1.81 | 44d | 1 | 0.79mi |
| 746 Gulf San Antonio, TX | 2.0 | 1.0 | 744 | $975 | $1.31 | 15d | 1 | 0.80mi |
| 742 Gulf St Unit 746 San Antonio, TX | 2.0 | 1.0 | 744 | $975 | $1.31 | 13d | 1 | 0.81mi |
| 730 Aransas Ave Unit 3 San Antonio, TX | 2.0 | 1.0 | 800 | $975 | $1.22 | 44d | 1 | 0.84mi |
| 241 Delmar St San Antonio, TX | 2.0 | 1.0 | 758 | $1,120 | $1.48 | 24d | 1 | 0.85mi |
| 721 Potomac San Antonio, TX | 1.0 | 1.0 | 914 | $1,100 | $1.20 | 24d | 1 | 0.86mi |
| 215 Edna Ave San Antonio, TX | 2.0 | 1.0 | 968 | $1,260 | $1.30 | 44d | 1 | 0.87mi |
| 438 Gulf St San Antonio, TX | 2.0 | 1.0 | 799 | $975 | $1.22 | 15d | 1 | 0.87mi |
| 313 Toledo San Antonio, TX | 2.0 | 1.0 | 924 | $1,400 | $1.52 | 11d | 1 | 0.88mi |
| 1414 Gorman San Antonio, TX | 2.0 | 1.0 | 900 | $1,175 | $1.31 | 44d | 1 | 0.88mi |
| 1510 Gorman San Antonio, TX | 2.0 | 1.0 | 996 | $1,300 | $1.31 | 18d | 1 | 0.89mi |
| 2023 Beaver Ln San Antonio, TX | 1.0 | 1.0 | 600 | $960 | $1.60 | 44d | 1 | 0.89mi |
| 146 Eross San Antonio, TX | 2.0 | 1.0 | 696 | $900 | $1.29 | 17d | 1 | 0.90mi |
| 622 Potomac St San Antonio, TX | 1.0 | 1.0 | 700 | $975 | $1.39 | 44d | 1 | 0.90mi |
| 620 Potomac San Antonio, TX | 2.0 | 1.0 | 900 | $1,050 | $1.17 | 22d | 1 | 0.91mi |
| 1650 Gorman San Antonio, TX | 2.0 | 1.0 | 950 | $1,111 | $1.17 | 24d | 1 | 0.92mi |
Listing history 34 events
-
2026-06-18days on market $75,000 Active 72 DOM
-
2026-06-17days on market $75,000 Active 71 DOM
-
2026-06-16days on market $75,000 Active 70 DOM
-
2026-06-15days on market $75,000 Active 69 DOM
-
2026-06-13days on market $75,000 Active 67 DOM
-
2026-06-09days on market $75,000 Active 63 DOM
-
2026-06-08days on market $75,000 Active 62 DOM
-
2026-06-07days on market $75,000 Active 61 DOM
-
2026-06-04days on market $75,000 Active 58 DOM
-
2026-06-03days on market $75,000 Active 57 DOM
-
2026-06-02days on market $75,000 Active 56 DOM
-
2026-06-01days on market $75,000 Active 55 DOM
-
2026-05-31days on market $75,000 Active 54 DOM
-
2026-04-07$75,000 New 1181-char remark
Show marketing remark (1181 chars)
Investor special in one of San Antonio's fastest-growing corridors! Located at 2015 Martin Luther King Dr, this downtown property presents a prime opportunity for a full renovation with substantial upside potential. Just minutes from Downtown San Antonio and the AT&T Center, this home sits directly in the path of the highly anticipated Project Marvel development-an upcoming large-scale expansion expected to bring significant growth, redevelopment, and increased property values to the area. Adding even more value, the land itself is already appraising above the current list price, offering built-in equity from day one. Whether you're looking to execute a profitable flip, develop a high-demand Airbnb, or secure a cash-flowing rental, this location is primed for strong appreciation and long-term equity growth. With high visibility, excellent access, and proximity to major attractions, this is a true blank canvas ready to be transformed into a standout investment. Perfect for new or seasoned investors looking to capitalize on a rapidly transitioning neighborhood-opportunities like this are becoming increasingly rare as development continues to push values upward.
-
2025-08-01historical
-
2025-07-25price $75,000
-
2025-05-26price $79,000
-
2025-04-13$85,000 New
-
2025-02-11soldstatus
-
2025-02-07soldstatus Sold
-
2025-01-20status Pending
-
2025-01-16historical Active Option
-
2024-12-04$85,000 New
-
2017-10-31soldstatus Sold
-
2017-10-09soldstatus
-
2017-09-16status Pending
-
2017-09-13historical Active Option
-
2017-08-21$50,000 New
-
2006-01-04soldstatus
-
2006-01-03soldstatus
-
2005-12-22historical
-
2005-12-19$25,000
-
2005-08-10soldstatus
-
1998-03-01soldstatus
ⓘ Source: listings_history table (triggers on properties + properties_extension) + one-shot
backfill from property_details.listing_events for pre-trigger history.
Tax reassessment forecast TX · Resets to sale price
- Current annual tax
- $3,657 · $305/mo
- Projected year-2 tax
- $3,657 · $305/mo
- Expected delta
- $0/yr ($0/mo · 0.0%)
ⓘ Screening estimate from a state-policy table — verify with the county assessor before closing.
Climate risk First Street
- Flood 1/10 Low FEMA zone X (unshaded) · 0% chance over 30 yrs
- Wildfire 1/10 Low
- Heat 8/10 Severe 6 d/yr ≥108°F today · 17 d/yr by 30 yrs out
- Wind 8/10 Severe 80% chance of damaging wind over 30 yrs
- Air quality 2/10 Low 1 unhealthy d/yr today · 2 by 30 yrs out
Nearby sold comps map
Loading sold comps map…
Walkable amenities ~0.75 mi
Loading nearby amenities…
Taxation est. · year 1
- Rental income
- $15,118
- − Mortgage interest
- −$4,201
- − Property taxes
- −$3,657
- − Insurance
- −$375
- − Repairs & maintenance
- −$1,209
- − Management
- −$1,209
- − Depreciation
- −$2,182
- Taxable income
- $2,285
- Est. tax owed @ 24.0%
- −$548
- After-tax cash flow
- $2,644/yr
For passive investors: Depreciation is non-cash, so a rental often shows a tax loss while cash-flowing — sheltering income. Rental losses are passive: they offset passive income freely, and up to $25,000/yr can offset ordinary (W-2) income if you actively participate and your MAGI is under $100k (phasing out to $0 by $150k); unused losses carry forward. On sale, claimed depreciation is recaptured at up to 25%, and gains may owe capital-gains tax (a 1031 exchange can defer both). Figures are a year-1 estimate at your 24.0% rate — not tax advice; consult a CPA.
Schools (NCES district)
- District
- San Antonio ISD
- NCES district ID
- 4838730
- Math proficiency
- 12% ▼ -21.00%
- Reading proficiency
- 22% ▼ -7.00%
- Median HH income
- $30,952
- Composite
- 13.57/100
- National rank
- #9512
- State rank
- #805 of 826 in TX
Livability — San Antonio
- Score
- 80/100
- State rank
- #31
- US rank
- #1616
Category grades
Schools grade is shown separately in the Schools card above.
Census & demographics
- Census place
- San Antonio, TX
- County
- Bexar County · 1,990,555 people
- City population
- 1,806,925
- Metro
- San Antonio-New Braunfels, TX
- Population (ZIP)
- 5,200
- Household income
- $35,536
- Rent vs Own
- Severe rent burden
- 470.0
Population outlook (Bexar County) Hauer SSP2
- Today (2025)
- 2,336,851 people
- By 2030
- 2,560,728 · +9.6%
- By 2040
- 3,020,569 · +29.3%
- By 2050
- 3,493,522 · +49.5%
- By 2075
- 4,668,459 · +99.8%
- By 2100
- 5,533,242 · +136.8%
Race, ethnicity, and origin ACS 2023
- Neighborhood character
- Predominantly Hispanic (84%)
- Race & ethnicity
- Hispanic / Latino 84% Two or more races 37% Black 8% White 7% Native American 1%
- Hispanic origin (detail)
- Mexican 67% Puerto Rican 3%
- Common ancestry
- Portuguese 2% Lithuanian 2%
- Foreign-born
- 18% · Canada
- Languages at home
- 53% English-only · Spanish 46%
Political lean MEDSL · Bexar
- 2024 margin
- Lean D (+9.8) · D 54.3% · R 44.6% · Other 1.1%
- 2008→2024 swing
- +4.2pp toward D · 2008: 5.6pp · 2024: 9.8pp
- All cycles
- 2024: D+9.8 2020: D+18.2 2016: D+13.5 2012: D+4.6 2008: D+5.6
Not yet ingested
- Civics
- —
Market trends
- HPI YoY
- ▲ 1.34%
- Current HPI
- 257.4183
- Rent YoY
- ▲ 10.86%
- Metro
- San Antonio-New Braunfels, TX
- State GDP YoY
- ▲ 3.95%
- F500 in state
- 110
Industry mix (Fortune 500 HQ in TX)
| Industry | F500 HQs | Revenue |
|---|---|---|
| Energy | 16 | $1,198B |
|
||
| Technology | 5 | $198B |
|
||
| Engineering / Construction | 4 | $72B |
|
||
| Energy Services | 3 | $60B |
|
||
| Utilities | 3 | $41B |
|
||
| Healthcare | 2 | $330B |
|
||
Price history
+200.0% since first listed21 events — show timeline
- 2026-04-07 Listed $75,000 LERA
- 2025-08-01 Listing Removed — LERA
- 2025-07-25 Price Changed $75,000 LERA
- 2025-05-26 Price Changed $79,000 LERA
- 2025-04-13 Listed $85,000 LERA
- 2025-02-11 Sold (Public Records) — Public Records
- 2025-02-07 Sold (MLS) — LERA
- 2025-01-20 Pending — LERA
- 2025-01-16 Contingent — LERA
- 2024-12-04 Listed $85,000 LERA
- 2017-10-31 Sold (MLS) — LERA
- 2017-10-09 Sold (Public Records) — Public Records
- 2017-09-16 Pending — LERA
- 2017-09-13 Contingent — LERA
- 2017-08-21 Listed $50,000 LERA
- 2006-01-04 Sold (Public Records) — Public Records
- 2006-01-03 Sold (MLS) — LERA
- 2005-12-22 Listing Removed — LERA
- 2005-12-19 Listed $25,000 LERA
- 2005-08-10 Sold (Public Records) — Public Records
- 1998-03-01 Sold (Public Records) — Public Records
Property tax history
+10.3%/yrLatest (2025): $3,657 · -0.3% YoY. Source: county tax records.
Cash-flow waterfall
monthlySold comps — $/sqft
last 12 mo · ≤1 miLoading sold comps…