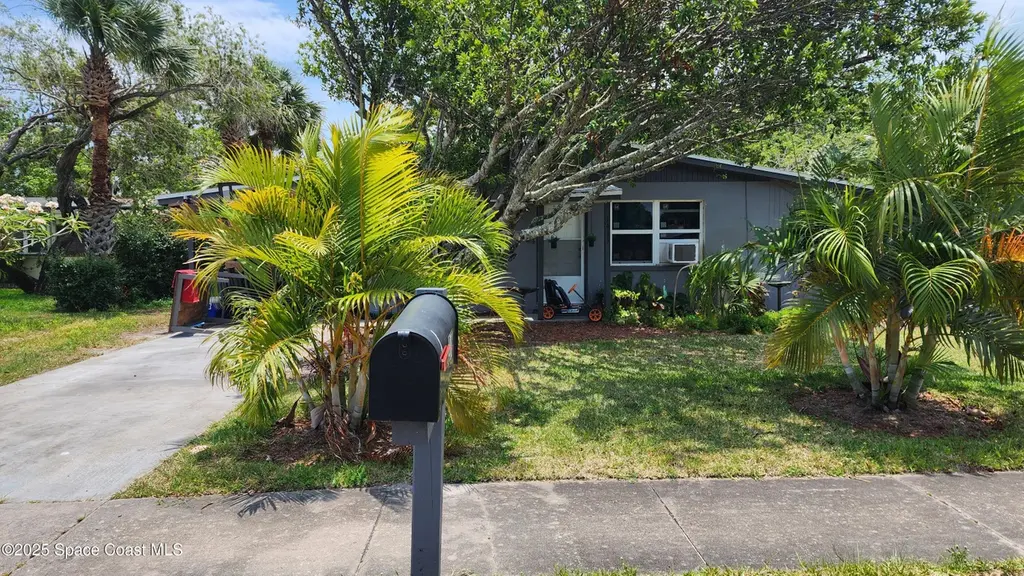
1411 Gibbs St · Melbourne, FL
Flood risk 1/10 · Minimal
- FEMA flood zone
- X (unshaded)
- Chance of flooding over 30 yrs
- 0.0%
- Est. flood insurance / yr
- $507 – $1,088
Fire risk 1/10 · Minimal
- Est. fire insurance / yr
- $947 – $1,759
Heat risk 10/10 · Severe
- Hot days now (above 105°F)
- 7 days/yr
- Hot days in 30 yrs
- 23 days/yr
Wind risk 10/10 · Severe
- Chance of severe wind over 30 yrs
- 99.0%
Air-quality risk 1/10 · Minimal
- Unhealthy air days now
- 0 days/yr
- Unhealthy air days in 30 yrs
- 0 days/yr
Risk factors via First Street. Map © Google.
Why this score? — see what drove the D+ grade
The composite is a weighted blend of 9 inputs, each scored 0–100. Each bar is that input's sub-score; the figure is the points it added to the 100-point composite (weight × sub-score).
- Cash flow +17.6/30.0
- ARV discount +7.5/15.0
- DSCR +5.5/10.0
- Schools +4.7/10.0
- 1% rule +4.4/10.0
- Rent growth +2.9/5.0
- Livability +2.5/5.0
- Condition / age +2.5/5.0
- Appreciation +0.0/10.0
$175,000
🖨 Deal sheet 📄 Offer letter ✓ Due diligence
Listing remarks MLS
A cute 3-bedroom 1 1/2-bathroom concrete block home with an open concept. New Roof installed in 2020. Hurricane impact windows and doors.
Key facts
- New roof
- 7,841 sq ft lot
- Parking
Tags
Property features AI
Exterior
- Parking: Carport (1 space)
- Security: Smoke detectors
- Utilities: Public sewer; Cable available and connected; Electricity available
- Home design: Single family residence; Property faces north
- Construction: Block and concrete construction; Shingle roof; Pets allowed
- Exterior features: Impact windows; Asphalt road frontage; Lot described as 'Other'
Interior
- Kitchen: Electric range; Refrigerator
- Bedrooms: 3 bedrooms
- Flooring: Carpet; Tile
- Bathrooms: 1 full bathroom
- Heating & cooling: Electric heating; Wall/window air conditioning units
- Interior features: Open floor plan; Primary bathroom with tub and shower
- Laundry & utility: Washer hookup; Electric dryer hookup
Neighborhood map
What this means for you Summary
Snapshot
- This is a 2-bed/1.0-bath single-family listed at $175k.
Deal economics
- At list price, monthly cash flow is $137 ($2k/yr) — positive.
- The deal already cash-flows at list — no discount required.
- To meet the 1% rule (rent ≥ 1% of price), the offer needs to be $164k (6.4% below list).
- Recommended offer: $164k (6.4% below list) — sets the bar for 1% rule.
Location & tenants
- Location reads: area grade D — affects rentability + tenant quality, not the cash-flow math above.
- Brevard (suburban): math 53% / reading 57% proficiency, ranked #19 of 73 in FL (top 26%) — acceptable for families but not a draw, mixed tenant base, ~2y average lease.
- Zoned schools: Stone Magnet Middle School (math 33% / reading 35%, grade F, #426 of 571 statewide, top 75%, 670 students, 69% FRL); Palm Bay Magnet Senior High School (math 25% / reading 37%, grade F, #429 of 667 statewide, top 65%, 1,486 students, 63% FRL) — zoned schools average 66% FRL vs 43% district-wide (23 pts higher); higher-poverty schools than district average — tighter screening recommended.
- Zoned-school proficiency averages 32% at this address vs 55% district-wide (-22 pts) — the specific schools serving this property underperform the Brevard average; the district grade overstates school quality for this exact location.
- Market conditions: Rents rising (+1.7%/yr); 202 active listings in the ZIP; 14 comparable units currently listed for rent nearby; rentals at typical pace (median 19d on market — plan ~3-4 weeks tenant-placement turnaround); 4,602 units permitted in Brevard County in 2024 (702 in 5+ unit buildings).
- This rent runs 36% of the median local income ($55k/yr) — at the standard rent-burdened threshold; future hikes will face affordability resistance.
Forward outlook
- Local home prices are declining (-3.0%/yr); year-one equity from $1k of loan paydown is wiped out by about $5k of value loss. Plan a longer hold.
- Brevard County population projected at +15% by 2050 — modest demand growth; plan on rents tracking national, not racing it.
Negotiation context
- It's been on market 78 days — a 6% lower offer ($164k) is reasonable based on typical stale-listing flexibility.
- 4 sale attempts since 6y ago with the ask held roughly flat each time — persistent listings suggest the price (not the market) is what's stuck; bring a comps-based counter.
- Current owner paid $75k; list at $175k implies a 133% gain — meaningful room to come down on a strong offer.
Risks & watch-outs
- Climate carrying-cost: severe wind risk, 99% chance of damaging wind over 30y; extreme-heat days projected 7→23/yr by 2055 (HVAC capex compounding) — expect insurance premiums to compound above CPI over the hold.
Questions for the listing agent
- It's been on market 78 days. Have you received any prior offers? Is the seller open to a 6% concession, seller financing, or rate buy-down credit?
- Built in 1964 — when were the roof, HVAC, electrical panel, plumbing, and water heater last replaced?
- Why hasn't it sold? Are there any deal-killer items the seller is aware of (foundation, flood, title, zoning, code violations)?
- Is there a deadline driving the sale (1031 exchange, divorce, estate, relocation)? That informs how much negotiation room exists.
- The area grade is low — what's the realistic commute time and amenity access for the typical tenant pool here? Any planned neighborhood developments (good or bad) we should know about?
- What's the average days-on-market for RENTAL listings here right now (not sales)? A rising rental-DOM trend means longer vacancies and softer asking-rent achievability than the comps imply.
- What's the recent tenant-quality profile in this submarket — average credit score on applications, eviction rate, late-payment / NSF rate, and stable-employment percentage? A property-management company in the area should have these aggregated.
- How much new for-sale + rental construction is in the pipeline within 1–3 miles? Heavy new supply typically softens prices + rents 12–24 months out; constrained supply supports both.
Investment metrics
- 1% rule
- 0.94% ✗
- Cap rate
- 7.23%
- Cash-on-cash
- 3.35%
- DSCR
- 1.15
- GRM
- 8.9
CMA / ARV
No comps found within radius.
Projected returns pro-forma
-3.0% appreciation · 1.7% rent growth · sell at horizon
- IRR
- -12.5%
- Equity multiple
- 0.56×
- Total profit
- $-21,772
- Equity at exit
- $26,093
- IRR
- -5.4%
- Equity multiple
- 0.67×
- Total profit
- $-16,229
- Equity at exit
- $15,131
Cash invested: $49,000 (down + closing). Projections, not guarantees.
Landlord ↔ Tenant lean methodology
- Overall (STATE)
- 87 Strongly Landlord-Friendly
- State Florida
- 87 Strongly Landlord-Friendly · R+3
- County
- — inherits STATE
- City
- — inherits STATE
ZIP-level market 32901
- Home prices YoY
- -31.0%
- Rents YoY
- 1.7%
- Active inventory
- 202
- Price-to-rent
- 8.9×
Monthly cashflow live
- Estimated rent
- $1,638 high interval (Pro) →
- Mortgage (P&I)
- −$918
- Tax from tax record
- −$166 /mo · $1,997/yr
- Insurance
- −$73
- HOA
- −$0
- Vacancy / Maint / Mgmt
- −$344
- Net cashflow
- $137
Break-even live
UW: 25.0% down · 7.5% · 30yr · 1.5% tax · 5.0% vac · 8.0% maint · 8.0% mgmt
Financing live
Cash to close
- Down payment
- $43,750
- Closing costs
- $5,250
- Reserves months
- —
- Total cash needed
- —
Loan-product check · same deal, 3 products live
Conventional
25% down · 7.5% · 30yr
- Down + closing
- —
- Monthly P&I
- —
- Monthly cashflow
- —
- DSCR
- —
- Eligible?
- —
Personal DTI + credit; lowest rate.
DSCR
20% down · 8.5% · 30yr
- Down + closing
- —
- Monthly P&I
- —
- Monthly cashflow
- —
- DSCR
- —
- Eligible?
- —
No personal income docs; deal must DSCR.
Hard money
10% down · 12.0% · 12mo
- Down + closing
- —
- Monthly P&I
- —
- Monthly cashflow
- —
- DSCR
- —
- Eligible?
- —
Short-term bridge; refi at stabilization.
Rent comps 14 comps
| Address | Beds | Baths | Sqft | Rent | $/sqft | DOM | Units | Dist |
|---|---|---|---|---|---|---|---|---|
| 2643B Kingswood Dr NE Palm Bay, FL | 3.0 | 1.0 | 1000 | $1,650 | $1.65 | 18d | 1 | 0.54mi |
| 2331 Commerce Park Dr NE Palm Bay, FL | 1.0–3.0 | 1.0–2.0 | 1094 | $1,736 | $1.59 | 13d | 33 | 0.65mi |
| 2361 Commerce Park Dr NE Palm Bay, FL | 1.0–3.0 | 1.0–2.0 | 1106 | $1,902 | $1.72 | 13d | 47 | 0.72mi |
| 2155 Robert J Conlan Blvd NE Palm Bay, FL | 1.0–3.0 | 1.0–2.0 | 1093 | $1,740 | $1.59 | 13d | 20 | 0.75mi |
| 2522 Amberly Rd NE Palm Bay, FL | 2.0 | 1.0 | 672 | $1,300 | $1.93 | 23d | 1 | 0.81mi |
| 2399 Coconut Palm Dr NE Palm Bay, FL | 2.0 | 2.0 | 968 | $1,795 | $1.85 | 23d | 1 | 0.83mi |
| 1002 Brothers Ave Unit 101 Melbourne, FL | 1.0 | 1.0 | 700 | $1,445 | $2.06 | 23d | 1 | 0.86mi |
| 2700 Carlson Cir Melbourne, FL | 1.0–2.0 | 1.0–2.0 | 879 | $1,242 | $1.41 | 23d | 1 | 0.99mi |
| 248 E University Blvd Melbourne, FL | 1.0–2.0 | 1.0 | 720 | $1,449 | $2.01 | 14d | 5 | 1.05mi |
| 3008 Hanson Ave Melbourne, FL | 1.0 | 1.0 | 840 | $1,125 | $1.34 | 23d | 1 | 1.13mi |
| 100 E University Blvd Melbourne, FL | 1.0–3.0 | 1.0–1.5 | 756 | $1,437 | $1.90 | 13d | 16 | 1.28mi |
| 3151 S Babcock St Melbourne, FL | 1.0–2.0 | 1.0–2.0 | 807 | $1,595 | $1.98 | 14d | 10 | 1.28mi |
| 635 E New Haven Ave Melbourne, FL | 1.0–2.0 | 1.0–2.0 | 899 | $2,700 | $3.00 | 23d | 1 | 1.36mi |
| 603 E New Haven Ave Melbourne, FL | 1.0 | 1.0 | 1118 | $1,575 | $1.41 | 14d | 1 | 1.39mi |
Listing history 16 events
-
2026-06-10days on market $175,000 Active 78 DOM
-
2026-06-08days on market $175,000 Active 76 DOM
-
2026-06-07days on market $175,000 Active 75 DOM
-
2026-06-05days on market $175,000 Active 72 DOM
-
2026-06-03days on market $175,000 Active 71 DOM
-
2026-06-02days on market $175,000 Active 70 DOM
-
2026-06-01days on market $175,000 Active 69 DOM
-
2026-05-31days on market $175,000 Active 68 DOM
-
2026-05-31days on market $175,000 Active 67 DOM
-
2026-03-24$175,000 Active
-
2026-03-22historical 137-char remark
Show marketing remark (137 chars)
A cute 3-bedroom 1 1/2-bathroom concrete block home with an open concept. New Roof installed in 2020. Hurricane impact windows and doors.
-
2025-05-22$175,000 Active 137-char remark
Show marketing remark (137 chars)
A cute 3-bedroom 1 1/2-bathroom concrete block home with an open concept. New Roof installed in 2020. Hurricane impact windows and doors.
-
2020-11-19soldstatus $75,000
-
2020-11-18soldstatus $75,000 Closed 57-char remark
Show marketing remark (57 chars)
Cute 2bd concrete block home. New Roof installed in 2020.
-
2020-09-23Contingent 57-char remark
Show marketing remark (57 chars)
Cute 2bd concrete block home. New Roof installed in 2020.
-
2020-09-22$75,000 57-char remark
Show marketing remark (57 chars)
Cute 2bd concrete block home. New Roof installed in 2020.
ⓘ Source: listings_history table (triggers on properties + properties_extension) + one-shot
backfill from property_details.listing_events for pre-trigger history.
Tax reassessment forecast FL · Resets to sale price
- Current annual tax
- $1,997 · $166/mo
- Projected year-2 tax
- $1,997 · $166/mo
- Expected delta
- $0/yr ($0/mo · 0.0%)
ⓘ Screening estimate from a state-policy table — verify with the county assessor before closing.
Climate risk First Street
- Flood 1/10 Low FEMA zone X (unshaded) · 0% chance over 30 yrs
- Wildfire 1/10 Low
- Heat 10/10 Extreme 7 d/yr ≥105°F today · 23 d/yr by 30 yrs out
- Wind 10/10 Extreme 99% chance of damaging wind over 30 yrs
- Air quality 1/10 Low 0 unhealthy d/yr today · 0 by 30 yrs out
Nearby sold comps map
Loading sold comps map…
Walkable amenities ~0.75 mi
Loading nearby amenities…
Taxation est. · year 1
- Rental income
- $19,652
- − Mortgage interest
- −$9,803
- − Property taxes
- −$1,997
- − Insurance
- −$875
- − Repairs & maintenance
- −$1,572
- − Management
- −$1,572
- − Depreciation
- −$5,091
- Taxable loss
- −$1,258
- Est. tax savings @ 24.0%
- +$302
- After-tax cash flow
- $1,943/yr
For passive investors: Depreciation is non-cash, so a rental often shows a tax loss while cash-flowing — sheltering income. Rental losses are passive: they offset passive income freely, and up to $25,000/yr can offset ordinary (W-2) income if you actively participate and your MAGI is under $100k (phasing out to $0 by $150k); unused losses carry forward. On sale, claimed depreciation is recaptured at up to 25%, and gains may owe capital-gains tax (a 1031 exchange can defer both). Figures are a year-1 estimate at your 24.0% rate — not tax advice; consult a CPA.
Schools (NCES district)
- District
- Brevard
- NCES district ID
- 1200150
- Math proficiency
- 53% ▼ -9.00%
- Reading proficiency
- 57% ▼ -4.00%
- Median HH income
- $49,426
- Composite
- 46.86/100
- National rank
- #2370
- State rank
- #19 of 73 in FL
Livability — Melbourne
No livability data for this city. (Only ~50 U.S. cities are tracked.)
Census & demographics
- Census place
- Melbourne, FL
- County
- Brevard County · 602,871 people
- City population
- 178,420
- Metro
- Palm Bay-Melbourne-Titusville, FL
- Population (ZIP)
- 28,923
- Household income
- $54,651
- Rent vs Own
- Severe rent burden
- 2018.0
Population outlook (Brevard County) Hauer SSP2
- Today (2025)
- 623,254 people
- By 2030
- 648,420 · +4.0%
- By 2040
- 690,009 · +10.7%
- By 2050
- 715,669 · +14.8%
- By 2075
- 775,744 · +24.5%
- By 2100
- 776,687 · +24.6%
Race, ethnicity, and origin ACS 2023
- Neighborhood character
- Diverse neighborhood (Simpson 0.56)
- Race & ethnicity
- White 62% Black 18% Hispanic / Latino 11% Two or more races 8% Asian 4%
- Hispanic origin (detail)
- Mexican 2% Puerto Rican 4%
- Common ancestry
- Romanian 4% Lithuanian 3% Slovak 1%
- Foreign-born
- 14% · Canada, Vietnam, Jamaica
- Languages at home
- 85% English-only · Spanish 7% Other Indo-European 2% Vietnamese 2%
Political lean MEDSL · Brevard
- 2024 margin
- Strong R (+20.8) · D 39.1% · R 59.9% · Other 1.0%
- 2008→2024 swing
- -10.4pp toward R · 2008: -10.4pp · 2024: -20.8pp
- All cycles
- 2024: R+20.8 2020: R+16.4 2016: R+19.8 2012: R+12.7 2008: R+10.4
Not yet ingested
- Civics
- —
Market trends
- HPI YoY
- ▼ -145.13%
- Current HPI
- 322.934
- Rent YoY
- ▲ 1.70%
- Metro
- Palm Bay-Melbourne-Titusville, FL
- State GDP YoY
- ▲ 3.28%
- F500 in state
- 36
Industry mix (Fortune 500 HQ in FL)
| Industry | F500 HQs | Revenue |
|---|---|---|
| Industrial Technology | 2 | $29B |
|
||
| Insurance | 2 | $17B |
|
||
| Retail | 1 | $60B |
|
||
| Technology Distribution | 1 | $58B |
|
||
| Homebuilding | 1 | $35B |
|
||
| Technology Manufacturing | 1 | $35B |
|
||
Price history
+133.3% since first listed7 events — show timeline
- 2026-03-24 Listed $175,000 SCMLS
- 2026-03-22 Listing Removed — SCMLS
- 2025-05-22 Listed $175,000 SCMLS
- 2020-11-19 Sold (Public Records) $75,000 Public Records
- 2020-11-18 Sold (MLS) $75,000 SCMLS
- 2020-09-23 Listed — SCMLS
- 2020-09-22 Listed $75,000 SCMLS
Property tax history
+15.5%/yrLatest (2025): $1,997 · +13.8% YoY. Source: county tax records.
Cash-flow waterfall
monthlySold comps — $/sqft
last 12 mo · ≤1 miLoading sold comps…