15 Mill St · Bridgewater, NY
Flood risk 1/10 · Minimal
- FEMA flood zone
- X (unshaded)
- Chance of flooding over 30 yrs
- 0.0%
- Est. flood insurance / yr
- $473 – $860
Fire risk 1/10 · Minimal
- Est. fire insurance / yr
- $691 – $1,283
Heat risk 2/10 · Minimal
- Hot days now (above 93°F)
- 8 days/yr
- Hot days in 30 yrs
- 18 days/yr
Wind risk 2/10 · Minimal
- Chance of severe wind over 30 yrs
- 1.0%
Air-quality risk 1/10 · Minimal
- Unhealthy air days now
- 0 days/yr
- Unhealthy air days in 30 yrs
- 0 days/yr
Risk factors via First Street. Map © Google.
Why this score? — see what drove the C grade
The composite is a weighted blend of 9 inputs, each scored 0–100. Each bar is that input's sub-score; the figure is the points it added to the 100-point composite (weight × sub-score).
- Cash flow +15.1/30.0
- ARV discount +15.0/15.0
- Appreciation +6.5/10.0
- 1% rule +5.2/10.0
- DSCR +4.6/10.0
- Schools +4.2/10.0
- Livability +3.2/5.0
- Rent growth +2.5/5.0
- Condition / age +2.5/5.0
$124,900
🖨 Deal sheet (PDF) 📄 Offer letter ✓ Due diligence
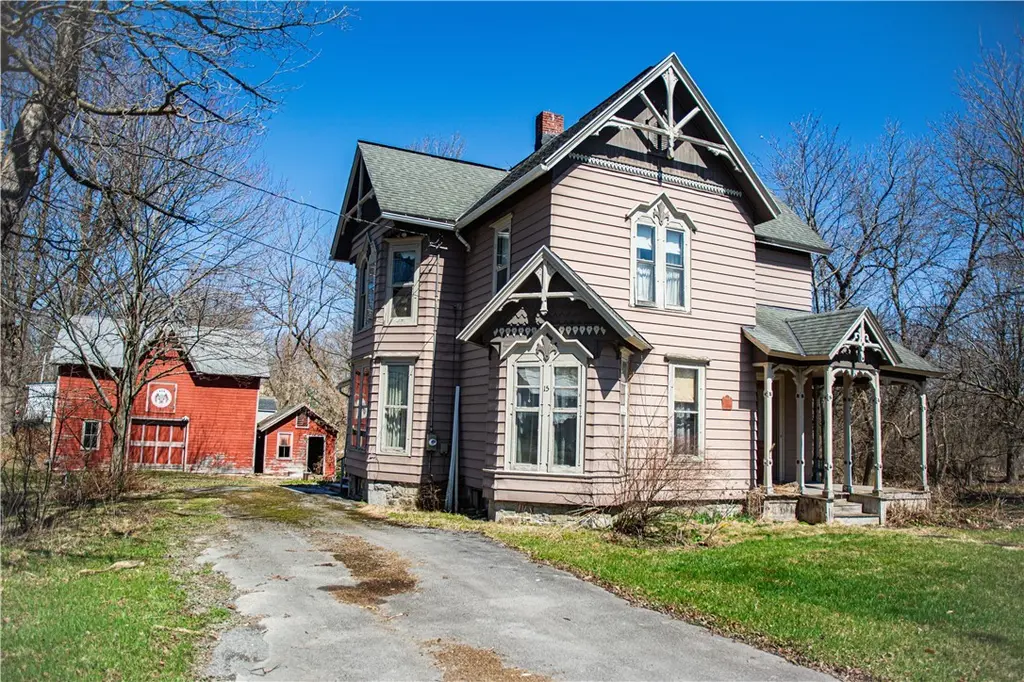
Listing remarks
Own a piece of history with this circa 1880 home, brimming with the original charm and architecture located on a side street in a small town of Central New York. Step back in time with this gem, ready to be restored to its former glory. Rich with character, this historic home offers soaring ceilings, original woodwork, original velvet curtains over the pocket doors in the pantry and timeless craftsmanship rarely found today. A true blank canvas, this property invites visionaries, preservationists and dreamers to breathe new life into its strong bones. With the right vision, this home can be transformed into a stunning historic showpiece, a true one-of-a-kind residence or high-value resale.
Key facts
- Carriage barn
- Pocket doors
- Oversized yard
Tags
Property features AI
Exterior
- Parking: Detached garage
- Utilities: Electricity connected; Cable available; High-speed internet available; Water available (public and well listed); Septic tank
- Home design: 2-story house; Existing (established) construction
- Construction: Aluminum siding; Blown-in insulation; Asphalt shingle roof; Stone foundation
- Exterior features: Covered porch; Blacktop driveway; Barn(s); Outbuilding; Shed(s); Storage
Interior
- Kitchen: Country-style kitchen; Refrigerator
- Bedrooms: Includes a second bedroom
- Flooring: Hardwood; Vinyl; Varied flooring
- Bathrooms: 1 full bathroom (on the main level)
- Heating & cooling: Forced air heating; Oil heating
- Interior features: Separate/formal dining room; Entrance foyer; Country kitchen; Natural woodwork; Window treatments; Drapes; Leaded glass windows; Storm windows; Wood window frames; Partially furnished
- Laundry & utility: Main-level laundry; Washer; Dryer; Electric water heater
Neighborhood map
What this means for you Summary
Snapshot
- This is a 3-bed/1.0-bath single-family listed at $125k.
Deal economics
- At list price, monthly cash flow is $40 ($484/yr) — positive.
- The deal already cash-flows at list — no discount required.
- Meets the 1% rule at list price ($1k rent vs $125k).
- Recommended offer: $123k (1.5% below list) — sets the bar for market timing.
Location & tenants
- Location reads 64/100 on livability (#729 in NY) — a middle-class / working-renter tenant base. Strengths: cost of living A+, housing A+, health & safety A+; Watch: employment D+, schools D, crime F.
- Mount Markham Central School District (rural): math 47% / reading 52% proficiency, ranked #393 of 590 in NY (top 67%) — families likely to look elsewhere, expect single-tenant / working-renter base with shorter leases.
- Market conditions: 5 active listings in the ZIP; 204 units permitted in Oneida County in 2024 (68 in 5+ unit buildings).
Forward outlook
- In year one you build about $5k of equity ($864 loan paydown + $4k appreciation (3.0% local appreciation)).
- Oneida County population projected at -12% by 2050 — secular population decline; favor cash flow + early exit over multi-decade hold.
- At projected returns (3.0% appreciation + 3.0% rent growth), your $35k cash investment doubles in ~6 years — after that, you're playing with house money.
- By year 8, paydown + projected appreciation supports a ~$34k cash-out refi (75% LTV) — recoverable capital for the next deal without selling this one.
Negotiation context
- It's been on market 15 days — a 2% lower offer ($123k) is reasonable based on typical stale-listing flexibility.
Risks & watch-outs
- Watch-outs: property tax is 2.5% of price; built in 1880 — expect roof / HVAC / electrical / plumbing capex.
Questions for the listing agent
- Built in 1880 — when were the roof, HVAC, electrical panel, plumbing, and water heater last replaced?
- Property tax is high relative to price — has the assessment been appealed recently, and will the sale trigger a re-assessment?
- Is there a deadline driving the sale (1031 exchange, divorce, estate, relocation)? That informs how much negotiation room exists.
- Schools are D-rated, which usually means shorter tenancies and higher turnover. Who's the typical renter profile here, and what's been the actual vacancy rate?
- Crime grade is F in this area — have there been break-ins, vandalism, or insurance claims at this property in the last 3 years? What carrier currently insures it and at what premium?
- What's the average days-on-market for RENTAL listings here right now (not sales)? A rising rental-DOM trend means longer vacancies and softer asking-rent achievability than the comps imply.
- What's the recent tenant-quality profile in this submarket — average credit score on applications, eviction rate, late-payment / NSF rate, and stable-employment percentage? A property-management company in the area should have these aggregated.
- How much new for-sale + rental construction is in the pipeline within 1–3 miles? Heavy new supply typically softens prices + rents 12–24 months out; constrained supply supports both.
Investment metrics
- 1% rule
- 1.02% ✓
- Cap rate
- 6.68%
- Cash-on-cash
- 1.38%
- DSCR
- 1.06
- GRM
- 8.1
CMA / ARV
- ARV (on-the-fly)
- $243,376
- Comps found
- 2
Show comp detail 2 sales within ~0.75 mi
| Address | Dist | Beds/Ba | Sqft | Sold | Price | $/sf | Match |
|---|---|---|---|---|---|---|---|
| 15 Mill St | 0.00mi | 3/1.0 | 2,296 (0%) | 1mo | $120,000 | $52 | 99 |
| 26 Cottage Ln | 0.15mi | 3/2.5 | 2,268 (-1%) | 1mo | $240,000 | $106 | 84 |
Match score weights: distance 35% · size 25% · config 20% · recency 20%. Top-matched comps best support the ARV.
Projected returns pro-forma
2.96% appreciation · 3.0% rent growth · sell at horizon
- IRR
- 8.7%
- Equity multiple
- 1.50×
- Total profit
- $17,436
- Equity at exit
- $55,877
- IRR
- 11.3%
- Equity multiple
- 2.69×
- Total profit
- $58,934
- Equity at exit
- $85,894
Cash invested: $34,972 (down + closing). Projections, not guarantees.
Landlord ↔ Tenant lean methodology
- Overall (STATE)
- 15 Strongly Tenant-Friendly
- State New York
- 15 Strongly Tenant-Friendly · D+10
- County
- — inherits STATE
- City
- — inherits STATE
ZIP-level market 13313
- Home prices YoY
- 1.8%
- Active inventory
- 5
- Price-to-rent
- 8.1×
Monthly cashflow live
- Estimated rent
- $1,280 medium interval (Pro) →
- Mortgage (P&I)
- −$655
- Tax from tax record
- −$264 /mo · $3,163/yr
- Insurance
- −$52
- HOA
- −$0
- Vacancy / Maint / Mgmt
- −$269
- Net cashflow
- $40
Break-even live
Sensitivity live
| Price | -10% $111 | -5% $76 | +0% $40 | +5% $5 | +10% $-30 |
|---|---|---|---|---|---|
| Rent | -10% $-61 | -5% $-10 | +0% $40 | +5% $91 | +10% $141 |
| Rate | -1.0pp $103 | -0.5pp $72 | base $40 | +0.5pp $8 | +1.0pp $-25 |
UW: 25.0% down · 7.5% · 30yr · 1.5% tax · 5.0% vac · 8.0% maint · 8.0% mgmt
Financing live
Cash to close
- Down payment
- $31,225
- Closing costs
- $3,747
- Reserves months
- —
- Total cash needed
- —
Loan-product check · same deal, 3 products live
Conventional
25% down · 7.5% · 30yr
- Down + closing
- —
- Monthly P&I
- —
- Monthly cashflow
- —
- DSCR
- —
- Eligible?
- —
Personal DTI + credit; lowest rate.
DSCR
20% down · 8.5% · 30yr
- Down + closing
- —
- Monthly P&I
- —
- Monthly cashflow
- —
- DSCR
- —
- Eligible?
- —
No personal income docs; deal must DSCR.
Hard money
10% down · 12.0% · 12mo
- Down + closing
- —
- Monthly P&I
- —
- Monthly cashflow
- —
- DSCR
- —
- Eligible?
- —
Short-term bridge; refi at stabilization.
Listing history 2 events
-
2026-04-24status Pending
-
2026-04-09$124,900 Active
ⓘ Source: listings_history table (triggers on properties + properties_extension) + one-shot
backfill from property_details.listing_events for pre-trigger history.
Tax reassessment forecast NY · Partial reset (capped growth)
- Current annual tax
- $3,163 · $264/mo
- Projected year-2 tax
- $3,163 · $264/mo
- Expected delta
- $0/yr ($0/mo · 0.0%)
ⓘ Screening estimate from a state-policy table — verify with the county assessor before closing.
Climate risk First Street
- Flood 1/10 Low FEMA zone X (unshaded) · 0% chance over 30 yrs
- Wildfire 1/10 Low
- Heat 2/10 Low 8 d/yr ≥93°F today · 18 d/yr by 30 yrs out
- Wind 2/10 Low 100% chance of damaging wind over 30 yrs
- Air quality 1/10 Low 0 unhealthy d/yr today · 0 by 30 yrs out
Nearby sold comps map
Loading sold comps map…
Walkable amenities ~0.75 mi
Loading nearby amenities…
Taxation est. · year 1
- Rental income
- $15,356
- − Mortgage interest
- −$6,996
- − Property taxes
- −$3,163
- − Insurance
- −$624
- − Repairs & maintenance
- −$1,228
- − Management
- −$1,228
- − Depreciation
- −$3,633
- Taxable loss
- −$1,518
- Est. tax savings @ 24.0%
- +$364
- After-tax cash flow
- $849/yr
For passive investors: Depreciation is non-cash, so a rental often shows a tax loss while cash-flowing — sheltering income. Rental losses are passive: they offset passive income freely, and up to $25,000/yr can offset ordinary (W-2) income if you actively participate and your MAGI is under $100k (phasing out to $0 by $150k); unused losses carry forward. On sale, claimed depreciation is recaptured at up to 25%, and gains may owe capital-gains tax (a 1031 exchange can defer both). Figures are a year-1 estimate at your 24.0% rate — not tax advice; consult a CPA.
Schools (NCES district)
- District
- Mount Markham Central School District
- NCES district ID
- 3630930
- Math proficiency
- 47% ▼ -2.00%
- Reading proficiency
- 52% ▲ 10.00%
- Median HH income
- $49,456
- Composite
- 42.3/100
- National rank
- #3262
- State rank
- #393 of 590 in NY
Livability — Bridgewater
- Score
- 64/100
- State rank
- #729
- US rank
- #13951
Category grades
Schools grade is shown separately in the Schools card above.
Census & demographics
- Census place
- Bridgewater, NY
- Population (ZIP)
- 562
Population outlook (Oneida County) Hauer SSP2
- Today (2025)
- 225,223 people
- By 2030
- 220,384 · -2.1%
- By 2040
- 209,071 · -7.2%
- By 2050
- 197,920 · -12.1%
- By 2075
- 175,541 · -22.1%
- By 2100
- 148,491 · -34.1%
Race, ethnicity, and origin ACS 2023
- Neighborhood character
- Predominantly White (86%)
- Race & ethnicity
- White 86% Hispanic / Latino 9% Two or more races 2%
- Hispanic origin (detail)
- Dominican 9%
- Common ancestry
- Lithuanian 4% Iranian 3% Slovak 1%
- Languages at home
- 92% English-only · Spanish 8%
Political lean MEDSL · Oneida
- 2024 margin
- Strong R (+21.3) · D 39.4% · R 60.6%
- 2008→2024 swing
- -15.2pp toward R · 2008: -6.1pp · 2024: -21.3pp
- All cycles
- 2024: R+21.3 2020: R+15.5 2016: R+21.1 2012: R+5.3 2008: R+6.1
Not yet ingested
- Civics
- —
Market trends
- HPI YoY
- ▲ 2.96%
- Current HPI
- 165.8918
- Rent YoY
- —
- Metro
- —
- State GDP YoY
- ▲ 2.60%
- F500 in state
- 92
Industry mix (Fortune 500 HQ in NY)
| Industry | F500 HQs | Revenue |
|---|---|---|
| Financial Services | 10 | $950B |
|
||
| Consumer Goods | 9 | $162B |
|
||
| Insurance | 4 | $225B |
|
||
| Telecommunications | 2 | $144B |
|
||
| Pharmaceuticals | 2 | $112B |
|
||
| Media / Entertainment | 2 | $69B |
|
||
Price history
2 events — show timeline
- 2026-04-24 Pending — UNYREIS
- 2026-04-09 Listed $124,900 UNYREIS
Property tax history
-0.4%/yrLatest (2025): $3,163 · -1.3% YoY. Source: county tax records.
Cash-flow waterfall
monthlySold comps — $/sqft
last 12 mo · ≤1 miLoading sold comps…