45931 Mill Ave · Bennett, CO
Flood risk No data
- FEMA flood zone
- —
- Chance of flooding over 30 yrs
- —
- Est. flood insurance / yr
- —
Fire risk No data
- Est. fire insurance / yr
- —
Heat risk No data
- Hot days now (above threshold)
- —
- Hot days in 30 yrs
- —
Wind risk No data
- Chance of severe wind over 30 yrs
- —
Air-quality risk No data
- Unhealthy air days now
- —
- Unhealthy air days in 30 yrs
- —
Risk factors via First Street. Map © Google.
Why this score? — see what drove the D- grade
The composite is a weighted blend of 9 inputs, each scored 0–100. Each bar is that input's sub-score; the figure is the points it added to the 100-point composite (weight × sub-score).
- Appreciation +10.0/10.0
- Cash flow +7.1/30.0
- ARV discount +5.6/15.0
- Livability +3.0/5.0
- Rent growth +2.5/5.0
- Condition / age +2.5/5.0
- 1% rule +2.2/10.0
- Schools +2.1/10.0
- DSCR +1.3/10.0
$467,400
🖨 Deal sheet (PDF) 📄 Offer letter ✓ Due diligence
Listing remarks
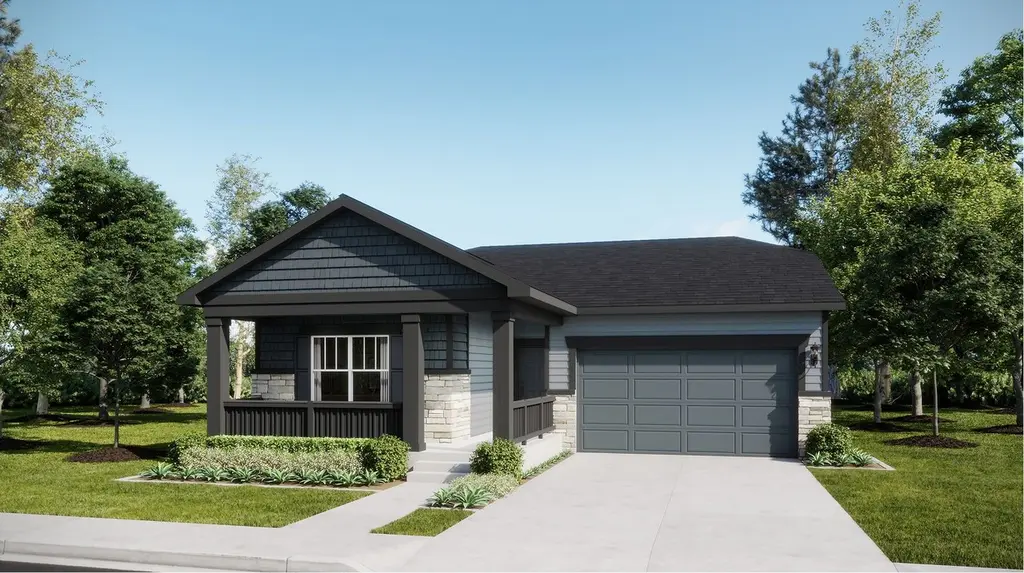
* * * * Contact builder today about Special Financing for this home – terms and conditions apply Anticipated Completion August 2026! Feel right at home in this beautiful Hartford ranch plan located in Muegge Farms community. Featuring 4 beds, 2 baths, great room, kitchen and 2 car garage. Beautiful upgrades and finishes throughout including luxury vinyl plank flooring, stainless steel appliances and more. The builder provides the latest in energy efficiency and state of the art technology with several fabulous floor plans to choose from. What some builders consider high-end upgrades, this builder makes a standard inclusion. Muegge Farms offers single family homes for every lifes
Key facts
- Hartford ranch plan
- Energy efficiency
- Fence included
Tags
Property features AI
Finance
- Other: Address: 45931 Mill Ave, Bennett CO 80102; Inventory type: Spec; Plan name: Hartford; Listing last modified: 2026-06-09
- Financial info: List price $467,400
Exterior
- Parking: 1 garage space (1 total parking space)
- Home design: Single-family property; Active listing
- Exterior features: Living area approximately 1,824
Interior
- Bedrooms: 4 bedrooms
- Bathrooms: 2 full bathrooms
- Interior features: Spec-built Hartford plan
Neighborhood map
What this means for you Summary
Snapshot
- This is a 4-bed/2.0-bath single-family listed at $467k.
Deal economics
- At list price, monthly cash flow is $-668 ($-8k/yr) — negative.
- To cash-flow at today's rent, offer at most $371k (20.7% below list).
- To meet the 1% rule (rent ≥ 1% of price), the offer needs to be $337k (27.9% below list).
- Recommended offer: $337k (27.9% below list) — sets the bar for 1% rule.
Location & tenants
- Location reads 59/100 on livability (#263 in CO) — a working-class tenant base; expect higher turnover. Strengths: housing A+, crime A-; Watch: cost of living D+, amenities F, commute F.
- Bennett School District No. 29J (rural): math 13% / reading 31% proficiency, ranked #69 of 86 in CO (top 80%) — low school quality limits family demand, transient renter base, plan for 1-2y turnover.
- Zoned schools: Bennett Elementary School (math 24% / reading 12%, grade F, #745 of 966 statewide, top 77%, 257 students, 37% FRL); Bennett Middle School (math 8% / reading 42%, grade F, #168 of 270 statewide, top 63%, 304 students, 38% FRL); Bennett High School (math 22% / reading 47%, grade F, #209 of 381 statewide, top 56%, 427 students, 25% FRL).
- Market conditions: 213 active listings in the ZIP; 2 comparable units currently listed for rent nearby; 2,299 units permitted in Adams County in 2024 (343 in 5+ unit buildings).
Forward outlook
- In year one you build about $50k of equity ($3k loan paydown + $47k appreciation (10.0% local appreciation)).
- Adams County population projected at +44% by 2050 — long-run rental-demand tailwind backs the buy-and-hold thesis.
- By year 2, paydown + projected appreciation supports a ~$80k cash-out refi (75% LTV) — recoverable capital for the next deal without selling this one.
Negotiation context
- Only 4 days on market — expect competitive offers; lowballing is unlikely to land.
Questions for the listing agent
- What do current leases actually rent for vs. the listed asking? Can we see a recent rent roll and the last 12 months of T-12 income?
- What does the HOA fee cover, when was the last increase, and are there any pending special assessments or reserve-fund shortfalls?
- Is there a deadline driving the sale (1031 exchange, divorce, estate, relocation)? That informs how much negotiation room exists.
- Schools are F-rated, which usually means shorter tenancies and higher turnover. Who's the typical renter profile here, and what's been the actual vacancy rate?
- The area grade is low — what's the realistic commute time and amenity access for the typical tenant pool here? Any planned neighborhood developments (good or bad) we should know about?
- What's the average days-on-market for RENTAL listings here right now (not sales)? A rising rental-DOM trend means longer vacancies and softer asking-rent achievability than the comps imply.
- What's the recent tenant-quality profile in this submarket — average credit score on applications, eviction rate, late-payment / NSF rate, and stable-employment percentage? A property-management company in the area should have these aggregated.
- How much new for-sale + rental construction is in the pipeline within 1–3 miles? Heavy new supply typically softens prices + rents 12–24 months out; constrained supply supports both.
Investment metrics
- 1% rule
- 0.72% ✗
- Cap rate
- 4.58%
- Cash-on-cash
- -6.12%
- DSCR
- 0.73
- GRM
- 11.6
CMA / ARV
- ARV (on-the-fly)
- $448,704
- Comps found
- 12
Show comp detail 12 sales within ~0.75 mi
| Address | Dist | Beds/Ba | Sqft | Sold | Price | $/sf | Match |
|---|---|---|---|---|---|---|---|
| 45886 Mill Ave | 0.06mi | 4/3.0 | 1,880 (+3%) | 1mo | $451,400 | $240 | 87 |
| 45870 Mill Ave | 0.08mi | 4/3.0 | 1,880 (+3%) | 3mo | $474,900 | $253 | 85 |
| 45840 Laceleaf Dr | 0.23mi | 3/3.0 (-1) | 1,725 (-5%) | 3mo | $435,000 | $252 | 69 |
| 46581 Sunflower Ln | 0.41mi | 4/4.0 | 1,930 (+6%) | 3mo | $481,720 | $250 | 61 |
| 46537 Sunflower Ln | 0.38mi | 4/4.0 | 1,944 (+7%) | 4mo | $429,999 | $221 | 60 |
| 46589 Sunflower Ln | 0.43mi | 3/3.0 (-1) | 1,944 (+7%) | 1mo | $459,390 | $236 | 59 |
| 46573 Sunflower Ln | 0.41mi | 3/3.0 (-1) | 1,944 (+7%) | 3mo | $467,999 | $241 | 58 |
| 46561 Sunflower Ln | 0.40mi | 4/4.0 | 1,944 (+7%) | 5mo | $447,000 | $230 | 58 |
| 46569 Sunflower Ln | 0.41mi | 3/3.0 (-1) | 1,944 (+7%) | 4mo | $424,999 | $219 | 58 |
| 46526 Avery Ln | 0.44mi | 3/2.0 (-1) | 1,643 (-10%) | 3mo | $419,990 | $256 | 56 |
| 46521 Avery Ln | 0.42mi | 3/2.0 (-1) | 1,643 (-10%) | 5mo | $409,000 | $249 | 55 |
| 46570 Avery Ln | 0.47mi | 3/3.0 (-1) | 1,643 (-10%) | 4mo | $404,999 | $246 | 49 |
Match score weights: distance 35% · size 25% · config 20% · recency 20%. Top-matched comps best support the ARV.
Projected returns pro-forma
10.0% appreciation · 3.0% rent growth · sell at horizon
- IRR
- 20.0%
- Equity multiple
- 2.62×
- Total profit
- $212,146
- Equity at exit
- $421,071
- IRR
- 18.3%
- Equity multiple
- 6.03×
- Total profit
- $658,400
- Equity at exit
- $908,055
Cash invested: $130,872 (down + closing). Projections, not guarantees.
Landlord ↔ Tenant lean methodology
- Overall (STATE)
- 38 Tenant-Leaning
- State Colorado
- 38 Tenant-Leaning · D+4
- County
- — inherits STATE
- City
- — inherits STATE
ZIP-level market 80102
- Home prices YoY
- 3.1%
- Active inventory
- 213
- Price-to-rent
- 11.6×
Monthly cashflow live
- Estimated rent
- $3,370 medium interval (Pro) →
- Mortgage (P&I)
- −$2,451
- Tax est. 1.5%
- −$584 /mo · $7,011/yr
- Insurance
- −$195
- HOA
- −$100
- Vacancy / Maint / Mgmt
- −$708
- Net cashflow
- $-668
Break-even live
Sensitivity live
| Price | -10% $-345 | -5% $-506 | +0% $-668 | +5% $-829 | +10% $-991 |
|---|---|---|---|---|---|
| Rent | -10% $-934 | -5% $-801 | +0% $-668 | +5% $-535 | +10% $-401 |
| Rate | -1.0pp $-432 | -0.5pp $-549 | base $-668 | +0.5pp $-789 | +1.0pp $-912 |
UW: 25.0% down · 7.5% · 30yr · 1.5% tax · 5.0% vac · 8.0% maint · 8.0% mgmt
Financing live
Cash to close
- Down payment
- $116,850
- Closing costs
- $14,022
- Reserves months
- —
- Total cash needed
- —
Loan-product check · same deal, 3 products live
Conventional
25% down · 7.5% · 30yr
- Down + closing
- —
- Monthly P&I
- —
- Monthly cashflow
- —
- DSCR
- —
- Eligible?
- —
Personal DTI + credit; lowest rate.
DSCR
20% down · 8.5% · 30yr
- Down + closing
- —
- Monthly P&I
- —
- Monthly cashflow
- —
- DSCR
- —
- Eligible?
- —
No personal income docs; deal must DSCR.
Hard money
10% down · 12.0% · 12mo
- Down + closing
- —
- Monthly P&I
- —
- Monthly cashflow
- —
- DSCR
- —
- Eligible?
- —
Short-term bridge; refi at stabilization.
Rent comps 2 comps
| Address | Beds | Baths | Sqft | Rent | $/sqft | DOM | Units | Dist |
|---|---|---|---|---|---|---|---|---|
| 129 Racer St Bennett, CO | 4.0 | 3.0 | 2536 | $3,500 | $1.38 | 25d | 1 | 0.28mi |
| 239 Adams St Bennett, CO | 3.0 | 2.5 | 1653 | $3,000 | $1.81 | 25d | 1 | 1.00mi |
HOA detail
- Monthly dues
- $100 · $1,200/yr
Listing history 10 events
-
2026-06-21days on market $467,400 Active 4 DOM
-
2026-06-17remarks 693-char remark
-
2026-06-17days on market $467,400 Active 1 DOM
-
2026-06-17days on market $467,400 Active 8 DOM
-
2026-06-16days on market $467,400 Active 7 DOM
-
2026-06-15days on market $467,400 Active 6 DOM
-
2026-06-13days on market $467,400 Active 4 DOM
-
2026-06-13days on market $467,400 Active 3 DOM
-
2026-06-10remarks 389-char remark
-
2026-06-10$467,400 Active 1 DOM
ⓘ Source: listings_history table (triggers on properties + properties_extension) + one-shot
backfill from property_details.listing_events for pre-trigger history.
Nearby sold comps map
Loading sold comps map…
Walkable amenities ~0.75 mi
Loading nearby amenities…
Taxation est. · year 1
- Rental income
- $40,442
- − Mortgage interest
- −$26,182
- − Property taxes
- −$7,011
- − Insurance
- −$2,337
- − Repairs & maintenance
- −$3,235
- − Management
- −$3,235
- − HOA
- −$1,200
- − Depreciation
- −$13,597
- Taxable loss
- −$16,356
- Est. tax savings @ 24.0%
- +$3,925
- After-tax cash flow
- $-4,087/yr
For passive investors: Depreciation is non-cash, so a rental often shows a tax loss while cash-flowing — sheltering income. Rental losses are passive: they offset passive income freely, and up to $25,000/yr can offset ordinary (W-2) income if you actively participate and your MAGI is under $100k (phasing out to $0 by $150k); unused losses carry forward. On sale, claimed depreciation is recaptured at up to 25%, and gains may owe capital-gains tax (a 1031 exchange can defer both). Figures are a year-1 estimate at your 24.0% rate — not tax advice; consult a CPA.
Schools (NCES district)
- District
- Bennett School District No. 29J
- NCES district ID
- 0802430
- Math proficiency
- 13% ▼ -10.00%
- Reading proficiency
- 31% ▼ -9.00%
- Median HH income
- $69,795
- Composite
- 21.39/100
- National rank
- #8353
- State rank
- #69 of 86 in CO
Livability — Bennett
- Score
- 59/100
- State rank
- #263
- US rank
- #19691
Category grades
Schools grade is shown separately in the Schools card above.
Census & demographics
- Census place
- Bennett, CO
- City population
- 5,994
- Population (ZIP)
- 5,994
Population outlook (Adams County) Hauer SSP2
- Today (2025)
- 598,184 people
- By 2030
- 651,880 · +9.0%
- By 2040
- 759,778 · +27.0%
- By 2050
- 862,889 · +44.3%
- By 2075
- 1,085,994 · +81.5%
- By 2100
- 1,211,318 · +102.5%
Race, ethnicity, and origin ACS 2023
- Neighborhood character
- Predominantly White (72%)
- Race & ethnicity
- White 72% Hispanic / Latino 21% Two or more races 11% Black 2%
- Hispanic origin (detail)
- Mexican 17% Puerto Rican 1%
- Common ancestry
- Serbian 4% Italian 3% Lithuanian 2%
- Foreign-born
- 6% · Canada, China
- Languages at home
- 87% English-only · Spanish 10% German/W. Germanic 1% Chinese 1%
Political lean MEDSL · Adams
- 2024 margin
- Lean D (+9.0) · D 53.2% · R 44.1% · Other 2.7%
- 2008→2024 swing
- -9.3pp toward R · 2008: 18.4pp · 2024: 9.0pp
- All cycles
- 2024: D+9.0 2020: D+16.3 2016: D+7.2 2012: D+15.1 2008: D+18.4
Not yet ingested
- Civics
- —
Market trends
- HPI YoY
- ▲ 14.94%
- Current HPI
- 494.39
- Rent YoY
- —
- Metro
- —
- State GDP YoY
- ▲ 1.95%
- F500 in state
- 14
Industry mix (Fortune 500 HQ in CO)
| Industry | F500 HQs | Revenue |
|---|---|---|
| Technology Distribution | 1 | $31B |
|
||
| Food / Agriculture | 1 | $18B |
|
||
| Packaging | 1 | $14B |
|
||
| Healthcare | 1 | $13B |
|
||
| Energy | 1 | $10B |
|
||
| Technology | 1 | $4B |
|
||
Cash-flow waterfall
monthlySold comps — $/sqft
last 12 mo · ≤1 miLoading sold comps…