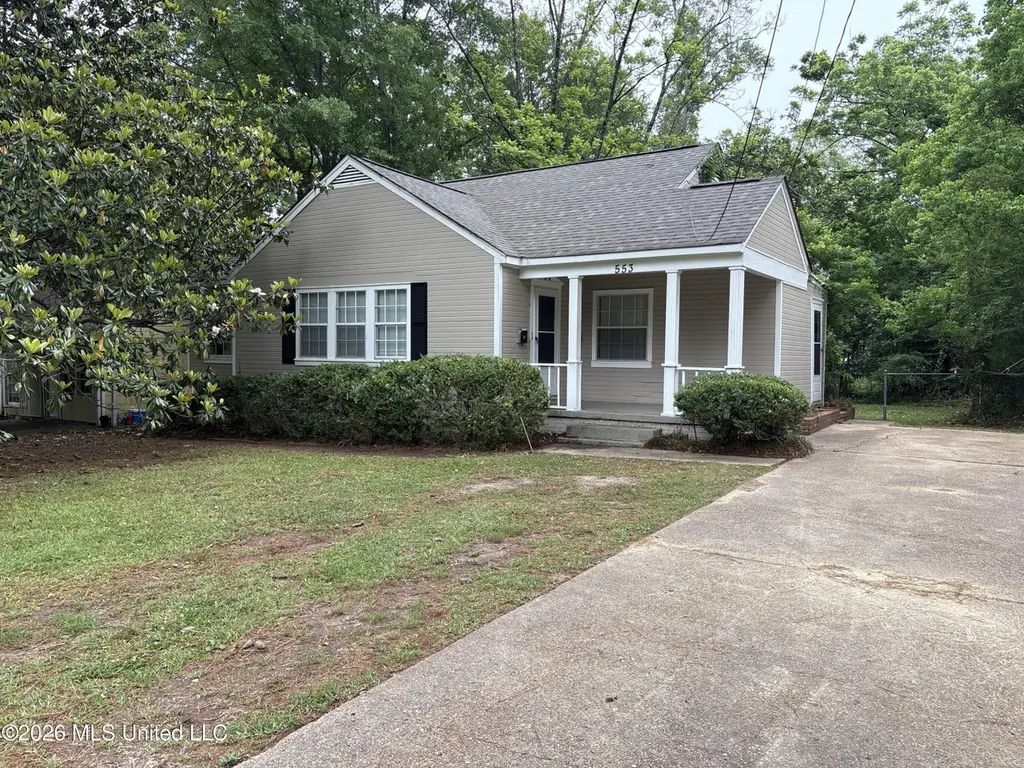
553 Belvedere Rd · Jackson, MS
Flood risk 1/10 · Minimal
- FEMA flood zone
- X (unshaded)
- Chance of flooding over 30 yrs
- 0.0%
- Est. flood insurance / yr
- $507 – $1,088
Fire risk 1/10 · Minimal
- Est. fire insurance / yr
- $1,241 – $2,305
Heat risk 7/10 · Major
- Hot days now (above 108°F)
- 7 days/yr
- Hot days in 30 yrs
- 19 days/yr
Wind risk 8/10 · Major
- Chance of severe wind over 30 yrs
- 80.0%
Air-quality risk 2/10 · Minimal
- Unhealthy air days now
- 0 days/yr
- Unhealthy air days in 30 yrs
- 1 days/yr
Risk factors via First Street. Map © Google.
Why this score? — see what drove the C+ grade
The composite is a weighted blend of 9 inputs, each scored 0–100. Each bar is that input's sub-score; the figure is the points it added to the 100-point composite (weight × sub-score).
- Cash flow +30.0/30.0
- 1% rule +10.0/10.0
- DSCR +10.0/10.0
- Livability +3.4/5.0
- Rent growth +3.2/5.0
- Condition / age +2.5/5.0
- Schools +1.1/10.0
- ARV discount +0.3/15.0
- Appreciation +0.0/10.0
$74,900
🖨 Deal sheet 📄 Offer letter ✓ Due diligence
Listing remarks MLS
"Bank Owned Property" possible Regions financing and paying closing costs with typically 10.1% down; No Warranties or Disclosures.
Key facts
- Central heating
- Air conditioning
- Spacious lot
Tags
Property features AI
Finance
- Other: Lot about 0.2 acre
Exterior
- Parking: On-site parking
- Utilities: Public water; Public sewer; Electricity available; Sewer available
- Home design: Single-family house; One story
- Construction: Masonite exterior; Asphalt shingle roof; Conventional foundation; Built (year per public records)
- Exterior features: Partial chain link fencing
Interior
- Kitchen: Dishwasher; Electric range; Oven
- Flooring: Wood flooring; Linoleum flooring
- Bathrooms: 1 full bathroom
- Heating & cooling: Central heating (electric); Central air conditioning
- Interior features: Insulated windows
- Laundry & utility: Electric water heater
Neighborhood map
What this means for you Summary
Snapshot
- This is a 3-bed/1.0-bath single-family listed at $75k.
Deal economics
- At list price, monthly cash flow is $549 ($7k/yr) — positive.
- The deal already cash-flows at list — no discount required.
- Meets the 1% rule at list price ($1k rent vs $75k).
- Recommended offer: $73k (3.0% below list) — sets the bar for market timing.
- Cap rate 15.1% vs local median 9.9% in Jackson — top-decile yield for the area; either an underpriced asset or a hidden risk that comps aren't pricing in. Stress-test before assuming the spread holds.
Location & tenants
- Location reads 68/100 on livability (#66 in MS) — a middle-class / working-renter tenant base. Strengths: commute A+, cost of living A+, housing A+; Watch: amenities F, employment F, health & safety F.
- Jackson Public School District (urban): math 9% / reading 18% proficiency, ranked #112 of 130 in MS (top 86%) — low school quality limits family demand, transient renter base, plan for 1-2y turnover; 88% free/reduced lunch — lower-income household profile, screen leases tightly.
- Zoned schools: Boyd Elementary School (math 0% / reading 9%, grade F, #368 of 375 statewide, top 98%, 405 students, 100% FRL); Callaway High School (math 3% / reading 10%, grade F, #191 of 197 statewide, top 97%, 923 students, 100% FRL).
- Market conditions: Rents rising (+2.8%/yr); 119 active listings in the ZIP; 28 comparable units currently listed for rent nearby; rentals at typical pace (median 23d on market — plan ~3-4 weeks tenant-placement turnaround); lower-income renter base — watch delinquency; 167 units permitted in Hinds County in 2024 (0 in 5+ unit buildings).
- This rent runs 39% of the median local income ($43k/yr) — at the standard rent-burdened threshold; future hikes will face affordability resistance.
Forward outlook
- Local home prices are declining (-3.0%/yr); year-one equity from $518 of loan paydown is wiped out by about $2k of value loss. Plan a longer hold.
- Hinds County population projected to shrink 6% by 2050 — rents likely to lag national; underwrite the cash flow, not the appreciation.
- At projected returns (-3.0% appreciation + 2.8% rent growth), your $21k cash investment doubles in ~4 years — after that, you're playing with house money.
Negotiation context
- It's been on market 41 days — a 3% lower offer ($73k) is reasonable based on typical stale-listing flexibility.
- 3 sale attempts since 18y ago with the ask held roughly flat each time — persistent listings suggest the price (not the market) is what's stuck; bring a comps-based counter.
Risks & watch-outs
- Watch-outs: built in 1950 — expect roof / HVAC / electrical / plumbing capex.
- Climate carrying-cost: severe wind risk, 80% chance of damaging wind over 30y; extreme-heat days projected 7→19/yr by 2055 (HVAC capex compounding) — expect insurance premiums to compound above CPI over the hold.
Questions for the listing agent
- It's been on market 41 days. Have you received any prior offers? Is the seller open to a 3% concession, seller financing, or rate buy-down credit?
- Built in 1950 — when were the roof, HVAC, electrical panel, plumbing, and water heater last replaced?
- Is there a deadline driving the sale (1031 exchange, divorce, estate, relocation)? That informs how much negotiation room exists.
- Schools are F-rated, which usually means shorter tenancies and higher turnover. Who's the typical renter profile here, and what's been the actual vacancy rate?
- What's the average days-on-market for RENTAL listings here right now (not sales)? A rising rental-DOM trend means longer vacancies and softer asking-rent achievability than the comps imply.
- What's the recent tenant-quality profile in this submarket — average credit score on applications, eviction rate, late-payment / NSF rate, and stable-employment percentage? A property-management company in the area should have these aggregated.
- How much new for-sale + rental construction is in the pipeline within 1–3 miles? Heavy new supply typically softens prices + rents 12–24 months out; constrained supply supports both.
Investment metrics
- 1% rule
- 1.83% ✓
- Cap rate
- 15.09%
- Cash-on-cash
- 31.42%
- DSCR
- 2.40
- GRM
- 4.5
CMA / ARV
- ARV (median comp)
- $64,528
- List price
- $74,900
- Delta
- 16.07%
- Verdict
- OVERPRICED
- Comps
- 20 within 1.0 mi
Show comp detail 12 sales within ~0.75 mi
| Address | Dist | Beds/Ba | Sqft | Sold | Price | $/sf | Match |
|---|---|---|---|---|---|---|---|
| 544 Wellington Rd | 0.04mi | 2/1.0 (-1) | 1,092 (+2%) | 4mo | $79,900 | $73 | 85 |
| 522 Woodbury Rd | 0.27mi | 3/1.0 | 1,012 (-5%) | 1mo | $25,000 | $25 | 78 |
| 515 Belvedere Rd | 0.08mi | 3/1.0 | 1,163 (+9%) | 9mo | $69,900 | $60 | 74 |
| 4875 Churchill Dr | 0.35mi | 3/1.0 | 1,118 (+5%) | 3mo | $69,900 | $63 | 72 |
| 506 Broadmoor Dr | 0.23mi | 3/2.0 | 1,187 (+12%) | 2mo | $79,900 | $67 | 64 |
| 535 Avalon Rd | 0.07mi | 3/2.0 | 1,199 (+13%) | 9mo | $120,000 | $100 | 64 |
| 443 Meadowbrook Rd | 0.66mi | 3/1.0 | 1,088 (+2%) | 7mo | $95,000 | $87 | 60 |
| 421 Benning Rd | 0.54mi | 3/1.0 | 1,155 (+8%) | 3mo | $74,900 | $65 | 58 |
| 4851 Maplewood Dr | 0.40mi | 3/1.0 | 1,201 (+13%) | 8mo | $74,900 | $62 | 53 |
| 746 Launcelot Rd | 0.43mi | 3/1.0 | 1,200 (+13%) | 12mo | $69,900 | $58 | 48 |
| 214 Melbourne Rd Rd | 0.58mi | 2/1.0 (-1) | 1,207 (+13%) | 6mo | $85,000 | $70 | 41 |
| 134 Wacker Dr | 0.73mi | 3/1.0 | 1,218 (+14%) | 6mo | $70,000 | $57 | 37 |
Match score weights: distance 35% · size 25% · config 20% · recency 20%. Top-matched comps best support the ARV.
Projected returns pro-forma
-3.0% appreciation · 2.83% rent growth · sell at horizon
- IRR
- 26.1%
- Equity multiple
- 2.08×
- Total profit
- $22,632
- Equity at exit
- $11,168
- IRR
- 33.7%
- Equity multiple
- 4.05×
- Total profit
- $63,911
- Equity at exit
- $6,476
Cash invested: $20,972 (down + closing). Projections, not guarantees.
Landlord ↔ Tenant lean methodology
- Overall (STATE)
- 90 Strongly Landlord-Friendly
- State Mississippi
- 90 Strongly Landlord-Friendly · R+11
- County
- — inherits STATE
- City
- — inherits STATE
ZIP-level market 39206
- Home prices YoY
- -10.3%
- Rents YoY
- 2.8%
- Active inventory
- 119
- Price-to-rent
- 4.5×
Monthly cashflow live
- Estimated rent
- $1,374 high interval (Pro) →
- Mortgage (P&I)
- −$393
- Tax from tax record
- −$112 /mo · $1,345/yr
- Insurance
- −$31
- HOA
- −$0
- Vacancy / Maint / Mgmt
- −$288
- Net cashflow
- $549
Break-even live
UW: 25.0% down · 7.5% · 30yr · 1.5% tax · 5.0% vac · 8.0% maint · 8.0% mgmt
Financing live
Cash to close
- Down payment
- $18,725
- Closing costs
- $2,247
- Reserves months
- —
- Total cash needed
- —
Loan-product check · same deal, 3 products live
Conventional
25% down · 7.5% · 30yr
- Down + closing
- —
- Monthly P&I
- —
- Monthly cashflow
- —
- DSCR
- —
- Eligible?
- —
Personal DTI + credit; lowest rate.
DSCR
20% down · 8.5% · 30yr
- Down + closing
- —
- Monthly P&I
- —
- Monthly cashflow
- —
- DSCR
- —
- Eligible?
- —
No personal income docs; deal must DSCR.
Hard money
10% down · 12.0% · 12mo
- Down + closing
- —
- Monthly P&I
- —
- Monthly cashflow
- —
- DSCR
- —
- Eligible?
- —
Short-term bridge; refi at stabilization.
Rent comps 28 comps
| Address | Beds | Baths | Sqft | Rent | $/sqft | DOM | Units | Dist |
|---|---|---|---|---|---|---|---|---|
| 4627 Estelle Dr Jackson, MS | 3.0 | 2.0 | 1489 | $1,475 | $0.99 | 23d | 1 | 0.25mi |
| 521 Launcelot Rd Jackson, MS | 3.0 | 2.0 | 1346 | $1,423 | $1.06 | 43d | 1 | 0.30mi |
| 4858 Sheridan Dr Jackson, MS | 3.0 | 2.0 | 1300 | $1,550 | $1.19 | 23d | 1 | 0.33mi |
| 701 Cedarhurst Dr Jackson, MS | 4.0 | 2.0 | 1419 | $1,250 | $0.88 | 23d | 1 | 0.42mi |
| 320 Lawrence Rd Jackson, MS | 4.0 | 2.0 | 1270 | $1,400 | $1.10 | 13d | 1 | 0.51mi |
| 320 Lawrence Rd Jackson, MS | 4.0 | 1.5 | 1270 | $1,400 | $1.10 | 23d | 1 | 0.51mi |
| 4833 N State St Jackson, MS | 3.0 | 2.0 | 994 | $1,195 | $1.20 | 43d | 1 | 0.54mi |
| 229 Lawrence Rd Jackson, MS | 2.0 | 1.0 | 840 | $900 | $1.07 | 23d | 1 | 0.54mi |
| 229 Lawrence Rd #229 Jackson, MS | 2.0 | 1.0 | 840 | $995 | $1.18 | 43d | 1 | 0.54mi |
| 227 Lawrence Rd #227 Jackson, MS | 2.0 | 1.0 | 840 | $995 | $1.18 | 43d | 1 | 0.54mi |
| 227 Lawrence Rd Jackson, MS | 2.0 | 1.0 | 840 | $900 | $1.07 | 13d | 2 | 0.54mi |
| 214 Melbourne Rd Jackson, MS | 3.0 | 2.0 | 1207 | $1,500 | $1.24 | 43d | 1 | 0.55mi |
| 508 Benning Rd Jackson, MS | 4.0 | 2.0 | 1216 | $1,400 | $1.15 | 43d | 1 | 0.57mi |
| 508 Benning Rd Jackson, MS | 4.0 | 2.0 | 1216 | $1,400 | $1.15 | 13d | 1 | 0.57mi |
| 20 N Hill Pkwy Jackson, MS | 1.0–3.0 | 1.0–2.5 | 1046 | $1,100 | $1.05 | 13d | 31 | 0.59mi |
| 4901 McWillie Cir Jackson, MS | 1.0–2.0 | 1.0–2.0 | 806 | $1,150 | $1.43 | 13d | 1 | 0.66mi |
| 5255 Manhattan Rd Jackson, MS | 1.0–2.0 | 1.0–2.0 | 813 | $1,100 | $1.35 | 13d | 1 | 0.89mi |
| 3718 Northbrook Dr Jackson, MS | 2.0 | 1.0 | 942 | $1,050 | $1.11 | 23d | 1 | 0.91mi |
| 200 Stillwood Dr Jackson, MS | 3.0 | 2.0 | 1088 | $1,300 | $1.19 | 43d | 1 | 0.91mi |
| 200 Stillwood Dr Jackson, MS | 3.0 | 2.0 | 1088 | $1,300 | $1.19 | 13d | 1 | 0.91mi |
| 4426 Desoto St Jackson, MS | 3.0 | 1.0 | 1079 | $1,250 | $1.16 | 23d | 1 | 0.98mi |
| 4426 Desoto St Jackson, MS | 3.0 | 1.0 | 1079 | $1,250 | $1.16 | 13d | 1 | 0.98mi |
| 5421 Crepe Myrtle Dr Jackson, MS | 4.0 | 1.5 | 1079 | $1,295 | $1.20 | 23d | 1 | 1.27mi |
| 533 Stillwood Dr Jackson, MS | 2.0 | 1.0 | 906 | $820 | $0.91 | 13d | 1 | 1.38mi |
| 5155 Wayneland Dr Jackson, MS | 1.0–2.0 | 1.0–2.0 | 905 | $1,500 | $1.66 | 23d | 1 | 1.39mi |
| 3811 Mosley Ave Jackson, MS | 2.0 | 1.0 | 1000 | $1,095 | $1.09 | 21d | 1 | 1.41mi |
| 815 Berwood Dr Jackson, MS | 3.0 | 2.0 | 1248 | $1,300 | $1.04 | 43d | 1 | 1.45mi |
| 3309 N State St Jackson, MS | 2.0 | 1.5 | 1300 | $1,495 | $1.15 | 13d | 1 | 1.47mi |
Listing history 26 events
-
2026-06-18days on market $74,900 Active 41 DOM
-
2026-06-17days on market $74,900 Active 40 DOM
-
2026-06-16days on market $74,900 Active 39 DOM
-
2026-06-15days on market $74,900 Active 38 DOM
-
2026-06-14days on market $74,900 Active 36 DOM
-
2026-06-13days on market $74,900 Active 35 DOM
-
2026-06-10days on market $74,900 Active 33 DOM
-
2026-06-09days on market $74,900 Active 32 DOM
-
2026-06-08days on market $74,900 Active 31 DOM
-
2026-06-07days on market $74,900 Active 30 DOM
-
2026-06-05days on market $74,900 Active 27 DOM
-
2026-06-03days on market $74,900 Active 26 DOM
-
2026-06-02days on market $74,900 Active 25 DOM
-
2026-06-01days on market $74,900 Active 24 DOM
-
2026-05-31days on market $74,900 Active 23 DOM
-
2026-05-30days on market $74,900 Active 22 DOM
-
2026-05-08$74,900 Active 595-char remark
-
2021-10-02historical
-
2019-02-22soldstatus
-
2009-04-09soldstatus
Show marketing remark (140 chars)
"Bank Owned Property" possible Regions financing and paying closing costs with typically 10.1% down; No Warranties or Disclosures.
-
2009-04-07soldstatus
-
2009-03-25$39,900
Show marketing remark (140 chars)
"Bank Owned Property" possible Regions financing and paying closing costs with typically 10.1% down; No Warranties or Disclosures.
-
2008-11-04$49,900
-
2000-08-31soldstatus
-
1987-08-12soldstatus
-
1977-08-24soldstatus
ⓘ Source: listings_history table (triggers on properties + properties_extension) + one-shot
backfill from property_details.listing_events for pre-trigger history.
Tax reassessment forecast MS · Resets to sale price
- Current annual tax
- $1,345 · $112/mo
- Projected year-2 tax
- $1,345 · $112/mo
- Expected delta
- $0/yr ($0/mo · 0.0%)
ⓘ Screening estimate from a state-policy table — verify with the county assessor before closing.
Climate risk First Street
- Flood 1/10 Low FEMA zone X (unshaded) · 0% chance over 30 yrs
- Wildfire 1/10 Low
- Heat 7/10 Severe 7 d/yr ≥108°F today · 19 d/yr by 30 yrs out
- Wind 8/10 Severe 80% chance of damaging wind over 30 yrs
- Air quality 2/10 Low 0 unhealthy d/yr today · 1 by 30 yrs out
Nearby sold comps map
Loading sold comps map…
Walkable amenities ~0.75 mi
Loading nearby amenities…
Taxation est. · year 1
- Rental income
- $16,483
- − Mortgage interest
- −$4,196
- − Property taxes
- −$1,345
- − Insurance
- −$374
- − Repairs & maintenance
- −$1,319
- − Management
- −$1,319
- − Depreciation
- −$2,179
- Taxable income
- $5,752
- Est. tax owed @ 24.0%
- −$1,381
- After-tax cash flow
- $5,209/yr
For passive investors: Depreciation is non-cash, so a rental often shows a tax loss while cash-flowing — sheltering income. Rental losses are passive: they offset passive income freely, and up to $25,000/yr can offset ordinary (W-2) income if you actively participate and your MAGI is under $100k (phasing out to $0 by $150k); unused losses carry forward. On sale, claimed depreciation is recaptured at up to 25%, and gains may owe capital-gains tax (a 1031 exchange can defer both). Figures are a year-1 estimate at your 24.0% rate — not tax advice; consult a CPA.
Schools (NCES district)
- District
- Jackson Public School District
- NCES district ID
- 2802190
- Math proficiency
- 9% ▼ -14.00%
- Reading proficiency
- 18% ▼ -7.00%
- Median HH income
- $33,234
- Composite
- 10.89/100
- National rank
- #9755
- State rank
- #112 of 130 in MS
Livability — Jackson
- Score
- 68/100
- State rank
- #66
- US rank
- #9695
Category grades
Schools grade is shown separately in the Schools card above.
Census & demographics
- Census place
- Jackson, MS
- County
- Hinds County · 167,040 people
- City population
- 140,204
- Metro
- Jackson, MS
- Population (ZIP)
- 23,257
- Household income
- $42,686
- Rent vs Own
- Severe rent burden
- 1554.0
Population outlook (Hinds County) Hauer SSP2
- Today (2025)
- 242,528 people
- By 2030
- 241,113 · -0.6%
- By 2040
- 235,557 · -2.9%
- By 2050
- 226,946 · -6.4%
- By 2075
- 199,995 · -17.5%
- By 2100
- 164,165 · -32.3%
Race, ethnicity, and origin ACS 2023
- Neighborhood character
- Predominantly Black (85%)
- Race & ethnicity
- Black 85% White 9% Hispanic / Latino 3% Two or more races 3%
- Common ancestry
- Italian 1%
- Foreign-born
- 2% · Canada
- Languages at home
- 96% English-only · Spanish 3%
Political lean MEDSL · Hinds
- 2024 margin
- Solid D (+46.1) · D 72.4% · R 26.3% · Other 1.4%
- 2008→2024 swing
- +7.1pp toward D · 2008: 39.0pp · 2024: 46.1pp
- All cycles
- 2024: D+46.1 2020: D+48.3 2016: D+43.7 2012: D+45.1 2008: D+39.0
Not yet ingested
- Civics
- —
Market trends
- HPI YoY
- ▼ -22.38%
- Current HPI
- 194.5873
- Rent YoY
- ▲ 2.83%
- Metro
- Jackson, MS
- State GDP YoY
- —
- F500 in state
- 0
Price history
+50.1% since first listed10 events — show timeline
- 2026-05-08 Listed $74,900 MLSU
- 2021-10-02 Listing Removed — MLSU
- 2019-02-22 Sold (Public Records) — Public Records
- 2009-04-09 Sold (MLS) — MLSU
- 2009-04-07 Sold (Public Records) — Public Records
- 2009-03-25 Listed $39,900 MLSU
- 2008-11-04 Listed $49,900 MLSU
- 2000-08-31 Sold (Public Records) — Public Records
- 1987-08-12 Sold (Public Records) — Public Records
- 1977-08-24 Sold (Public Records) — Public Records
Property tax history
+0.6%/yrLatest (2025): $1,345 · +0.4% YoY. Source: county tax records.
Cash-flow waterfall
monthlySold comps — $/sqft
last 12 mo · ≤1 miLoading sold comps…