 Multi-family
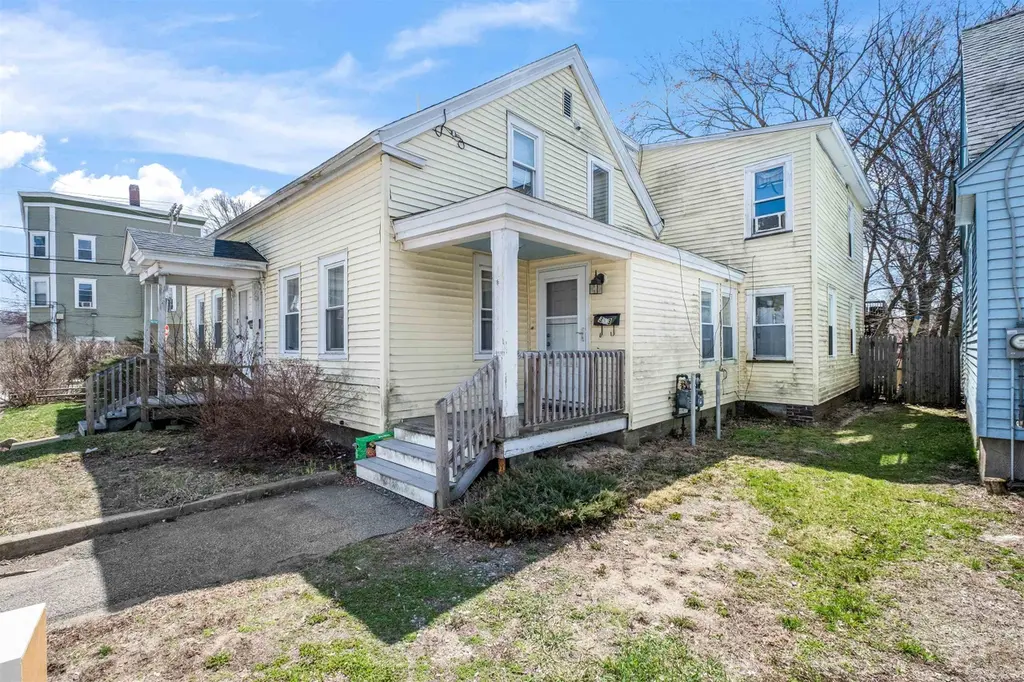
33-35 River St · Rochester, NH
Flood risk 1/10 · Minimal
- FEMA flood zone
- X (unshaded)
- Chance of flooding over 30 yrs
- 0.0%
- Est. flood insurance / yr
- $473 – $860
Fire risk 1/10 · Minimal
- Est. fire insurance / yr
- $507 – $941
Heat risk 4/10 · Minor
- Hot days now (above 97°F)
- 7 days/yr
- Hot days in 30 yrs
- 16 days/yr
Wind risk 4/10 · Minor
- Chance of severe wind over 30 yrs
- 18.0%
Air-quality risk 2/10 · Minimal
- Unhealthy air days now
- 1 days/yr
- Unhealthy air days in 30 yrs
- 1 days/yr
Risk factors via First Street. Map © Google.
Why this score? — see what drove the B grade
The composite is a weighted blend of 9 inputs, each scored 0–100. Each bar is that input's sub-score; the figure is the points it added to the 100-point composite (weight × sub-score).
- Cash flow +26.8/30.0
- ARV discount +15.0/15.0
- DSCR +9.2/10.0
- 1% rule +7.4/10.0
- Livability +4.2/5.0
- Rent growth +3.6/5.0
- Schools +2.7/10.0
- Condition / age +2.5/5.0
- Appreciation +0.0/10.0
$375,000
🖨 Deal sheet (PDF) 📄 Offer letter ✓ Due diligence
Multi-family units
County records classify this as Multi-Family (2-4 Unit). Listing-text estimate: 1 unit. estimate disagrees with records
Listing remarks MLS
LARGE DUPLEX WITH MANY UPDATES. CORNER LOT. THE PROPERTY WOULD MAKE A GREAT OWNER OCCUPIED SITUATION. CALL FOR EXPENSES. 24 HOUR NOTICE TO SHOW. LAUNDRY HOOKUPS
Key facts
- Paved driveway
- Key updates
- Private entrance
Tags
Neighborhood map
What this means for you Summary
Snapshot
- This is a 7-bed/2.5-bath multifamily listed at $375k.
Deal economics
- At list price, monthly cash flow is $1k ($12k/yr) — positive.
- The deal already cash-flows at list — no discount required.
- Meets the 1% rule at list price ($5k rent vs $375k).
- Cap rate 9.6% vs local median 3.6% in Rochester — top-decile yield for the area; either an underpriced asset or a hidden risk that comps aren't pricing in. Stress-test before assuming the spread holds.
Location & tenants
- Location reads 84/100 on livability (#8 in NH, #698 nationally) — a professional / high-income tenant draw. Strengths: crime A+, commute A+, cost of living A+; Watch: amenities C-.
- Rochester School District (suburban): math 27% / reading 35% proficiency, ranked #83 of 98 in NH (top 85%) — families likely to look elsewhere, expect single-tenant / working-renter base with shorter leases.
- Market conditions: Rents rising fast (+4.2%/yr); 108 active listings in the ZIP; solid renter incomes; 951 units permitted in Strafford County in 2024 (551 in 5+ unit buildings).
- At $4,640/mo this rent would consume 71% of the median local household income ($79k/yr) (locally 663% of renters already pay >50% of income on rent) — very limited rent-growth headroom before tenants either downsize or default.
Forward outlook
- Local home prices are declining (-3.0%/yr); year-one equity from $3k of loan paydown is wiped out by about $11k of value loss. Plan a longer hold.
- Strafford County population projected at +7% by 2050 — modest demand growth; plan on rents tracking national, not racing it.
- At projected returns (-3.0% appreciation + 4.2% rent growth), your $105k cash investment doubles in ~9 years — after that, you're playing with house money.
Negotiation context
- Only 6 days on market — expect competitive offers; lowballing is unlikely to land.
- 2 sale attempts since 22y ago with the ask held roughly flat each time — persistent listings suggest the price (not the market) is what's stuck; bring a comps-based counter.
- Current owner paid $225k; list at $375k implies a 67% gain — meaningful room to come down on a strong offer.
Risks & watch-outs
- Watch-outs: built in 1881 — expect roof / HVAC / electrical / plumbing capex.
Questions for the listing agent
- Built in 1881 — when were the roof, HVAC, electrical panel, plumbing, and water heater last replaced?
- Is there a deadline driving the sale (1031 exchange, divorce, estate, relocation)? That informs how much negotiation room exists.
- What's the average days-on-market for RENTAL listings here right now (not sales)? A rising rental-DOM trend means longer vacancies and softer asking-rent achievability than the comps imply.
- What's the recent tenant-quality profile in this submarket — average credit score on applications, eviction rate, late-payment / NSF rate, and stable-employment percentage? A property-management company in the area should have these aggregated.
- How much new apartment / multifamily construction is in the pipeline within 1–3 miles? Heavy new supply (>2% of stock underway) typically softens rents 12–24 months out; light construction supports rent growth.
Investment metrics
- 1% rule
- 1.24% ✓
- Cap rate
- 9.57%
- Cash-on-cash
- 11.70%
- DSCR
- 1.52
- GRM
- 6.7
CMA / ARV
- ARV (on-the-fly)
- $453,024
- Comps found
- 5
Show comp detail 5 sales within ~0.75 mi
| Address | Dist | Beds/Ba | Sqft | Sold | Price | $/sf | Match |
|---|---|---|---|---|---|---|---|
| 33-35 River St | 0.00mi | 7/2.0 | 2,574 (0%) | 0mo | $312,500 | $121 | 98 |
| 43-45 Charles St | 0.34mi | 7/3.0 | 2,875 (+12%) | 2mo | $595,500 | $207 | 61 |
| 63 Lafayette St | 0.22mi | 8/2.0 (+1) | 2,374 (-8%) | 17mo | $418,000 | $176 | 56 |
| 11 Leonard St | 0.46mi | 6/2.0 (-1) | 2,796 (+9%) | 20mo | $356,000 | $127 | 40 |
| 88 Charles St | 0.56mi | 6/2.0 (-1) | 2,368 (-8%) | 18mo | $430,000 | $182 | 38 |
Match score weights: distance 35% · size 25% · config 20% · recency 20%. Top-matched comps best support the ARV.
Projected returns pro-forma
-3.0% appreciation · 4.22% rent growth · sell at horizon
- IRR
- 2.5%
- Equity multiple
- 1.10×
- Total profit
- $10,285
- Equity at exit
- $55,914
- IRR
- 13.3%
- Equity multiple
- 2.12×
- Total profit
- $117,555
- Equity at exit
- $32,423
Cash invested: $105,000 (down + closing). Projections, not guarantees.
Landlord ↔ Tenant lean methodology
- Overall (STATE)
- 56 Moderately Landlord-Leaning
- State New Hampshire
- 56 Moderately Landlord-Leaning · D+1
- County
- — inherits STATE
- City
- — inherits STATE
ZIP-level market 03867
- Home prices YoY
- -22.0%
- Rents YoY
- 4.2%
- Active inventory
- 108
- Price-to-rent
- 13.5×
Monthly cashflow live
- Estimated rent
- $4,640 high interval (Pro) →
- Mortgage (P&I)
- −$1,967
- Tax from tax record
- −$519 /mo · $6,232/yr
- Insurance
- −$156
- HOA
- −$0
- Vacancy / Maint / Mgmt
- −$974
- Net cashflow
- $1,023
Break-even live
Sensitivity live
| Price | -10% $1,236 | -5% $1,130 | +0% $1,023 | +5% $917 | +10% $811 |
|---|---|---|---|---|---|
| Rent | -10% $657 | -5% $840 | +0% $1,023 | +5% $1,207 | +10% $1,390 |
| Rate | -1.0pp $1,212 | -0.5pp $1,119 | base $1,023 | +0.5pp $926 | +1.0pp $827 |
2-unit breakdown (identical units grouped — click to expand)
| Units | Beds | Baths | Est. rent |
|---|---|---|---|
| 2× units | 3 | 1 | $4,640 |
| #1 | 3 | 1 | $2,320 |
| #2 | 3 | 1 | $2,320 |
| Total (2 units) | $4,640 | ||
UW: 25.0% down · 7.5% · 30yr · 1.5% tax · 5.0% vac · 8.0% maint · 8.0% mgmt
Financing live
Cash to close
- Down payment
- $93,750
- Closing costs
- $11,250
- Reserves months
- —
- Total cash needed
- —
Loan-product check · same deal, 3 products live
Conventional
25% down · 7.5% · 30yr
- Down + closing
- —
- Monthly P&I
- —
- Monthly cashflow
- —
- DSCR
- —
- Eligible?
- —
Personal DTI + credit; lowest rate.
DSCR
20% down · 8.5% · 30yr
- Down + closing
- —
- Monthly P&I
- —
- Monthly cashflow
- —
- DSCR
- —
- Eligible?
- —
No personal income docs; deal must DSCR.
Hard money
10% down · 12.0% · 12mo
- Down + closing
- —
- Monthly P&I
- —
- Monthly cashflow
- —
- DSCR
- —
- Eligible?
- —
Short-term bridge; refi at stabilization.
Listing history 5 events
-
2026-04-28status Pending
-
2026-04-22$375,000 Active
-
2005-09-13soldstatus $225,000
-
2004-09-30soldstatus $204,000 160-char remark
Show marketing remark (160 chars)
LARGE DUPLEX WITH MANY UPDATES. CORNER LOT. THE PROPERTY WOULD MAKE A GREAT OWNER OCCUPIED SITUATION. CALL FOR EXPENSES. 24 HOUR NOTICE TO SHOW. LAUNDRY HOOKUPS
-
2004-08-16$199,900 160-char remark
Show marketing remark (160 chars)
LARGE DUPLEX WITH MANY UPDATES. CORNER LOT. THE PROPERTY WOULD MAKE A GREAT OWNER OCCUPIED SITUATION. CALL FOR EXPENSES. 24 HOUR NOTICE TO SHOW. LAUNDRY HOOKUPS
ⓘ Source: listings_history table (triggers on properties + properties_extension) + one-shot
backfill from property_details.listing_events for pre-trigger history.
Tax reassessment forecast NH · Partial reset (capped growth)
- Current annual tax
- $6,232 · $519/mo
- Projected year-2 tax
- $7,204 · $600/mo
- Expected delta
- +$972/yr (+$81/mo · 15.6%)
ⓘ Screening estimate from a state-policy table — verify with the county assessor before closing.
Climate risk First Street
- Flood 1/10 Low FEMA zone X (unshaded) · 0% chance over 30 yrs
- Wildfire 1/10 Low
- Heat 4/10 Moderate 7 d/yr ≥97°F today · 16 d/yr by 30 yrs out
- Wind 4/10 Moderate 18% chance of damaging wind over 30 yrs
- Air quality 2/10 Low 1 unhealthy d/yr today · 1 by 30 yrs out
Nearby sold comps map
Loading sold comps map…
Walkable amenities ~0.75 mi
Loading nearby amenities…
Taxation est. · year 1
- Rental income
- $55,680
- − Mortgage interest
- −$21,006
- − Property taxes
- −$6,232
- − Insurance
- −$1,875
- − Repairs & maintenance
- −$4,454
- − Management
- −$4,454
- − Depreciation
- −$10,909
- Taxable income
- $6,749
- Est. tax owed @ 24.0%
- −$1,620
- After-tax cash flow
- $10,662/yr
For passive investors: Depreciation is non-cash, so a rental often shows a tax loss while cash-flowing — sheltering income. Rental losses are passive: they offset passive income freely, and up to $25,000/yr can offset ordinary (W-2) income if you actively participate and your MAGI is under $100k (phasing out to $0 by $150k); unused losses carry forward. On sale, claimed depreciation is recaptured at up to 25%, and gains may owe capital-gains tax (a 1031 exchange can defer both). Figures are a year-1 estimate at your 24.0% rate — not tax advice; consult a CPA.
Schools (NCES district)
- District
- Rochester School District
- NCES district ID
- 3305940
- Math proficiency
- 27% ▼ -15.00%
- Reading proficiency
- 35% ▼ -14.00%
- Median HH income
- $51,080
- Composite
- 27.11/100
- National rank
- #7039
- State rank
- #83 of 98 in NH
Livability — Rochester
- Score
- 84/100
- State rank
- #8
- US rank
- #698
Category grades
Schools grade is shown separately in the Schools card above.
Census & demographics
- Census place
- Rochester, NH
- County
- Strafford County · 75,181 people
- City population
- 22,732
- Metro
- Boston-Cambridge-Newton, MA-NH
- Population (ZIP)
- 22,732
- Household income
- $78,674
- Rent vs Own
- Severe rent burden
- 663.0
Population outlook (Strafford County) Hauer SSP2
- Today (2025)
- 132,503 people
- By 2030
- 135,377 · +2.2%
- By 2040
- 139,609 · +5.4%
- By 2050
- 141,803 · +7.0%
- By 2075
- 149,280 · +12.7%
- By 2100
- 148,667 · +12.2%
Race, ethnicity, and origin ACS 2023
- Neighborhood character
- Predominantly White (93%)
- Race & ethnicity
- White 93% Two or more races 4% Hispanic / Latino 2% Asian 1%
- Common ancestry
- Lithuanian 12% Romanian 2% Serbian 2%
- Foreign-born
- 3% · Canada
- Languages at home
- 96% English-only · Spanish 1% French/Haitian/Cajun 1%
Political lean MEDSL · Strafford
- 2024 margin
- D (+12.1) · D 55.5% · R 43.5% · Other 1.0%
- 2008→2024 swing
- -8.3pp toward R · 2008: 20.4pp · 2024: 12.1pp
- All cycles
- 2024: D+12.1 2020: D+15.2 2016: D+8.6 2012: D+14.5 2008: D+20.4
Not yet ingested
- Civics
- —
Market trends
- HPI YoY
- ▼ -107.34%
- Current HPI
- 379.5755
- Rent YoY
- ▲ 4.22%
- Metro
- Boston-Cambridge-Newton, MA-NH
- State GDP YoY
- —
- F500 in state
- 0
Price history
+87.6% since first listed5 events — show timeline
- 2026-04-28 Pending — PrimeMLS
- 2026-04-22 Listed $375,000 PrimeMLS
- 2005-09-13 Sold (Public Records) $225,000 Public Records
- 2004-09-30 Sold (MLS) $204,000 PrimeMLS
- 2004-08-16 Listed $199,900 PrimeMLS
Property tax history
+3.9%/yrLatest (2025): $6,232 · +3.0% YoY. Source: county tax records.
Cash-flow waterfall
monthlySold comps — $/sqft
last 12 mo · ≤1 miLoading sold comps…