 10-Plex
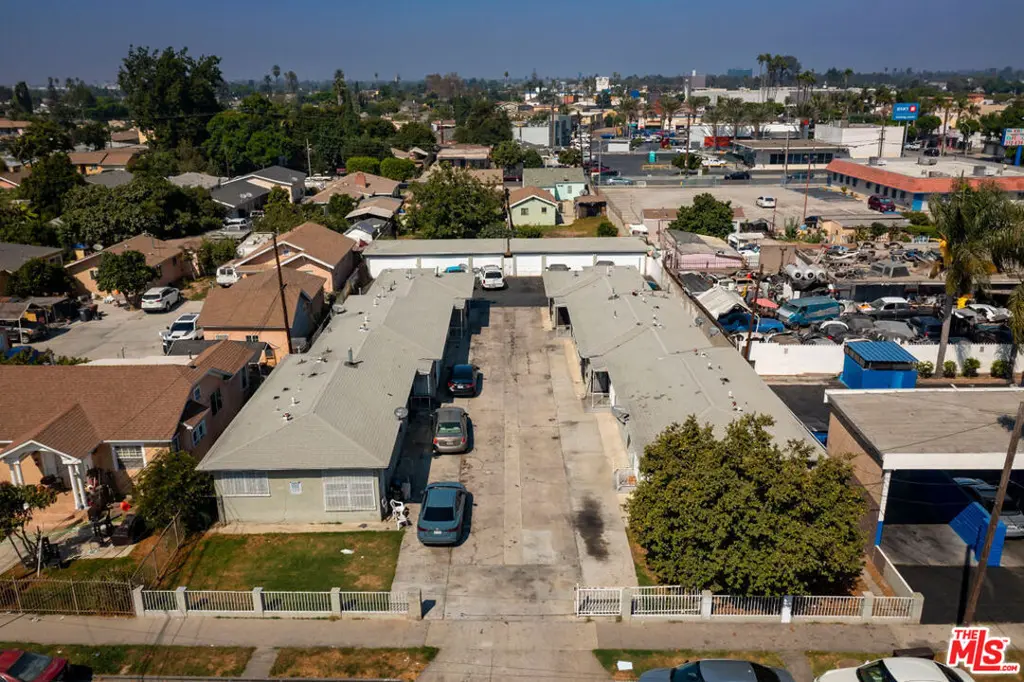
1307 E Peck St · Compton, CA
Flood risk 1/10 · Minimal
- FEMA flood zone
- X (shaded)
- Chance of flooding over 30 yrs
- 0.0%
- Est. flood insurance / yr
- $507 – $1,088
Fire risk 1/10 · Minimal
- Est. fire insurance / yr
- $659 – $1,223
Heat risk 5/10 · Moderate
- Hot days now (above 91°F)
- 7 days/yr
- Hot days in 30 yrs
- 22 days/yr
Wind risk 1/10 · Minimal
- Chance of severe wind over 30 yrs
- —
Air-quality risk 6/10 · Moderate
- Unhealthy air days now
- 10 days/yr
- Unhealthy air days in 30 yrs
- 10 days/yr
Risk factors via First Street. Map © Google.
Why this score? — see what drove the C+ grade
The composite is a weighted blend of 9 inputs, each scored 0–100. Each bar is that input's sub-score; the figure is the points it added to the 100-point composite (weight × sub-score).
- Cash flow +27.6/30.0
- DSCR +9.7/10.0
- ARV discount +7.5/15.0
- 1% rule +6.8/10.0
- Schools +3.2/10.0
- Livability +2.8/5.0
- Rent growth +2.5/5.0
- Condition / age +2.5/5.0
- Appreciation +0.0/10.0
$1,850,000
🖨 Deal sheet 📄 Offer letter ✓ Due diligence
Multi-family units
County records classify this as Multi-Family (5+ Unit). Listing-text estimate: 10 units. confirmed
5+ unit building — per-unit beds/baths from public records are typically unavailable; the breakdown below (if shown) is an estimate from the listing text.
Listing remarks MLS
We are pleased to present 1307-1311 E Peck, a 10-unit multifamily community located in Compton, that is priced at a 7.48% CAP and an 8.42 GRM on current rents with 3 units delivered vacant and upside to operate at an 8.36% CAP and a 7.80 GRM. 1307-1311 E Peck St is situated in close proximity to the 105 and 710 freeways offering convenient access to neighboring cities such as Los Angeles, Lynwood, South Gate, Gardena and Long Beach. Nearby tenant amenities include the Compton Town Center, Plaza Mexico, Compton Art & History Museum, and the Dominguez Rancho Adobe Museum. The property is comprised of two, single-story side-by-side five-unit buildings, totaling 5,016 rentable square feet, constructed in 1950 with a strong unit mix of four (4) two-bedroom units and six (6) one-bedroom units located on 17,323 square feet of land. Half of the units have been renovated, and three units will be delivered VACANT and renovated at closing: two 2BDs and one 1BD. There is also ample on-site uncovered parking along with ten (10) one-car garages providing potential for ADU conversions. Contact the listing broker for additional information.
Key facts
- Renovated units
- Convenient access
- On-site parking
Tags
Neighborhood map
What this means for you Summary
Snapshot
- This is a 10 × 14-bed/10.0-bath units multifamily listed at $1.85M.
Deal economics
- At list price, monthly cash flow is $6k ($66k/yr) — positive. Per door: $552/mo.
- The deal already cash-flows at list — no discount required.
- Meets the 1% rule at list price ($22k rent vs $1.85M).
- Recommended offer: $1.74M (6.0% below list) — sets the bar for market timing.
- Cap rate 9.9% vs local median 3.0% in Compton — top-decile yield for the area; either an underpriced asset or a hidden risk that comps aren't pricing in. Stress-test before assuming the spread holds.
Location & tenants
- Location reads 56/100 on livability (#803 in CA) — a working-class tenant base; expect higher turnover. Strengths: commute A+, housing B; Watch: schools D, crime F, amenities D-.
- Compton Unified (suburban): math 31% / reading 38% proficiency, ranked #910 of 1,400 in CA (top 65%) — families likely to look elsewhere, expect single-tenant / working-renter base with shorter leases; 78% free/reduced lunch — lower-income household profile, screen leases tightly.
- Market conditions: 40 active listings in the ZIP; 1 comparable units currently listed for rent nearby; 19,697 units permitted in Los Angeles County in 2024 (9,426 in 5+ unit buildings).
Forward outlook
- Local home prices are declining (-3.0%/yr); year-one equity from $13k of loan paydown is wiped out by about $56k of value loss. Plan a longer hold.
- Los Angeles County population projected at +9% by 2050 — modest demand growth; plan on rents tracking national, not racing it.
- At projected returns (-3.0% appreciation + 3.0% rent growth), your $518k cash investment doubles in ~9 years — after that, you're playing with house money.
Negotiation context
- It's been on market 73 days — a 6% lower offer ($1.74M) is reasonable based on typical stale-listing flexibility.
- 11 sale attempts since 26y ago with the ask held roughly flat each time — persistent listings suggest the price (not the market) is what's stuck; bring a comps-based counter.
- Current owner paid $1.50M; 23% above their basis — modest negotiation headroom, anchor on the comps not their cost.
Risks & watch-outs
- Watch-outs: built in 1950 — expect roof / HVAC / electrical / plumbing capex.
- Climate carrying-cost: extreme-heat days projected 7→22/yr by 2055 (HVAC capex compounding) — expect insurance premiums to compound above CPI over the hold.
Questions for the listing agent
- It's been on market 73 days. Have you received any prior offers? Is the seller open to a 6% concession, seller financing, or rate buy-down credit?
- Can we see the unit-by-unit rent roll, current vacancy, and any below-market leases? What's the average tenancy length?
- What capital expenditures (roof, boiler, parking lot, exteriors) have been made in the last 5 years, and what's planned in the next 2?
- Built in 1950 — when were the roof, HVAC, electrical panel, plumbing, and water heater last replaced?
- Why hasn't it sold? Are there any deal-killer items the seller is aware of (foundation, flood, title, zoning, code violations)?
- Is there a deadline driving the sale (1031 exchange, divorce, estate, relocation)? That informs how much negotiation room exists.
- Schools are D-rated, which usually means shorter tenancies and higher turnover. Who's the typical renter profile here, and what's been the actual vacancy rate?
- Crime grade is F in this area — have there been break-ins, vandalism, or insurance claims at this property in the last 3 years? What carrier currently insures it and at what premium?
- What's the average days-on-market for RENTAL listings here right now (not sales)? A rising rental-DOM trend means longer vacancies and softer asking-rent achievability than the comps imply.
- What's the recent tenant-quality profile in this submarket — average credit score on applications, eviction rate, late-payment / NSF rate, and stable-employment percentage? A property-management company in the area should have these aggregated.
- How much new apartment / multifamily construction is in the pipeline within 1–3 miles? Heavy new supply (>2% of stock underway) typically softens rents 12–24 months out; light construction supports rent growth.
Investment metrics
- 1% rule
- 1.18% ✓
- Cap rate
- 9.88%
- Cash-on-cash
- 12.79%
- DSCR
- 1.57
- GRM
- 7.1
CMA / ARV
- ARV (median comp)
- $968,902
- List price
- $1,850,000
- Delta
- 90.94%
- Verdict
- OVERPRICED
- Comps
- 9 within 1.0 mi
Show comp detail 1 sale within ~0.75 mi
| Address | Dist | Beds/Ba | Sqft | Sold | Price | $/sf | Match |
|---|---|---|---|---|---|---|---|
| 1108 E Tucker St | 0.13mi | 5/3.0 | 2,405 (-4%) | 9mo | $1,050,000 | $437 | 72 |
Match score weights: distance 35% · size 25% · config 20% · recency 20%. Top-matched comps best support the ARV.
Projected returns pro-forma
-3.0% appreciation · 3.0% rent growth · sell at horizon
- IRR
- 2.6%
- Equity multiple
- 1.10×
- Total profit
- $51,632
- Equity at exit
- $275,841
- IRR
- 12.1%
- Equity multiple
- 1.96×
- Total profit
- $496,552
- Equity at exit
- $159,954
Cash invested: $518,000 (down + closing). Projections, not guarantees.
Landlord ↔ Tenant lean methodology
- Overall (STATE)
- 18 Strongly Tenant-Friendly
- State California
- 18 Strongly Tenant-Friendly · D+13
- County
- — inherits STATE
- City
- — inherits STATE
ZIP-level market 90221
- Active inventory
- 40
- Price-to-rent
- 70.6×
Monthly cashflow live
- Estimated rent
- $21,823 medium interval (Pro) →
- Mortgage (P&I)
- −$9,702
- Tax from tax record
- −$1,245 /mo · $14,942/yr
- Insurance
- −$771
- HOA
- −$0
- Vacancy / Maint / Mgmt
- −$4,583
- Net cashflow
- $5,523
Break-even live
10-unit breakdown (identical units grouped — click to expand)
| Units | Beds | Baths | Est. rent |
|---|---|---|---|
| 10× units | 14 | 10 | $21,820 |
| #1 | 14 | 10 | $2,182 |
| #2 | 14 | 10 | $2,182 |
| #3 | 14 | 10 | $2,182 |
| #4 | 14 | 10 | $2,182 |
| #5 | 14 | 10 | $2,182 |
| #6 | 14 | 10 | $2,182 |
| #7 | 14 | 10 | $2,182 |
| #8 | 14 | 10 | $2,182 |
| #9 | 14 | 10 | $2,182 |
| #10 | 14 | 10 | $2,182 |
| Total (10 units) | $21,823 | ||
UW: 25.0% down · 7.5% · 30yr · 1.5% tax · 5.0% vac · 8.0% maint · 8.0% mgmt
Financing live
Cash to close
- Down payment
- $462,500
- Closing costs
- $55,500
- Reserves months
- —
- Total cash needed
- —
Loan-product check · same deal, 3 products live
Conventional
25% down · 7.5% · 30yr
- Down + closing
- —
- Monthly P&I
- —
- Monthly cashflow
- —
- DSCR
- —
- Eligible?
- —
Personal DTI + credit; lowest rate.
DSCR
20% down · 8.5% · 30yr
- Down + closing
- —
- Monthly P&I
- —
- Monthly cashflow
- —
- DSCR
- —
- Eligible?
- —
No personal income docs; deal must DSCR.
Hard money
10% down · 12.0% · 12mo
- Down + closing
- —
- Monthly P&I
- —
- Monthly cashflow
- —
- DSCR
- —
- Eligible?
- —
Short-term bridge; refi at stabilization.
Rent comps 1 comps
| Address | Beds | Baths | Sqft | Rent | $/sqft | DOM | Units | Dist |
|---|---|---|---|---|---|---|---|---|
| 1937 E Canova Ln Compton, CA | 4.0 | 3.0 | 2060 | $4,650 | $2.26 | 1d | 1 | 0.46mi |
Listing history 39 events
-
2026-06-18days on market $1,850,000 Active 73 DOM
-
2026-06-17days on market $1,850,000 Active 72 DOM
-
2026-06-16days on market $1,850,000 Active 71 DOM
-
2026-06-15days on market $1,850,000 Active 70 DOM
-
2026-06-13days on market $1,850,000 Active 67 DOM
-
2026-06-09days on market $1,850,000 Active 64 DOM
-
2026-06-08days on market $1,850,000 Active 63 DOM
-
2026-06-07days on market $1,850,000 Active 62 DOM
-
2026-06-04days on market $1,850,000 Active 59 DOM
-
2026-06-03days on market $1,850,000 Active 58 DOM
-
2026-06-02days on market $1,850,000 Active 57 DOM
-
2026-06-01days on market $1,850,000 Active 56 DOM
-
2026-05-31days on market $1,850,000 Active 55 DOM
-
2026-05-04status Active 1148-char remark
Show marketing remark (1148 chars)
We are pleased to present 1307-1311 E Peck, a 10-unit multifamily community located in Compton, that is priced at a 7.48% CAP and an 8.42 GRM on current rents with 3 units delivered vacant and upside to operate at an 8.36% CAP and a 7.80 GRM. 1307-1311 E Peck St is situated in close proximity to the 105 and 710 freeways offering convenient access to neighboring cities such as Los Angeles, Lynwood, South Gate, Gardena and Long Beach. Nearby tenant amenities include the Compton Town Center, Plaza Mexico, Compton Art & History Museum, and the Dominguez Rancho Adobe Museum. The property is comprised of two, single-story side-by-side five-unit buildings, totaling 5,016 rentable square feet, constructed in 1950 with a strong unit mix of four (4) two-bedroom units and six (6) one-bedroom units located on 17,323 square feet of land. Half of the units have been renovated, and three units will be delivered VACANT and renovated at closing: two 2BDs and one 1BD. There is also ample on-site uncovered parking along with ten (10) one-car garages providing potential for ADU conversions. Contact the listing broker for additional information.
-
2026-04-17historical Backup Offers Accepted 1148-char remark
Show marketing remark (1148 chars)
We are pleased to present 1307-1311 E Peck, a 10-unit multifamily community located in Compton, that is priced at a 7.48% CAP and an 8.42 GRM on current rents with 3 units delivered vacant and upside to operate at an 8.36% CAP and a 7.80 GRM. 1307-1311 E Peck St is situated in close proximity to the 105 and 710 freeways offering convenient access to neighboring cities such as Los Angeles, Lynwood, South Gate, Gardena and Long Beach. Nearby tenant amenities include the Compton Town Center, Plaza Mexico, Compton Art & History Museum, and the Dominguez Rancho Adobe Museum. The property is comprised of two, single-story side-by-side five-unit buildings, totaling 5,016 rentable square feet, constructed in 1950 with a strong unit mix of four (4) two-bedroom units and six (6) one-bedroom units located on 17,323 square feet of land. Half of the units have been renovated, and three units will be delivered VACANT and renovated at closing: two 2BDs and one 1BD. There is also ample on-site uncovered parking along with ten (10) one-car garages providing potential for ADU conversions. Contact the listing broker for additional information.
-
2026-04-06$1,900,000 Active 1148-char remark
Show marketing remark (1148 chars)
We are pleased to present 1307-1311 E Peck, a 10-unit multifamily community located in Compton, that is priced at a 7.48% CAP and an 8.42 GRM on current rents with 3 units delivered vacant and upside to operate at an 8.36% CAP and a 7.80 GRM. 1307-1311 E Peck St is situated in close proximity to the 105 and 710 freeways offering convenient access to neighboring cities such as Los Angeles, Lynwood, South Gate, Gardena and Long Beach. Nearby tenant amenities include the Compton Town Center, Plaza Mexico, Compton Art & History Museum, and the Dominguez Rancho Adobe Museum. The property is comprised of two, single-story side-by-side five-unit buildings, totaling 5,016 rentable square feet, constructed in 1950 with a strong unit mix of four (4) two-bedroom units and six (6) one-bedroom units located on 17,323 square feet of land. Half of the units have been renovated, and three units will be delivered VACANT and renovated at closing: two 2BDs and one 1BD. There is also ample on-site uncovered parking along with ten (10) one-car garages providing potential for ADU conversions. Contact the listing broker for additional information.
-
2025-09-18price
-
2025-08-18price
-
2025-06-02status Active
-
2025-05-22historical Backup Offers Accepted
-
2025-04-23Active
-
2024-10-08Active
-
2018-07-13soldstatus $1,500,000
-
2007-03-02historical
-
2006-09-02$1,299,000
-
2005-05-24soldstatus $915,000
-
2005-05-20soldstatus $915,000
-
2005-01-27$930,000
-
2004-11-18historical
-
2004-10-24$475,000
-
2004-10-16historical
-
2004-09-15$474,990
-
2004-07-26soldstatus $725,000
-
2003-11-24soldstatus $460,000
-
2002-02-20historical
-
2001-09-10$425,000
-
2000-08-15historical
-
2000-02-15$385,000
-
1994-06-22soldstatus $294,077
ⓘ Source: listings_history table (triggers on properties + properties_extension) + one-shot
backfill from property_details.listing_events for pre-trigger history.
Tax reassessment forecast CA · Resets to sale price
- Current annual tax
- $14,942 · $1,245/mo
- Projected year-2 tax
- $14,942 · $1,245/mo
- Expected delta
- $0/yr ($0/mo · 0.0%)
ⓘ Screening estimate from a state-policy table — verify with the county assessor before closing.
Climate risk First Street
- Flood 1/10 Low FEMA zone X (shaded) · 0% chance over 30 yrs
- Wildfire 1/10 Low
- Heat 5/10 Major 7 d/yr ≥91°F today · 22 d/yr by 30 yrs out
- Wind 1/10 Low
- Air quality 6/10 Major 10 unhealthy d/yr today · 10 by 30 yrs out
Nearby sold comps map
Loading sold comps map…
Walkable amenities ~0.75 mi
Loading nearby amenities…
Taxation est. · year 1
- Rental income
- $261,876
- − Mortgage interest
- −$103,629
- − Property taxes
- −$14,942
- − Insurance
- −$9,250
- − Repairs & maintenance
- −$20,950
- − Management
- −$20,950
- − Depreciation
- −$53,818
- Taxable income
- $38,337
- Est. tax owed @ 24.0%
- −$9,201
- After-tax cash flow
- $57,070/yr
For passive investors: Depreciation is non-cash, so a rental often shows a tax loss while cash-flowing — sheltering income. Rental losses are passive: they offset passive income freely, and up to $25,000/yr can offset ordinary (W-2) income if you actively participate and your MAGI is under $100k (phasing out to $0 by $150k); unused losses carry forward. On sale, claimed depreciation is recaptured at up to 25%, and gains may owe capital-gains tax (a 1031 exchange can defer both). Figures are a year-1 estimate at your 24.0% rate — not tax advice; consult a CPA.
Schools (NCES district)
- District
- Compton Unified
- NCES district ID
- 0609620
- Math proficiency
- 31% ▲ 5.00%
- Reading proficiency
- 38% ▲ 3.00%
- Median HH income
- $45,045
- Composite
- 32.1/100
- National rank
- #10985
- State rank
- #910 of 1400 in CA
Livability — Compton
- Score
- 56/100
- State rank
- #803
- US rank
- #22778
Category grades
Schools grade is shown separately in the Schools card above.
Census & demographics
- Census place
- Compton, CA
- City population
- 48,354
- Population (ZIP)
- 50,782
Population outlook (Los Angeles County) Hauer SSP2
- Today (2025)
- 10,940,515 people
- By 2030
- 11,256,481 · +2.9%
- By 2040
- 11,729,929 · +7.2%
- By 2050
- 11,948,407 · +9.2%
- By 2075
- 11,818,114 · +8.0%
- By 2100
- 10,842,928 · -0.9%
Race, ethnicity, and origin ACS 2023
- Neighborhood character
- Predominantly Hispanic (79%)
- Race & ethnicity
- Hispanic / Latino 79% Two or more races 33% Black 18% Native American 2% Asian 1%
- Hispanic origin (detail)
- Mexican 70%
- Foreign-born
- 37% · Canada
- Languages at home
- 30% English-only · Spanish 68% Tagalog/Filipino 1%
Political lean MEDSL · Los Angeles
- 2024 margin
- Solid D (+32.9) · D 64.8% · R 31.9% · Other 3.3%
- 2008→2024 swing
- -7.4pp toward R · 2008: 40.4pp · 2024: 32.9pp
- All cycles
- 2024: D+32.9 2020: D+44.2 2016: D+48.0 2012: D+40.0 2008: D+40.4
Not yet ingested
- Civics
- —
Market trends
- HPI YoY
- ▼ -482.21%
- Current HPI
- 490.5921
- Rent YoY
- —
- Metro
- —
- State GDP YoY
- ▲ 3.21%
- F500 in state
- 116
Industry mix (Fortune 500 HQ in CA)
| Industry | F500 HQs | Revenue |
|---|---|---|
| Technology | 27 | $1,492B |
|
||
| Financial Services | 3 | $174B |
|
||
| Retail | 3 | $44B |
|
||
| Insurance | 3 | $26B |
|
||
| Media / Entertainment | 2 | $115B |
|
||
| Pharmaceuticals / Biotech | 2 | $62B |
|
||
Price history
+546.1% since first listed26 events — show timeline
- 2026-05-04 Relisted — TheMLS
- 2026-04-17 Contingent — TheMLS
- 2026-04-06 Listed $1,900,000 TheMLS
- 2025-09-18 Price Changed — TheMLS
- 2025-08-18 Price Changed — TheMLS
- 2025-06-02 Relisted — TheMLS
- 2025-05-22 Contingent — TheMLS
- 2025-04-23 Listed — TheMLS
- 2024-10-08 Listed — TheMLS
- 2018-07-13 Sold (Public Records) $1,500,000 Public Records
- 2007-03-02 Listing Removed — CRMLS
- 2006-09-02 Listed $1,299,000 CRMLS
- 2005-05-24 Sold (Public Records) $915,000 Public Records
- 2005-05-20 Sold (MLS) $915,000 CRMLS
- 2005-01-27 Listed $930,000 CRMLS
- 2004-11-18 Listing Removed — CRMLS
- 2004-10-24 Listed $475,000 CRMLS
- 2004-10-16 Listing Removed — CRMLS
- 2004-09-15 Listed $474,990 CRMLS
- 2004-07-26 Sold (Public Records) $725,000 Public Records
- 2003-11-24 Sold (Public Records) $460,000 Public Records
- 2002-02-20 Listing Removed — CRMLS
- 2001-09-10 Listed $425,000 CRMLS
- 2000-08-15 Listing Removed — CRMLS
- 2000-02-15 Listed $385,000 CRMLS
- 1994-06-22 Sold (Public Records) $294,077 Public Records
Property tax history
+3.4%/yrLatest (2025): $14,942 · +0.2% YoY. Source: county tax records.
Cash-flow waterfall
monthlySold comps — $/sqft
last 12 mo · ≤1 miLoading sold comps…