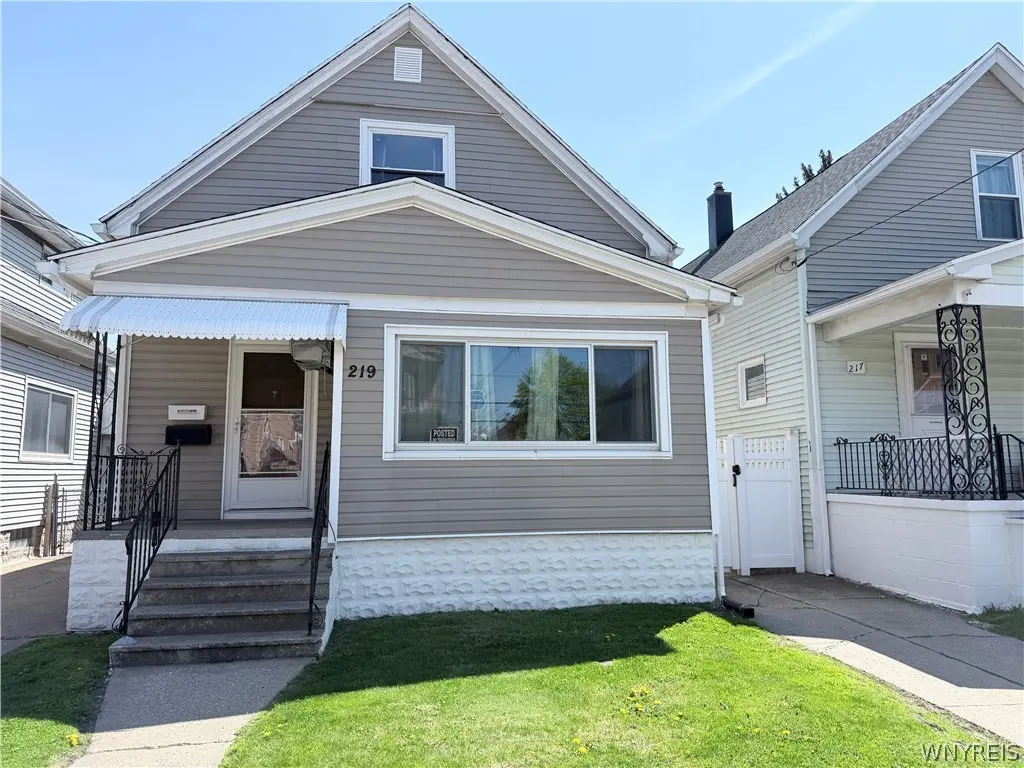
219 Weiss St · Buffalo, NY
Flood risk 1/10 · Minimal
- FEMA flood zone
- X (unshaded)
- Chance of flooding over 30 yrs
- 0.0%
- Est. flood insurance / yr
- $507 – $1,088
Fire risk 1/10 · Minimal
- Est. fire insurance / yr
- $691 – $1,283
Heat risk 3/10 · Minor
- Hot days now (above 92°F)
- 7 days/yr
- Hot days in 30 yrs
- 15 days/yr
Wind risk 1/10 · Minimal
- Chance of severe wind over 30 yrs
- —
Air-quality risk 3/10 · Minor
- Unhealthy air days now
- 2 days/yr
- Unhealthy air days in 30 yrs
- 3 days/yr
Risk factors via First Street. Map © Google.
Why this score? — see what drove the B- grade
The composite is a weighted blend of 9 inputs, each scored 0–100. Each bar is that input's sub-score; the figure is the points it added to the 100-point composite (weight × sub-score).
- Cash flow +22.8/30.0
- ARV discount +12.2/15.0
- Appreciation +9.0/10.0
- DSCR +7.3/10.0
- 1% rule +4.7/10.0
- Livability +3.9/5.0
- Schools +3.3/10.0
- Rent growth +2.5/5.0
- Condition / age +2.5/5.0
$149,000
🖨 Deal sheet 📄 Offer letter ✓ Due diligence
Listing remarks
Why Rent?? This affordable home has all the updates and mechanicals to make your home ownership easy and cost effective! Some Cosmetic Updates and you are all set! Roof and Vinyl Siding (with soffets) in 2015 for carefree exterior maintenance! Whole House Generator and Central Air complete with Updated Electric and Gas Lines to accomodate the installs will Maximize your Comfort! Exterior Storm Doors and many Windows replaced, Glass Block Windows and a Full Dry Basement with Drain Tiles installed! Sump Pump with Battery Backup! Off Street Parking in Driveway is a Plus for the Neighborhood! Fully Fenced Yard for Privacy! All Appliances Included! Offer Deadline for Noon on Saturday May 9th.
Key facts
- Off street parking
- Full dry basement
- Central air
Tags
Property features AI
Exterior
- Parking: Detached garage; One garage space
- Utilities: Electricity connected (circuit breakers); Public water connected; Sewer connected
- Home design: Single-story (with second-floor bedrooms); Vinyl siding; Block foundation; Existing/resale property; City street frontage; Rectangular, residential lot (approx. 30 x 100)
- Construction: Vinyl siding construction; Block foundation
- Exterior features: Concrete driveway; Fully fenced yard; Covered porch
Interior
- Kitchen: Built-in refrigerator; Gas oven and gas range; Dishwasher
- Bedrooms: Two main-level bedrooms; Bedroom 1 on first floor (approx. 11 x 9); Bedroom 2 on first floor (approx. 11 x 8); Bedroom 3 on second floor (approx. 11 x 12); Bedroom 4 on second floor (approx. 11 x 13)
- Flooring: Carpet; Ceramic tile; Varied flooring types
- Bathrooms: One full bathroom (main level)
- Heating & cooling: Gas heating with forced air; Central air; Window and wall air-conditioning units
- Interior features: Ceiling fan(s); Separate/formal living room; Separate/formal dining room; Open living/dining layout; Bedroom on main level; Full basement with sump pump
- Laundry & utility: Washer and dryer; Laundry located in basement; Gas water heater; Whole-house generator
Neighborhood map
What this means for you Summary
Snapshot
- This is a 4-bed/1.0-bath single-family listed at $149k.
Deal economics
- At list price, monthly cash flow is $260 ($3k/yr) — positive.
- The deal already cash-flows at list — no discount required.
- To meet the 1% rule (rent ≥ 1% of price), the offer needs to be $144k (3.1% below list).
- Recommended offer: $144k (3.1% below list) — sets the bar for 1% rule.
Location & tenants
- Location reads 77/100 on livability (#195 in NY, #3,011 nationally) — a middle-class / working-renter tenant base. Strengths: commute A+, housing A+, health & safety A+; Watch: crime F, employment D-.
- Buffalo City School District (urban): math 41% / reading 40% proficiency, ranked #535 of 590 in NY (top 91%) — families likely to look elsewhere, expect single-tenant / working-renter base with shorter leases; 75% free/reduced lunch — lower-income household profile, screen leases tightly.
- Market conditions: 169 active listings in the ZIP; 8 comparable units currently listed for rent nearby; rentals at typical pace (median 24d on market — plan ~3-4 weeks tenant-placement turnaround); 1,244 units permitted in Erie County in 2024 (563 in 5+ unit buildings).
- This rent runs 34% of the median local income ($50k/yr) — at the standard rent-burdened threshold; future hikes will face affordability resistance.
Forward outlook
- In year one you build about $13k of equity ($1k loan paydown + $12k appreciation (8.1% local appreciation)).
- At projected returns (8.1% appreciation + 3.0% rent growth), your $42k cash investment doubles in ~3 years — after that, you're playing with house money.
- By year 3, paydown + projected appreciation supports a ~$33k cash-out refi (75% LTV) — recoverable capital for the next deal without selling this one.
Negotiation context
- Only 5 days on market — expect competitive offers; lowballing is unlikely to land.
- Current owner paid $45k; list at $149k implies a 232% gain — meaningful room to come down on a strong offer.
Risks & watch-outs
- Watch-outs: built in 1930 — expect roof / HVAC / electrical / plumbing capex.
Questions for the listing agent
- Built in 1930 — when were the roof, HVAC, electrical panel, plumbing, and water heater last replaced?
- Is there a deadline driving the sale (1031 exchange, divorce, estate, relocation)? That informs how much negotiation room exists.
- Crime grade is F in this area — have there been break-ins, vandalism, or insurance claims at this property in the last 3 years? What carrier currently insures it and at what premium?
- What's the average days-on-market for RENTAL listings here right now (not sales)? A rising rental-DOM trend means longer vacancies and softer asking-rent achievability than the comps imply.
- What's the recent tenant-quality profile in this submarket — average credit score on applications, eviction rate, late-payment / NSF rate, and stable-employment percentage? A property-management company in the area should have these aggregated.
- How much new for-sale + rental construction is in the pipeline within 1–3 miles? Heavy new supply typically softens prices + rents 12–24 months out; constrained supply supports both.
Investment metrics
- 1% rule
- 0.97% ✗
- Cap rate
- 8.39%
- Cash-on-cash
- 7.49%
- DSCR
- 1.33
- GRM
- 8.6
CMA / ARV
- ARV (median comp)
- $166,198
- List price
- $149,000
- Delta
- -10.35%
- Verdict
- UNDERPRICED
- Comps
- 20 within 1.0 mi
Show comp detail 12 sales within ~0.75 mi
| Address | Dist | Beds/Ba | Sqft | Sold | Price | $/sf | Match |
|---|---|---|---|---|---|---|---|
| 295 Weimar St | 0.05mi | 3/1.5 (-1) | 1,194 (-7%) | 0mo | $209,000 | $175 | 79 |
| 286 Barnard St | 0.12mi | 3/1.5 (-1) | 1,201 (-6%) | 7mo | $185,000 | $154 | 71 |
| 405 Weimar St | 0.18mi | 3/1.0 (-1) | 1,188 (-8%) | 4mo | $197,500 | $166 | 70 |
| 143 Weiss St | 0.15mi | 3/1.0 (-1) | 1,410 (+10%) | 3mo | $106,000 | $75 | 70 |
| 287 Willett St | 0.35mi | 3/1.0 (-1) | 1,342 (+4%) | 3mo | $192,000 | $143 | 69 |
| 580 S Ogden St Unit W | 0.42mi | 4/1.0 | 1,362 (+6%) | 3mo | $145,800 | $107 | 68 |
| 287 Fenton St | 0.26mi | 4/1.0 | 1,170 (-9%) | 6mo | $235,000 | $201 | 68 |
| 72 Weaver St | 0.22mi | 3/1.0 (-1) | 1,176 (-8%) | 4mo | $91,000 | $77 | 68 |
| 89 Roberts Ave | 0.41mi | 3/1.0 (-1) | 1,338 (+4%) | 4mo | $106,500 | $80 | 66 |
| 21 Glenn St | 0.27mi | 3/1.0 (-1) | 1,153 (-10%) | 3mo | $15,000 | $13 | 63 |
| 9 Marann Ter | 0.69mi | 3/1.5 (-1) | 1,280 (-0%) | 2mo | $265,000 | $207 | 58 |
| 303 Casimer St | 0.63mi | 3/1.0 (-1) | 1,159 (-10%) | 7mo | $221,500 | $191 | 44 |
Match score weights: distance 35% · size 25% · config 20% · recency 20%. Top-matched comps best support the ARV.
Projected returns pro-forma
8.06% appreciation · 3.0% rent growth · sell at horizon
- IRR
- 25.9%
- Equity multiple
- 2.88×
- Total profit
- $78,441
- Equity at exit
- $113,792
- IRR
- 23.3%
- Equity multiple
- 6.16×
- Total profit
- $215,152
- Equity at exit
- $226,442
Cash invested: $41,720 (down + closing). Projections, not guarantees.
Landlord ↔ Tenant lean methodology
- Overall (STATE)
- 15 Strongly Tenant-Friendly
- State New York
- 15 Strongly Tenant-Friendly · D+10
- County
- — inherits STATE
- City
- — inherits STATE
ZIP-level market 14206
- Home prices YoY
- 1.8%
- Active inventory
- 169
- Price-to-rent
- 8.6×
Monthly cashflow live
- Estimated rent
- $1,444 high interval (Pro) →
- Mortgage (P&I)
- −$781
- Tax from tax record
- −$37 /mo · $443/yr
- Insurance
- −$62
- HOA
- −$0
- Vacancy / Maint / Mgmt
- −$303
- Net cashflow
- $260
Break-even live
UW: 25.0% down · 7.5% · 30yr · 1.5% tax · 5.0% vac · 8.0% maint · 8.0% mgmt
Financing live
Cash to close
- Down payment
- $37,250
- Closing costs
- $4,470
- Reserves months
- —
- Total cash needed
- —
Loan-product check · same deal, 3 products live
Conventional
25% down · 7.5% · 30yr
- Down + closing
- —
- Monthly P&I
- —
- Monthly cashflow
- —
- DSCR
- —
- Eligible?
- —
Personal DTI + credit; lowest rate.
DSCR
20% down · 8.5% · 30yr
- Down + closing
- —
- Monthly P&I
- —
- Monthly cashflow
- —
- DSCR
- —
- Eligible?
- —
No personal income docs; deal must DSCR.
Hard money
10% down · 12.0% · 12mo
- Down + closing
- —
- Monthly P&I
- —
- Monthly cashflow
- —
- DSCR
- —
- Eligible?
- —
Short-term bridge; refi at stabilization.
Rent comps 8 comps
| Address | Beds | Baths | Sqft | Rent | $/sqft | DOM | Units | Dist |
|---|---|---|---|---|---|---|---|---|
| 1150 Bailey Ave Buffalo, NY | 4.0 | 1.5 | 1100 | $1,200 | $1.09 | 24d | 1 | 0.93mi |
| 1899 Seneca St Buffalo, NY | 3.0 | 1.0 | 1134 | $1,075 | $0.95 | 14d | 1 | 1.03mi |
| 34 Hayden St Unit Back Buffalo, NY | 3.0 | 1.0 | 1200 | $1,600 | $1.33 | 44d | 1 | 1.04mi |
| 47 Lester St Unit Main Floor Buffalo, NY | 3.0 | 1.0 | 900 | $1,000 | $1.11 | 44d | 1 | 1.05mi |
| 1927 Seneca St Buffalo, NY | 3.0 | 1.0 | 1196 | $1,250 | $1.05 | 24d | 1 | 1.05mi |
| 76 Hammerschmidt Ave Buffalo, NY | 3.0 | 1.0 | 1200 | $1,275 | $1.06 | 2d | 1 | 1.07mi |
| 23 Indian Orchard Pl Unit Lower Buffalo, NY | 3.0 | 1.0 | 1200 | $1,250 | $1.04 | 44d | 1 | 1.32mi |
| 298 Cumberland Ave Buffalo, NY | 3.0 | 1.5 | 1208 | $2,200 | $1.82 | 2d | 1 | 1.44mi |
Listing history 3 events
-
2026-05-10status Pending 765-char remark
-
2026-05-04$149,000 Active 765-char remark
-
2004-06-03soldstatus $44,900
ⓘ Source: listings_history table (triggers on properties + properties_extension) + one-shot
backfill from property_details.listing_events for pre-trigger history.
Tax reassessment forecast NY · Partial reset (capped growth)
- Current annual tax
- $443 · $37/mo
- Projected year-2 tax
- $1,480 · $123/mo
- Expected delta
- +$1,038/yr (+$86/mo · 234.5%)
ⓘ Screening estimate from a state-policy table — verify with the county assessor before closing.
Climate risk First Street
- Flood 1/10 Low FEMA zone X (unshaded) · 0% chance over 30 yrs
- Wildfire 1/10 Low
- Heat 3/10 Moderate 7 d/yr ≥92°F today · 15 d/yr by 30 yrs out
- Wind 1/10 Low
- Air quality 3/10 Moderate 2 unhealthy d/yr today · 3 by 30 yrs out
Nearby sold comps map
Loading sold comps map…
Walkable amenities ~0.75 mi
Loading nearby amenities…
Taxation est. · year 1
- Rental income
- $17,325
- − Mortgage interest
- −$8,346
- − Property taxes
- −$443
- − Insurance
- −$745
- − Repairs & maintenance
- −$1,386
- − Management
- −$1,386
- − Depreciation
- −$4,335
- Taxable income
- $685
- Est. tax owed @ 24.0%
- −$164
- After-tax cash flow
- $2,959/yr
For passive investors: Depreciation is non-cash, so a rental often shows a tax loss while cash-flowing — sheltering income. Rental losses are passive: they offset passive income freely, and up to $25,000/yr can offset ordinary (W-2) income if you actively participate and your MAGI is under $100k (phasing out to $0 by $150k); unused losses carry forward. On sale, claimed depreciation is recaptured at up to 25%, and gains may owe capital-gains tax (a 1031 exchange can defer both). Figures are a year-1 estimate at your 24.0% rate — not tax advice; consult a CPA.
Schools (NCES district)
- District
- Buffalo City School District
- NCES district ID
- 3605850
- Math proficiency
- 41% ▲ 11.00%
- Reading proficiency
- 40% ▲ 7.00%
- Median HH income
- $31,665
- Composite
- 33.17/100
- National rank
- #5544
- State rank
- #535 of 590 in NY
Livability — Buffalo
- Score
- 77/100
- State rank
- #195
- US rank
- #3011
Category grades
Schools grade is shown separately in the Schools card above.
Census & demographics
- Census place
- Buffalo, NY
- County
- Erie County · 714,559 people
- City population
- 440,021
- Metro
- Buffalo-Cheektowaga, NY
- Population (ZIP)
- 21,631
- Household income
- $50,450
- Rent vs Own
- Severe rent burden
- 841.0
Population outlook (Erie County) Hauer SSP2
- Today (2025)
- 933,037 people
- By 2030
- 935,181 · +0.2%
- By 2040
- 928,531 · -0.5%
- By 2050
- 905,725 · -2.9%
- By 2075
- 834,037 · -10.6%
- By 2100
- 708,033 · -24.1%
Race, ethnicity, and origin ACS 2023
- Neighborhood character
- Majority White (65%)
- Race & ethnicity
- White 65% Hispanic / Latino 13% Black 12% Two or more races 8% Asian 4%
- Hispanic origin (detail)
- Mexican 2% Puerto Rican 10%
- Common ancestry
- Romanian 25% Lithuanian 1% Italian 1%
- Foreign-born
- 6% · Canada, China
- Languages at home
- 88% English-only · Spanish 5% Other Indo-European 3% Arabic 2%
Political lean MEDSL · Erie
- 2024 margin
- Lean D (+9.7) · D 54.8% · R 45.2%
- 2008→2024 swing
- -7.9pp toward R · 2008: 17.5pp · 2024: 9.7pp
- All cycles
- 2024: D+9.7 2020: D+14.7 2016: D+4.8 2012: D+15.6 2008: D+17.5
Not yet ingested
- Civics
- —
Market trends
- HPI YoY
- ▲ 8.06%
- Current HPI
- 457.3935
- Rent YoY
- —
- Metro
- Buffalo-Cheektowaga, NY
- State GDP YoY
- ▲ 2.60%
- F500 in state
- 92
Industry mix (Fortune 500 HQ in NY)
| Industry | F500 HQs | Revenue |
|---|---|---|
| Financial Services | 10 | $950B |
|
||
| Consumer Goods | 9 | $162B |
|
||
| Insurance | 4 | $225B |
|
||
| Telecommunications | 2 | $144B |
|
||
| Pharmaceuticals | 2 | $112B |
|
||
| Media / Entertainment | 2 | $69B |
|
||
Price history
+231.8% since first listed3 events — show timeline
- 2026-05-10 Pending — WNYREIS
- 2026-05-04 Listed $149,000 WNYREIS
- 2004-06-03 Sold (Public Records) $44,900 Public Records
Property tax history
+4.9%/yrLatest (2025): $443 · +5.3% YoY. Source: county tax records.
Cash-flow waterfall
monthlySold comps — $/sqft
last 12 mo · ≤1 miLoading sold comps…