17751 Panama City Beach Pkwy Unit 2E · Panama City Beach, FL
Flood risk 1/10 · Minimal
- FEMA flood zone
- X (unshaded)
- Chance of flooding over 30 yrs
- 0.0%
- Est. flood insurance / yr
- $507 – $1,088
Fire risk 5/10 · Moderate
- Est. fire insurance / yr
- $947 – $1,759
Heat risk 10/10 · Severe
- Hot days now (above 105°F)
- 7 days/yr
- Hot days in 30 yrs
- 23 days/yr
Wind risk 10/10 · Severe
- Chance of severe wind over 30 yrs
- 99.0%
Air-quality risk 2/10 · Minimal
- Unhealthy air days now
- 1 days/yr
- Unhealthy air days in 30 yrs
- 1 days/yr
Risk factors via First Street. Map © Google.
Why this score? — see what drove the D+ grade
The composite is a weighted blend of 9 inputs, each scored 0–100. Each bar is that input's sub-score; the figure is the points it added to the 100-point composite (weight × sub-score).
- Cash flow +14.1/30.0
- ARV discount +7.5/15.0
- 1% rule +6.3/10.0
- DSCR +4.3/10.0
- Schools +4.3/10.0
- Livability +3.9/5.0
- Rent growth +2.6/5.0
- Condition / age +2.5/5.0
- Appreciation +0.0/10.0
$239,000
🖨 Deal sheet 📄 Offer letter ✓ Due diligence
Listing remarks MLS
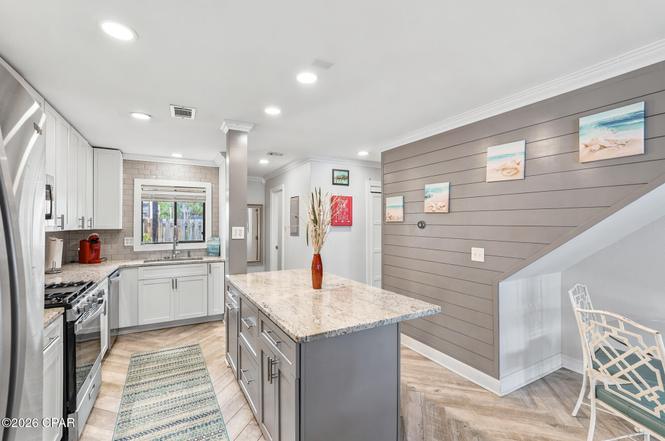
CURRENTLY UNDER CONTRACT, SELLER ACCEPTING BACKUP OFFERS. Great opportunity!!! The Beachwalk condominium is a small, beautifully landscaped community close to the beach. This unit has some wonderful features. It has been nicely updated with renovations which include a reconfigured gourmet kitchen with an island, granite counter tops, new stainless steel appliances (gas stove/oven), subway tile backsplash, custom tile flooring in the main living area & kitchen and a new A/C in 2018. There is a front and back patio and a nice balcony off the master bedroom. Beachwalk has low HOA fees and yet has nice amenities that include a community pool, tennis, and it's own walkway to that leads to the Gulf! Sweet property! Come see!
Key facts
- Large island
- Granite countertops
- Gas range
Tags
Property features AI
Finance
- Other: All units furnished (multi-unit information)
- HOA & community: Homeowners association; Community amenities: beach access, pool, tennis courts, community pool; Short-term rentals allowed
Exterior
- Parking: Additional paved parking
- Security: Smoke detector(s)
- Utilities: Cable connected; Electricity available; Public sewer
- Home design: Two-story property; Entry on level 1
- Construction: Stucco and wood frame construction; Composition/shingle roof; Slab foundation; Dumpster on site
- Exterior features: Patio; Balcony; Covered porch/patio; Community in-ground pool (fenced); Paved lot
Interior
- Kitchen: ENERGY STAR qualified appliances; Electric oven; Gas cooktop; Icemaker
- Bedrooms: Second-floor bedroom (10 x 10); Second-floor bedroom (13 x 12); Primary bedroom on the upper level
- Bathrooms: 2 full bathrooms
- Heating & cooling: Central heating (Electric and Natural Gas); Central air conditioning; Ceiling fan(s)
- Interior features: Upper level primary suite; Walk-in closet(s); Dining/Living combo
Neighborhood map
What this means for you Summary
Snapshot
- This is a 2-bed/2.0-bath condo listed at $239k.
Deal economics
- At list price, monthly cash flow is $35 ($423/yr) — positive.
- The deal already cash-flows at list — no discount required.
- Meets the 1% rule at list price ($3k rent vs $239k).
- Cap rate 6.5% vs local median 2.6% in Panama City Beach — top-decile yield for the area; either an underpriced asset or a hidden risk that comps aren't pricing in. Stress-test before assuming the spread holds.
Location & tenants
- Location reads 78/100 on livability (#172 in FL, #2,624 nationally) — a middle-class / working-renter tenant base. Strengths: crime A+, housing A+, health & safety A+; Watch: amenities D-, commute F.
- Bay (suburban): math 51% / reading 51% proficiency, ranked #29 of 73 in FL (top 40%) — acceptable for families but not a draw, mixed tenant base, ~2y average lease.
- Market conditions: Rents flat; 1249 active listings in the ZIP; 12 comparable units currently listed for rent nearby; rentals at typical pace (median 22d on market — plan ~3-4 weeks tenant-placement turnaround); solid renter incomes; 2,473 units permitted in Bay County in 2024 (559 in 5+ unit buildings).
- This rent runs 40% of the median local income ($80k/yr) — at the standard rent-burdened threshold; future hikes will face affordability resistance.
Forward outlook
- Local home prices are declining (-3.0%/yr); year-one equity from $2k of loan paydown is wiped out by about $7k of value loss. Plan a longer hold.
- Bay County population projected at +24% by 2050 — long-run rental-demand tailwind backs the buy-and-hold thesis.
Negotiation context
- Only 8 days on market — expect competitive offers; lowballing is unlikely to land.
- 9 sale attempts since 13y ago with the ask held roughly flat each time — persistent listings suggest the price (not the market) is what's stuck; bring a comps-based counter.
- Current owner paid $185k; 29% above their basis — modest negotiation headroom, anchor on the comps not their cost.
Risks & watch-outs
- Climate carrying-cost: severe wind risk, 99% chance of damaging wind over 30y; moderate wildfire risk; extreme-heat days projected 7→23/yr by 2055 (HVAC capex compounding) — expect insurance premiums to compound above CPI over the hold.
Questions for the listing agent
- What does the HOA fee cover, when was the last increase, and are there any pending special assessments or reserve-fund shortfalls?
- Any open or pending special assessments — roof, HVAC, plumbing, elevator, façade? What's the per-unit balance and payoff schedule, and is the seller paying it off at close or rolling it to the buyer?
- Is there a deadline driving the sale (1031 exchange, divorce, estate, relocation)? That informs how much negotiation room exists.
- Schools are B-rated — typically a magnet for longer-tenancy family renters. What's the average tenant stay here, and is there a school-zone premium baked into asking?
- The area grade is low — what's the realistic commute time and amenity access for the typical tenant pool here? Any planned neighborhood developments (good or bad) we should know about?
- What's the average days-on-market for RENTAL listings here right now (not sales)? A rising rental-DOM trend means longer vacancies and softer asking-rent achievability than the comps imply.
- What's the recent tenant-quality profile in this submarket — average credit score on applications, eviction rate, late-payment / NSF rate, and stable-employment percentage? A property-management company in the area should have these aggregated.
- How much new apartment / multifamily construction is in the pipeline within 1–3 miles? Heavy new supply (>2% of stock underway) typically softens rents 12–24 months out; light construction supports rent growth.
Investment metrics
- 1% rule
- 1.13% ✓
- Cap rate
- 6.47%
- Cash-on-cash
- 0.63%
- DSCR
- 1.03
- GRM
- 7.4
CMA / ARV
No comps found within radius.
Projected returns pro-forma
-3.0% appreciation · 0.52% rent growth · sell at horizon
- IRR
- -18.7%
- Equity multiple
- 0.36×
- Total profit
- $-42,743
- Equity at exit
- $35,636
- IRR
- -19.0%
- Equity multiple
- 0.12×
- Total profit
- $-58,713
- Equity at exit
- $20,664
Cash invested: $66,920 (down + closing). Projections, not guarantees.
Landlord ↔ Tenant lean methodology
- Overall (STATE)
- 87 Strongly Landlord-Friendly
- State Florida
- 87 Strongly Landlord-Friendly · R+3
- County
- — inherits STATE
- City
- — inherits STATE
ZIP-level market 32413
- Home prices YoY
- -34.4%
- Rents YoY
- 0.5%
- Active inventory
- 1249
- Price-to-rent
- 7.4×
Monthly cashflow live
- Estimated rent
- $2,699 high interval (Pro) →
- Mortgage (P&I)
- −$1,253
- Tax from tax record
- −$247 /mo · $2,961/yr
- Insurance
- −$100
- HOA est. from 2 same-building comps
- −$497
- Vacancy / Maint / Mgmt
- −$567
- Net cashflow
- $35
Break-even live
UW: 25.0% down · 7.5% · 30yr · 1.5% tax · 5.0% vac · 8.0% maint · 8.0% mgmt
Financing live
Cash to close
- Down payment
- $59,750
- Closing costs
- $7,170
- Reserves months
- —
- Total cash needed
- —
Loan-product check · same deal, 3 products live
Conventional
25% down · 7.5% · 30yr
- Down + closing
- —
- Monthly P&I
- —
- Monthly cashflow
- —
- DSCR
- —
- Eligible?
- —
Personal DTI + credit; lowest rate.
DSCR
20% down · 8.5% · 30yr
- Down + closing
- —
- Monthly P&I
- —
- Monthly cashflow
- —
- DSCR
- —
- Eligible?
- —
No personal income docs; deal must DSCR.
Hard money
10% down · 12.0% · 12mo
- Down + closing
- —
- Monthly P&I
- —
- Monthly cashflow
- —
- DSCR
- —
- Eligible?
- —
Short-term bridge; refi at stabilization.
Rent comps 12 comps
| Address | Beds | Baths | Sqft | Rent | $/sqft | DOM | Units | Dist |
|---|---|---|---|---|---|---|---|---|
| 17751 Panama City Beach Pkwy Unit 1523371P Panama City Beach, FL | 2.0 | 2.0 | 1097 | $3,862 | $3.52 | 21d | 1 | 0.11mi |
| 17751 Panama City Beach Pkwy Unit 2E Panama City Beach, FL | 2.0 | 2.0 | 1100 | $2,600 | $2.36 | 21d | 1 | 0.14mi |
| 17614 Front Beach Rd Unit 16D Panama City Beach, FL | 2.0 | 1.0 | 748 | $1,600 | $2.14 | 21d | 1 | 0.15mi |
| 17735 Front Beach Rd Unit 1447171P Panama City Beach, FL | 3.0 | 2.0 | 1227 | $4,925 | $4.01 | 21d | 1 | 0.18mi |
| 17729 Front Beach Rd Unit 1355005P Panama City Beach, FL | 1.0 | 2.0 | 882 | $2,038 | $2.31 | 13d | 1 | 0.19mi |
| 17545 Front Beach Rd Unit 1523333P Panama City, FL | 2.0 | 2.0 | 1140 | $6,472 | $5.68 | 13d | 1 | 0.38mi |
| 17462 Front Beach Rd Unit 1 Panama City Beach, FL | 1.0 | 1.0 | 900 | $1,950 | $2.17 | 21d | 1 | 0.50mi |
| 127 Heather Dr Panama City Beach, FL | 3.0 | 2.0 | 1297 | $2,350 | $1.81 | 13d | 1 | 0.88mi |
| 17225 Panama City Beach Pkwy Panama City Beach, FL | 1.0–2.0 | 1.0–2.0 | 981 | $1,719 | $1.75 | 13d | 10 | 1.01mi |
| 102 Cabana Cay Cir Panama City Beach, FL | 1.0–2.0 | 1.0–2.0 | 950 | $2,143 | $2.26 | 13d | 26 | 1.08mi |
| 19610 Alta Vista Dr Panama City Beach, FL | 2.0 | 1.0 | 1000 | $1,400 | $1.40 | 13d | 1 | 1.18mi |
| 17155 Front Beach Rd Unit 1354915P Panama City Beach, FL | 2.0 | 2.0 | 1194 | $2,498 | $2.09 | 21d | 1 | 1.21mi |
HOA detail condo
- Monthly dues
- $0 · $0/yr
- Likely covers
- gaspool
- Assessments
- None detected in remarks — confirm with the listing agent.
Listing history 8 events
-
2026-06-19days on market $239,000 Active 8 DOM
-
2026-06-18days on market $239,000 Active 7 DOM
-
2026-06-17days on market $239,000 Active 6 DOM
-
2026-06-16days on market $239,000 Active 5 DOM
-
2026-06-15days on market $239,000 Active 4 DOM
-
2026-06-14days on market $239,000 Active 2 DOM
-
2026-06-13remarks 699-char remark
-
2026-06-13$239,000 Active 1 DOM
ⓘ Source: listings_history table (triggers on properties + properties_extension) + one-shot
backfill from property_details.listing_events for pre-trigger history.
Tax reassessment forecast FL · Resets to sale price
- Current annual tax
- $2,961 · $247/mo
- Projected year-2 tax
- $2,961 · $247/mo
- Expected delta
- $0/yr ($0/mo · 0.0%)
ⓘ Screening estimate from a state-policy table — verify with the county assessor before closing.
Climate risk First Street
- Flood 1/10 Low FEMA zone X (unshaded) · 0% chance over 30 yrs
- Wildfire 5/10 Major
- Heat 10/10 Extreme 7 d/yr ≥105°F today · 23 d/yr by 30 yrs out
- Wind 10/10 Extreme 99% chance of damaging wind over 30 yrs
- Air quality 2/10 Low 1 unhealthy d/yr today · 1 by 30 yrs out
Nearby sold comps map
Loading sold comps map…
Walkable amenities ~0.75 mi
Loading nearby amenities…
Taxation est. · year 1
- Rental income
- $32,383
- − Mortgage interest
- −$13,388
- − Property taxes
- −$2,961
- − Insurance
- −$1,195
- − Repairs & maintenance
- −$2,591
- − Management
- −$2,591
- − HOA
- −$5,964
- − Depreciation
- −$6,953
- Taxable loss
- −$3,259
- Est. tax savings @ 24.0%
- +$782
- After-tax cash flow
- $1,205/yr
For passive investors: Depreciation is non-cash, so a rental often shows a tax loss while cash-flowing — sheltering income. Rental losses are passive: they offset passive income freely, and up to $25,000/yr can offset ordinary (W-2) income if you actively participate and your MAGI is under $100k (phasing out to $0 by $150k); unused losses carry forward. On sale, claimed depreciation is recaptured at up to 25%, and gains may owe capital-gains tax (a 1031 exchange can defer both). Figures are a year-1 estimate at your 24.0% rate — not tax advice; consult a CPA.
Schools (NCES district)
- District
- Bay
- NCES district ID
- 1200090
- Math proficiency
- 51% ▼ -8.00%
- Reading proficiency
- 51% ▼ -7.00%
- Median HH income
- $47,740
- Composite
- 43.41/100
- National rank
- #3014
- State rank
- #29 of 73 in FL
Livability — Panama City Beach
- Score
- 78/100
- State rank
- #172
- US rank
- #2624
Category grades
Schools grade is shown separately in the Schools card above.
Census & demographics
- Census place
- Panama City Beach, FL
- County
- Bay County · 163,593 people
- City population
- 50,689
- Metro
- Panama City, FL
- Population (ZIP)
- 15,453
- Household income
- $80,039
- Rent vs Own
- Severe rent burden
- 531.0
Population outlook (Bay County) Hauer SSP2
- Today (2025)
- 206,264 people
- By 2030
- 217,740 · +5.6%
- By 2040
- 238,738 · +15.7%
- By 2050
- 255,545 · +23.9%
- By 2075
- 288,295 · +39.8%
- By 2100
- 288,638 · +39.9%
Race, ethnicity, and origin ACS 2023
- Neighborhood character
- Predominantly White (87%)
- Race & ethnicity
- White 87% Hispanic / Latino 8% Two or more races 6% Black 1%
- Hispanic origin (detail)
- Mexican 1% Puerto Rican 2%
- Common ancestry
- Slovak 3% Italian 3% Lithuanian 2%
- Foreign-born
- 8% · Canada, Jamaica
- Languages at home
- 91% English-only · Spanish 6% Other Indo-European 1% Russian/Polish/Slavic 0%
Political lean MEDSL · Bay
- 2024 margin
- Solid R (+47.4) · D 25.8% · R 73.1% · Other 1.1%
- 2008→2024 swing
- -6.6pp toward R · 2008: -40.7pp · 2024: -47.4pp
- All cycles
- 2024: R+47.4 2020: R+43.5 2016: R+46.3 2012: R+43.6 2008: R+40.7
Not yet ingested
- Civics
- —
Market trends
- HPI YoY
- ▼ -185.97%
- Current HPI
- 354.7469
- Rent YoY
- ▲ 0.52%
- Metro
- Panama City, FL
- State GDP YoY
- ▲ 3.28%
- F500 in state
- 36
Industry mix (Fortune 500 HQ in FL)
| Industry | F500 HQs | Revenue |
|---|---|---|
| Industrial Technology | 2 | $29B |
|
||
| Insurance | 2 | $17B |
|
||
| Retail | 1 | $60B |
|
||
| Technology Distribution | 1 | $58B |
|
||
| Homebuilding | 1 | $35B |
|
||
| Technology Manufacturing | 1 | $35B |
|
||
Price history
+262.7% since first listed21 events — show timeline
- 2026-06-11 Listed $239,000 CPARMLS
- 2026-05-26 Listed for Rent $2,600 APPFOLIO
- 2026-03-14 Rental Removed $2,600 APPFOLIO
- 2026-01-01 Listed for Rent $2,600 APPFOLIO
- 2025-12-21 Rental Removed $2,600 APPFOLIO
- 2025-12-10 Listed for Rent $2,600 APPFOLIO
- 2019-08-26 Sold (Public Records) $185,000 Public Records
- 2019-08-26 Sold (Public Records) $185,000 Public Records
- 2019-08-20 Sold (MLS) $185,000 CPARMLS
- 2019-08-19 Sold (MLS) $185,000 ECAR
- 2019-08-19 Sold (MLS) $185,000 NAMLS
- 2019-05-22 Listed $189,000 ECAR
- 2019-05-22 Listed $189,000 NAMLS
- 2019-05-22 Listed $189,000 CPARMLS
- 2017-11-22 Sold (Public Records) $133,000 Public Records
- 2017-11-14 Sold (MLS) $133,000 CPARMLS
- 2017-07-26 Listed $139,900 CPARMLS
- 2014-05-07 Sold (Public Records) $94,000 Public Records
- 2014-04-30 Sold (MLS) $94,000 CPARMLS
- 2013-09-02 Listed $96,000 CPARMLS
- 2000-06-16 Sold (Public Records) $65,900 Public Records
Property tax history
+10.7%/yrLatest (2025): $2,961 · -2.2% YoY. Source: county tax records.
Cash-flow waterfall
monthlySold comps — $/sqft
last 12 mo · ≤1 miLoading sold comps…