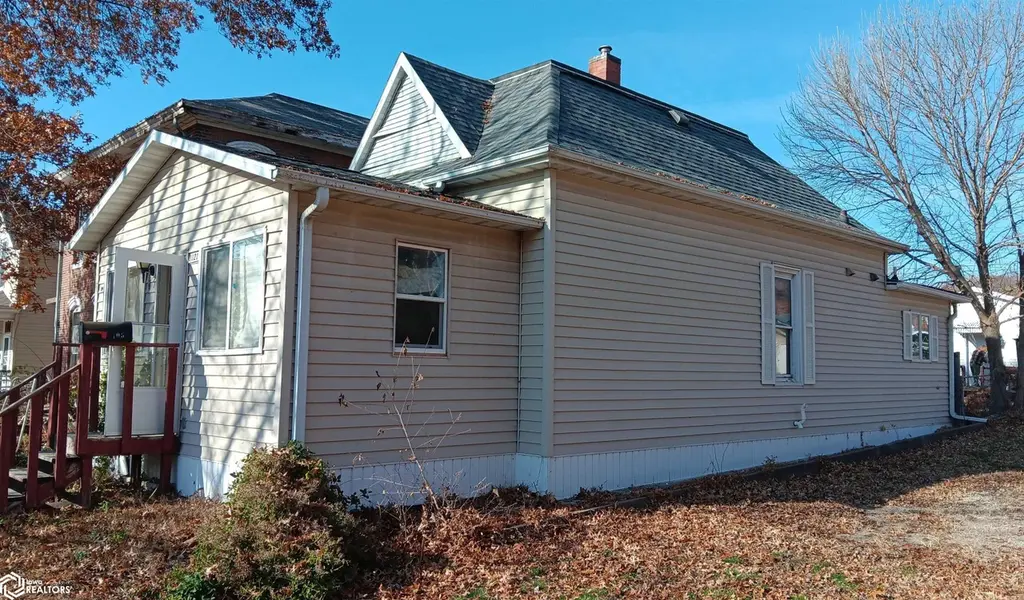
1121 Avenue E · Fort Madison, IA
Flood risk 1/10 · Minimal
- FEMA flood zone
- X (unshaded)
- Chance of flooding over 30 yrs
- 0.0%
- Est. flood insurance / yr
- $473 – $860
Fire risk 3/10 · Minor
- Est. fire insurance / yr
- $902 – $1,676
Heat risk 4/10 · Minor
- Hot days now (above 107°F)
- 7 days/yr
- Hot days in 30 yrs
- 16 days/yr
Wind risk 2/10 · Minimal
- Chance of severe wind over 30 yrs
- —
Air-quality risk 2/10 · Minimal
- Unhealthy air days now
- 0 days/yr
- Unhealthy air days in 30 yrs
- 1 days/yr
Risk factors via First Street. Map © Google.
Why this score? — see what drove the B grade
The composite is a weighted blend of 9 inputs, each scored 0–100. Each bar is that input's sub-score; the figure is the points it added to the 100-point composite (weight × sub-score).
- Cash flow +30.0/30.0
- 1% rule +10.0/10.0
- DSCR +10.0/10.0
- ARV discount +7.5/15.0
- Schools +4.8/10.0
- Livability +3.8/5.0
- Rent growth +2.5/5.0
- Condition / age +2.5/5.0
- Appreciation +0.0/10.0
$25,000
🖨 Deal sheet 📄 Offer letter ✓ Due diligence
Listing remarks MLS
This house is nicely located near the FM downtown and river area. It boasts a sizable 2 car garage. It needs some fixing up but has potential. This property is selling as an estate and is selling AS-IS. Make an appointment with your realtor today!
Key facts
- River area
- 3,485 sq ft lot
- 2 garage spots
Tags
Neighborhood map
What this means for you Summary
Snapshot
- This is a 1-bed/1.0-bath single-family listed at $25k.
Deal economics
- At list price, monthly cash flow is $450 ($5k/yr) — positive.
- The deal already cash-flows at list — no discount required.
- Meets the 1% rule at list price ($877 rent vs $25k).
- Recommended offer: $22k (12.0% below list) — sets the bar for market timing.
- Cap rate 27.9% vs local median 5.3% in Fort Madison — top-decile yield for the area; either an underpriced asset or a hidden risk that comps aren't pricing in. Stress-test before assuming the spread holds.
Location & tenants
- Location reads 75/100 on livability (#230 in IA, #4,353 nationally) — a middle-class / working-renter tenant base. Strengths: cost of living A+, housing A+, health & safety A+; Watch: commute F, employment D-.
- Fort Madison Community School District (town): math 55% / reading 58% proficiency, ranked #260 of 289 in IA (top 90%) — acceptable for families but not a draw, mixed tenant base, ~2y average lease.
- Market conditions: 64 active listings in the ZIP; 15 units permitted in Lee County in 2024 (0 in 5+ unit buildings).
Forward outlook
- Local home prices are declining (-3.0%/yr); year-one equity from $173 of loan paydown is wiped out by about $750 of value loss. Plan a longer hold.
- Lee County population projected at -15% by 2050 — secular population decline; favor cash flow + early exit over multi-decade hold.
- At projected returns (-3.0% appreciation + 3.0% rent growth), your $7k cash investment doubles in ~2 years — after that, you're playing with house money.
Negotiation context
- It's been on market 192 days — a 12% lower offer ($22k) is reasonable based on typical stale-listing flexibility.
Risks & watch-outs
- Watch-outs: property tax is 4.9% of price; built in 1890 — expect roof / HVAC / electrical / plumbing capex.
Questions for the listing agent
- It's been on market 192 days. Have you received any prior offers? Is the seller open to a 12% concession, seller financing, or rate buy-down credit?
- Built in 1890 — when were the roof, HVAC, electrical panel, plumbing, and water heater last replaced?
- Property tax is high relative to price — has the assessment been appealed recently, and will the sale trigger a re-assessment?
- Why hasn't it sold? Are there any deal-killer items the seller is aware of (foundation, flood, title, zoning, code violations)?
- Is there a deadline driving the sale (1031 exchange, divorce, estate, relocation)? That informs how much negotiation room exists.
- Schools are B-rated — typically a magnet for longer-tenancy family renters. What's the average tenant stay here, and is there a school-zone premium baked into asking?
- What's the average days-on-market for RENTAL listings here right now (not sales)? A rising rental-DOM trend means longer vacancies and softer asking-rent achievability than the comps imply.
- What's the recent tenant-quality profile in this submarket — average credit score on applications, eviction rate, late-payment / NSF rate, and stable-employment percentage? A property-management company in the area should have these aggregated.
- How much new for-sale + rental construction is in the pipeline within 1–3 miles? Heavy new supply typically softens prices + rents 12–24 months out; constrained supply supports both.
Investment metrics
- 1% rule
- 3.51% ✓
- Cap rate
- 27.90%
- Cash-on-cash
- 77.15%
- DSCR
- 4.43
- GRM
- 2.4
CMA / ARV
- ARV (median comp)
- $55,253
- List price
- $25,000
- Delta
- -54.75%
- Verdict
- UNDERPRICED
- Comps
- 20 within 1.0 mi
Show comp detail 12 sales within ~0.75 mi
| Address | Dist | Beds/Ba | Sqft | Sold | Price | $/sf | Match |
|---|---|---|---|---|---|---|---|
| 1205 Avenue G | 0.16mi | 2/1.0 (+1) | 1,020 (+5%) | 7mo | $45,000 | $44 | 74 |
| 1322 Avenue G | 0.20mi | 2/1.0 (+1) | 973 (-0%) | 14mo | $17,900 | $18 | 74 |
| 1316 Avenue G | 0.25mi | 2/1.0 (+1) | 892 (-8%) | 9mo | $75,000 | $84 | 62 |
| 1215 Avenue G | 0.16mi | 2/1.0 (+1) | 1,099 (+13%) | 7mo | $10,000 | $9 | 60 |
| 1515 Avenue C Ave | 0.40mi | 2/1.0 (+1) | 1,059 (+9%) | 8mo | $120,000 | $113 | 56 |
| 1328 Avenue G | 0.27mi | 2/1.0 (+1) | 860 (-12%) | 10mo | $37,500 | $44 | 54 |
| 1430 Avenue I | 0.44mi | 2/1.0 (+1) | 960 (-2%) | 21mo | $160,000 | $167 | 54 |
| 1731 Avenue J | 0.70mi | 2/1.0 (+1) | 990 (+2%) | 8mo | $54,000 | $55 | 53 |
| 414 18th St | 0.62mi | 2/1.0 (+1) | 921 (-6%) | 7mo | $35,000 | $38 | 51 |
| 1106 Avenue E | 0.05mi | 2/1.5 (+1) | 1,120 (+15%) | 20mo | $53,000 | $47 | 49 |
| 1501 Avenue D | 0.35mi | 2/1.5 (+1) | 1,092 (+12%) | 20mo | $35,000 | $32 | 40 |
| 435 Avenue A | 0.70mi | 2/1.0 (+1) | 1,040 (+7%) | 23mo | $85,000 | $82 | 32 |
Match score weights: distance 35% · size 25% · config 20% · recency 20%. Top-matched comps best support the ARV.
Projected returns pro-forma
-3.0% appreciation · 3.0% rent growth · sell at horizon
- IRR
- 77.2%
- Equity multiple
- 4.52×
- Total profit
- $24,669
- Equity at exit
- $3,728
- IRR
- 80.8%
- Equity multiple
- 9.37×
- Total profit
- $58,620
- Equity at exit
- $2,162
Cash invested: $7,000 (down + closing). Projections, not guarantees.
Landlord ↔ Tenant lean methodology
- Overall (STATE)
- 83 Strongly Landlord-Friendly
- State Iowa
- 83 Strongly Landlord-Friendly · R+6
- County
- — inherits STATE
- City
- — inherits STATE
ZIP-level market 52627
- Home prices YoY
- -28.6%
- Active inventory
- 64
- Price-to-rent
- 2.4×
Monthly cashflow live
- Estimated rent
- $877 medium interval (Pro) →
- Mortgage (P&I)
- −$131
- Tax from tax record
- −$102 /mo · $1,218/yr
- Insurance
- −$10
- HOA
- −$0
- Vacancy / Maint / Mgmt
- −$184
- Net cashflow
- $450
Break-even live
UW: 25.0% down · 7.5% · 30yr · 1.5% tax · 5.0% vac · 8.0% maint · 8.0% mgmt
Financing live
Cash to close
- Down payment
- $6,250
- Closing costs
- $750
- Reserves months
- —
- Total cash needed
- —
Loan-product check · same deal, 3 products live
Conventional
25% down · 7.5% · 30yr
- Down + closing
- —
- Monthly P&I
- —
- Monthly cashflow
- —
- DSCR
- —
- Eligible?
- —
Personal DTI + credit; lowest rate.
DSCR
20% down · 8.5% · 30yr
- Down + closing
- —
- Monthly P&I
- —
- Monthly cashflow
- —
- DSCR
- —
- Eligible?
- —
No personal income docs; deal must DSCR.
Hard money
10% down · 12.0% · 12mo
- Down + closing
- —
- Monthly P&I
- —
- Monthly cashflow
- —
- DSCR
- —
- Eligible?
- —
Short-term bridge; refi at stabilization.
Listing history 10 events
-
2026-06-07statusdays on market $25,000 Pending 192 DOM
-
2026-06-03days on market $25,000 Active 191 DOM
-
2026-06-02days on market $25,000 Active 190 DOM
-
2026-06-01days on market $25,000 Active 189 DOM
-
2026-05-31days on market $25,000 Active 188 DOM
-
2026-05-30days on market $25,000 Active 187 DOM
-
2026-05-05price $25,000 247-char remark
Show marketing remark (247 chars)
This house is nicely located near the FM downtown and river area. It boasts a sizable 2 car garage. It needs some fixing up but has potential. This property is selling as an estate and is selling AS-IS. Make an appointment with your realtor today!
-
2026-03-23price $29,000 247-char remark
Show marketing remark (247 chars)
This house is nicely located near the FM downtown and river area. It boasts a sizable 2 car garage. It needs some fixing up but has potential. This property is selling as an estate and is selling AS-IS. Make an appointment with your realtor today!
-
2025-11-24$35,000 Active 247-char remark
Show marketing remark (247 chars)
This house is nicely located near the FM downtown and river area. It boasts a sizable 2 car garage. It needs some fixing up but has potential. This property is selling as an estate and is selling AS-IS. Make an appointment with your realtor today!
-
2016-08-22soldstatus $47,000
ⓘ Source: listings_history table (triggers on properties + properties_extension) + one-shot
backfill from property_details.listing_events for pre-trigger history.
Tax reassessment forecast IA · Partial reset (capped growth)
- Current annual tax
- $1,218 · $102/mo
- Projected year-2 tax
- $1,218 · $102/mo
- Expected delta
- $0/yr ($0/mo · 0.0%)
ⓘ Screening estimate from a state-policy table — verify with the county assessor before closing.
Climate risk First Street
- Flood 1/10 Low FEMA zone X (unshaded) · 0% chance over 30 yrs
- Wildfire 3/10 Moderate
- Heat 4/10 Moderate 7 d/yr ≥107°F today · 16 d/yr by 30 yrs out
- Wind 2/10 Low
- Air quality 2/10 Low 0 unhealthy d/yr today · 1 by 30 yrs out
Nearby sold comps map
Loading sold comps map…
Walkable amenities ~0.75 mi
Loading nearby amenities…
Taxation est. · year 1
- Rental income
- $10,528
- − Mortgage interest
- −$1,400
- − Property taxes
- −$1,218
- − Insurance
- −$125
- − Repairs & maintenance
- −$842
- − Management
- −$842
- − Depreciation
- −$727
- Taxable income
- $5,373
- Est. tax owed @ 24.0%
- −$1,289
- After-tax cash flow
- $4,111/yr
For passive investors: Depreciation is non-cash, so a rental often shows a tax loss while cash-flowing — sheltering income. Rental losses are passive: they offset passive income freely, and up to $25,000/yr can offset ordinary (W-2) income if you actively participate and your MAGI is under $100k (phasing out to $0 by $150k); unused losses carry forward. On sale, claimed depreciation is recaptured at up to 25%, and gains may owe capital-gains tax (a 1031 exchange can defer both). Figures are a year-1 estimate at your 24.0% rate — not tax advice; consult a CPA.
Schools (NCES district)
- District
- Fort Madison Community School District
- NCES district ID
- 1911850
- Math proficiency
- 55% ▼ -7.00%
- Reading proficiency
- 58% ▼ -2.00%
- Median HH income
- $46,801
- Composite
- 47.87/100
- National rank
- #2218
- State rank
- #260 of 289 in IA
Livability — Fort Madison
- Score
- 75/100
- State rank
- #230
- US rank
- #4353
Category grades
Schools grade is shown separately in the Schools card above.
Census & demographics
- Census place
- Fort Madison, IA
- Population (ZIP)
- 12,585
Population outlook (Lee County) Hauer SSP2
- Today (2025)
- 33,813 people
- By 2030
- 32,835 · -2.9%
- By 2040
- 30,690 · -9.2%
- By 2050
- 28,777 · -14.9%
- By 2075
- 25,568 · -24.4%
- By 2100
- 21,983 · -35.0%
Race, ethnicity, and origin ACS 2023
- Neighborhood character
- Predominantly White (88%)
- Race & ethnicity
- White 88% Two or more races 5% Hispanic / Latino 5% Black 4%
- Common ancestry
- Slovak 2% Portuguese 1% Italian 1%
- Foreign-born
- 1%
- Languages at home
- 98% English-only · Spanish 2%
Political lean MEDSL · Lee
- 2024 margin
- Strong R (+27.8) · D 35.0% · R 62.9% · Other 2.1%
- 2008→2024 swing
- -43.8pp toward R · 2008: 16.0pp · 2024: -27.8pp
- All cycles
- 2024: R+27.8 2020: R+19.3 2016: R+16.1 2012: D+16.0 2008: D+16.0
Not yet ingested
- Civics
- —
Market trends
- HPI YoY
- ▼ -70.32%
- Current HPI
- 175.7708
- Rent YoY
- —
- Metro
- —
- State GDP YoY
- ▲ 2.48%
- F500 in state
- 4
Industry mix (Fortune 500 HQ in IA)
| Industry | F500 HQs | Revenue |
|---|---|---|
| Financial Services | 1 | $16B |
|
||
| Retail / Convenience | 1 | $15B |
|
||
Price history
-46.8% since first listed4 events — show timeline
- 2026-05-05 Price Changed $25,000 IAR
- 2026-03-23 Price Changed $29,000 IAR
- 2025-11-24 Listed $35,000 IAR
- 2016-08-22 Sold (Public Records) $47,000 Public Records
Property tax history
+2.2%/yrLatest (2025): $1,218 · +46.1% YoY. Source: county tax records.
Cash-flow waterfall
monthlySold comps — $/sqft
last 12 mo · ≤1 miLoading sold comps…