 🔨 Auction
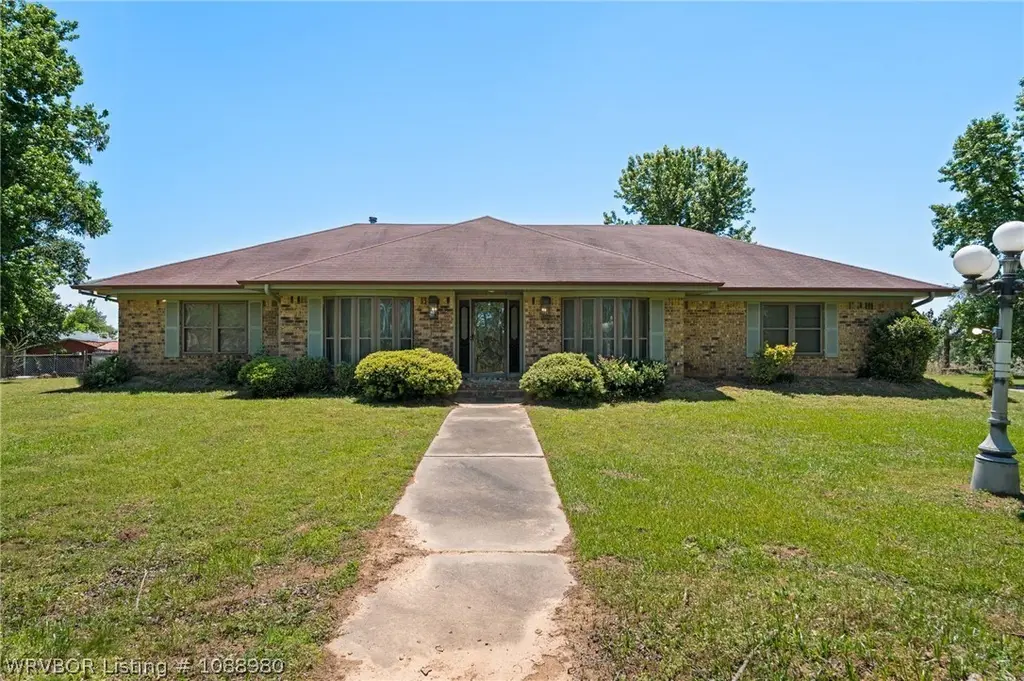
600 SE 12th St · Muldrow, OK
Flood risk 1/10 · Minimal
- FEMA flood zone
- X (unshaded)
- Chance of flooding over 30 yrs
- 0.0%
- Est. flood insurance / yr
- $507 – $1,088
Fire risk 7/10 · Major
- Est. fire insurance / yr
- $2,463 – $4,575
Heat risk 6/10 · Moderate
- Hot days now (above 111°F)
- 7 days/yr
- Hot days in 30 yrs
- 20 days/yr
Wind risk 2/10 · Minimal
- Chance of severe wind over 30 yrs
- 4.0%
Air-quality risk 2/10 · Minimal
- Unhealthy air days now
- 0 days/yr
- Unhealthy air days in 30 yrs
- 1 days/yr
Risk factors via First Street. Map © Google.
Why this score? — see what drove the C- grade
The composite is a weighted blend of 9 inputs, each scored 0–100. Each bar is that input's sub-score; the figure is the points it added to the 100-point composite (weight × sub-score).
- Cash flow +15.0/30.0
- Appreciation +10.0/10.0
- ARV discount +7.5/15.0
- 1% rule +5.0/10.0
- DSCR +5.0/10.0
- Livability +2.8/5.0
- Rent growth +2.5/5.0
- Schools +2.5/10.0
- Condition / age +2.5/5.0
$1
🖨 Deal sheet (PDF) 📄 Offer letter ✓ Due diligence
Listing remarks
Auction 06/18/2026 at 10:00 AM Spacious country property featuring a 2,501± square foot single-level brick home situated on 5.39± acres. This well-maintained property offers 3 bedrooms, 2.5 bathrooms, and plenty of room both inside and out. Improvements include a barn, multiple outbuildings, and enclosed garage space, providing excellent storage and workspace opportunities. Located on a large corner lot with ample room for livestock, hobbies, equipment, or recreational use. Enjoy the convenience of country living with space to spread out and endless potential.
Key facts
- Barn
- Large corner lot
- 5.39 acres
Tags
Property features AI
Exterior
- Parking: Gravel and concrete parking
- Security: Smoke detectors
- Utilities: Public water; Electricity available; Natural gas available; Water available
- Home design: Single-family house; One story; Slab foundation
- Construction: Brick construction; Shingle roof
- Exterior features: Covered patio and porch; Porch; Backyard fencing (chain link, partial, wire); Outbuilding
Interior
- Kitchen: Dishwasher; Disposal; Microwave; Range; Refrigerator; Gas water heater
- Flooring: Carpet; Laminate
- Bathrooms: 2 full bathrooms; 1 half bathroom
- Heating & cooling: Central heating (natural gas); Central air; Ceiling fans; Electric cooling
- Interior features: Built-in features; Ceiling fans; Eat-in kitchen; Storage; Walk-in closet(s); Blinds and drapes; Wood-burning fireplace in the living room
- Laundry & utility: Washer hookup; Electric dryer hookup
Neighborhood map
What this means for you Summary
Snapshot
- This is a 3-bed/3.0-bath single-family listed at $1.
Deal economics
- At list price, monthly cash flow is $1k ($12k/yr) — positive.
- The deal already cash-flows at list — no discount required.
- Meets the 1% rule at list price ($1k rent vs $1).
- Cap rate 1207882.7% vs local median 3.8% in Muldrow — top-decile yield for the area; either an underpriced asset or a hidden risk that comps aren't pricing in. Stress-test before assuming the spread holds.
Location & tenants
- Location reads 56/100 on livability (#505 in OK) — a working-class tenant base; expect higher turnover. Strengths: cost of living A+, housing A; Watch: crime F, amenities F, commute F.
- Muldrow (town): math 29% / reading 30% proficiency, ranked #71 of 270 in OK (top 26%) — low school quality limits family demand, transient renter base, plan for 1-2y turnover; 62% free/reduced lunch — lower-income household profile, screen leases tightly.
- Zoned schools: Muldrow Es (math 32% / reading 32%, grade F, #213 of 845 statewide, top 28%, 484 students, 0% FRL); Muldrow Ms (math 31% / reading 26%, grade F, #57 of 345 statewide, top 18%, 329 students, 0% FRL); Muldrow Hs (math 17% / reading 37%, grade F, #125 of 447 statewide, top 31%, 479 students, 0% FRL) — zoned schools average 0% FRL vs 62% district-wide (62 pts lower); this property's tenant base skews higher-income than the district average.
- Market conditions: 109 active listings in the ZIP; 125 units permitted in Sequoyah County in 2024 (0 in 5+ unit buildings).
Forward outlook
- Sequoyah County population projected at -16% by 2050 — secular population decline; favor cash flow + early exit over multi-decade hold.
- At projected returns (10.0% appreciation + 3.0% rent growth), your $0 cash investment doubles in ~1 year — after that, you're playing with house money.
Negotiation context
- It's been on market 39 days — a 3% lower offer ($0) is reasonable based on typical stale-listing flexibility.
Risks & watch-outs
- Climate carrying-cost: major wildfire risk; extreme-heat days projected 7→20/yr by 2055 (HVAC capex compounding) — expect insurance premiums to compound above CPI over the hold.
Questions for the listing agent
- It's been on market 39 days. Have you received any prior offers? Is the seller open to a 5% concession, seller financing, or rate buy-down credit?
- Built in 1978 — when were the roof, HVAC, electrical panel, plumbing, and water heater last replaced?
- Is there a deadline driving the sale (1031 exchange, divorce, estate, relocation)? That informs how much negotiation room exists.
- Schools are F-rated, which usually means shorter tenancies and higher turnover. Who's the typical renter profile here, and what's been the actual vacancy rate?
- Crime grade is F in this area — have there been break-ins, vandalism, or insurance claims at this property in the last 3 years? What carrier currently insures it and at what premium?
- What's the average days-on-market for RENTAL listings here right now (not sales)? A rising rental-DOM trend means longer vacancies and softer asking-rent achievability than the comps imply.
- What's the recent tenant-quality profile in this submarket — average credit score on applications, eviction rate, late-payment / NSF rate, and stable-employment percentage? A property-management company in the area should have these aggregated.
- How much new for-sale + rental construction is in the pipeline within 1–3 miles? Heavy new supply typically softens prices + rents 12–24 months out; constrained supply supports both.
Investment metrics
- 1% rule
- 127414.00% ✓
- Cap rate
- 1207882.72%
- Cash-on-cash
- 4313844.38%
- DSCR
- 191942.80
- GRM
- 0.0
CMA / ARV
No comps found within radius.
Projected returns pro-forma
10.0% appreciation · 3.0% rent growth · sell at horizon
- IRR
- —
- Equity multiple
- 229030.80×
- Total profit
- $64,128
- Equity at exit
- $1
- IRR
- —
- Equity multiple
- 494540.64×
- Total profit
- $138,471
- Equity at exit
- $2
Cash invested: $0 (down + closing). Projections, not guarantees.
Landlord ↔ Tenant lean methodology
- Overall (STATE)
- 83 Strongly Landlord-Friendly
- State Oklahoma
- 83 Strongly Landlord-Friendly · R+20
- County
- — inherits STATE
- City
- — inherits STATE
ZIP-level market 74948
- Home prices YoY
- 17.6%
- Active inventory
- 109
Monthly cashflow live
- Estimated rent
- $1,274 medium interval (Pro) →
- Mortgage (P&I)
- −$0
- Tax est. 1.5%
- −$0 /mo · $0/yr
- Insurance
- −$0
- HOA
- −$0
- Vacancy / Maint / Mgmt
- −$268
- Net cashflow
- $1,007
Break-even live
Sensitivity live
| Price | -10% $1,007 | -5% $1,007 | +0% $1,007 | +5% $1,007 | +10% $1,007 |
|---|---|---|---|---|---|
| Rent | -10% $906 | -5% $956 | +0% $1,007 | +5% $1,057 | +10% $1,107 |
| Rate | -1.0pp $1,007 | -0.5pp $1,007 | base $1,007 | +0.5pp $1,007 | +1.0pp $1,007 |
UW: 25.0% down · 7.5% · 30yr · 1.5% tax · 5.0% vac · 8.0% maint · 8.0% mgmt
Financing live
Cash to close
- Down payment
- $0
- Closing costs
- $0
- Reserves months
- —
- Total cash needed
- —
Loan-product check · same deal, 3 products live
Conventional
25% down · 7.5% · 30yr
- Down + closing
- —
- Monthly P&I
- —
- Monthly cashflow
- —
- DSCR
- —
- Eligible?
- —
Personal DTI + credit; lowest rate.
DSCR
20% down · 8.5% · 30yr
- Down + closing
- —
- Monthly P&I
- —
- Monthly cashflow
- —
- DSCR
- —
- Eligible?
- —
No personal income docs; deal must DSCR.
Hard money
10% down · 12.0% · 12mo
- Down + closing
- —
- Monthly P&I
- —
- Monthly cashflow
- —
- DSCR
- —
- Eligible?
- —
Short-term bridge; refi at stabilization.
Listing history 18 events
-
2026-06-19days on market $1 Active 39 DOM
-
2026-06-18days on market $1 Active 38 DOM
-
2026-06-17days on market $1 Active 37 DOM
-
2026-06-16days on market $1 Active 36 DOM
-
2026-06-15days on market $1 Active 35 DOM
-
2026-06-14days on market $1 Active 33 DOM
-
2026-06-13days on market $1 Active 32 DOM
-
2026-06-10days on market $1 Active 30 DOM
-
2026-06-09days on market $1 Active 29 DOM
-
2026-06-08days on market $1 Active 28 DOM
-
2026-06-07days on market $1 Active 27 DOM
-
2026-06-05days on market $1 Active 24 DOM
-
2026-06-02days on market $1 Active 22 DOM
-
2026-06-01days on market $1 Active 21 DOM
-
2026-05-31days on market $1 Active 20 DOM
-
2026-05-30days on market $1 Active 19 DOM
-
2026-05-11$1 Active
-
2000-05-03soldstatus $155,000
ⓘ Source: listings_history table (triggers on properties + properties_extension) + one-shot
backfill from property_details.listing_events for pre-trigger history.
Climate risk First Street
- Flood 1/10 Low FEMA zone X (unshaded) · 0% chance over 30 yrs
- Wildfire 7/10 Severe
- Heat 6/10 Major 7 d/yr ≥111°F today · 20 d/yr by 30 yrs out
- Wind 2/10 Low 4% chance of damaging wind over 30 yrs
- Air quality 2/10 Low 0 unhealthy d/yr today · 1 by 30 yrs out
Nearby sold comps map
Loading sold comps map…
Walkable amenities ~0.75 mi
Loading nearby amenities…
Taxation est. · year 1
- Rental income
- $15,290
- − Mortgage interest
- −$0
- − Property taxes
- −$0
- − Insurance
- −$0
- − Repairs & maintenance
- −$1,223
- − Management
- −$1,223
- − Depreciation
- −$0
- Taxable income
- $12,843
- Est. tax owed @ 24.0%
- −$3,082
- After-tax cash flow
- $8,996/yr
For passive investors: Depreciation is non-cash, so a rental often shows a tax loss while cash-flowing — sheltering income. Rental losses are passive: they offset passive income freely, and up to $25,000/yr can offset ordinary (W-2) income if you actively participate and your MAGI is under $100k (phasing out to $0 by $150k); unused losses carry forward. On sale, claimed depreciation is recaptured at up to 25%, and gains may owe capital-gains tax (a 1031 exchange can defer both). Figures are a year-1 estimate at your 24.0% rate — not tax advice; consult a CPA.
Schools (NCES district)
- District
- Muldrow
- NCES district ID
- 4020880
- Math proficiency
- 29% ▼ -11.00%
- Reading proficiency
- 30% ▼ -9.00%
- Median HH income
- $39,775
- Composite
- 24.81/100
- National rank
- #7595
- State rank
- #71 of 270 in OK
Livability — Muldrow
- Score
- 56/100
- State rank
- #505
- US rank
- #22502
Category grades
Schools grade is shown separately in the Schools card above.
Census & demographics
- Census place
- Muldrow, OK
- Population (ZIP)
- 11,946
Population outlook (Sequoyah County) Hauer SSP2
- Today (2025)
- 39,398 people
- By 2030
- 38,215 · -3.0%
- By 2040
- 35,625 · -9.6%
- By 2050
- 32,943 · -16.4%
- By 2075
- 27,805 · -29.4%
- By 2100
- 23,311 · -40.8%
Race, ethnicity, and origin ACS 2023
- Neighborhood character
- Diverse neighborhood (Simpson 0.59)
- Race & ethnicity
- White 64% Native American 16% Two or more races 15% Hispanic / Latino 6% Asian 1%
- Hispanic origin (detail)
- Mexican 5%
- Common ancestry
- Italian 1% Slovak 1% Serbian 1%
- Foreign-born
- 3% · Canada
- Languages at home
- 92% English-only · Spanish 5% Tagalog/Filipino 1%
Political lean MEDSL · Sequoyah
- 2024 margin
- Solid R (+61.5) · D 18.6% · R 80.2% · Other 1.2%
- 2008→2024 swing
- -25.5pp toward R · 2008: -36.0pp · 2024: -61.5pp
- All cycles
- 2024: R+61.5 2020: R+59.0 2016: R+54.2 2012: R+39.1 2008: R+36.0
Not yet ingested
- Civics
- —
Market trends
- HPI YoY
- ▲ 38.01%
- Current HPI
- 253.7544
- Rent YoY
- —
- Metro
- —
- State GDP YoY
- ▲ 1.55%
- F500 in state
- 6
Industry mix (Fortune 500 HQ in OK)
| Industry | F500 HQs | Revenue |
|---|---|---|
| Energy | 3 | $48B |
|
||
Price history
2 events — show timeline
- 2026-05-11 Listed $1 WRVBOR
- 2000-05-03 Sold (Public Records) $155,000 Public Records
Property tax history
+0.6%/yrLatest (2025): $1,232 · +4.9% YoY. Source: county tax records.
Cash-flow waterfall
monthlySold comps — $/sqft
last 12 mo · ≤1 miLoading sold comps…