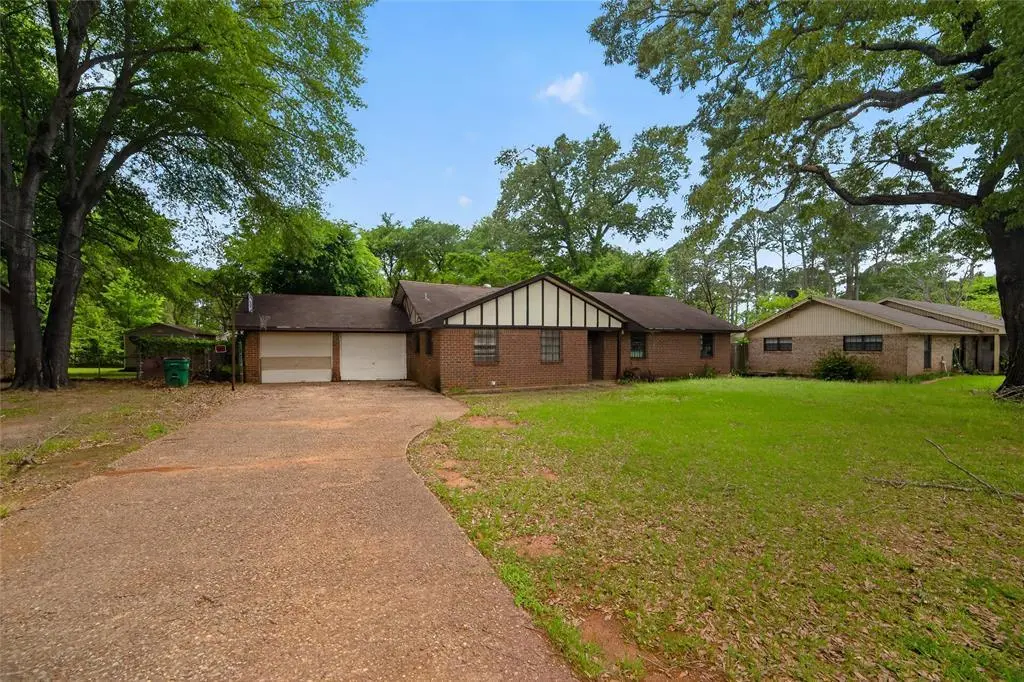
206 Clover Ln · Palestine, TX
Flood risk 1/10 · Minimal
- FEMA flood zone
- X (unshaded)
- Chance of flooding over 30 yrs
- 0.0%
- Est. flood insurance / yr
- $507 – $1,088
Fire risk 3/10 · Minor
- Est. fire insurance / yr
- $1,222 – $2,270
Heat risk 7/10 · Major
- Hot days now (above 110°F)
- 7 days/yr
- Hot days in 30 yrs
- 26 days/yr
Wind risk 6/10 · Moderate
- Chance of severe wind over 30 yrs
- 74.0%
Air-quality risk 1/10 · Minimal
- Unhealthy air days now
- 0 days/yr
- Unhealthy air days in 30 yrs
- 0 days/yr
Risk factors via First Street. Map © Google.
Why this score? — see what drove the B- grade
The composite is a weighted blend of 9 inputs, each scored 0–100. Each bar is that input's sub-score; the figure is the points it added to the 100-point composite (weight × sub-score).
- Cash flow +25.3/30.0
- ARV discount +15.0/15.0
- DSCR +8.4/10.0
- 1% rule +8.1/10.0
- Livability +3.3/5.0
- Rent growth +2.5/5.0
- Condition / age +2.5/5.0
- Schools +2.4/10.0
- Appreciation +0.0/10.0
$110,000
🖨 Deal sheet 📄 Offer letter ✓ Due diligence
Listing remarks
206 Clover Lane is a 1,592 square foot single-family residence located in the Westwood Arms Annex subdivision of Palestine, Texas. Built in 1978, the brick house contains three bedrooms and two bathrooms on a 0.25-acre level lot. The interior includes a fireplace, central cooling, and an attached garage. The property is situated within the Westwood Independent School District and is accessed via TX-19, positioned approximately two miles from the center of Palestine.
Key facts
- 0.25 acre lot
- 2 garage spots
- Built 1978
Property features AI
Finance
- Other: Parcel: R36663; County: Anderson; Property type: Residential — Single Family Residence; Listing status: Active; Possession at closing/funding
- Financial info: Treat as clear loan type; No second mortgage indicated
- HOA & community: No association
Exterior
- Parking: 2 covered parking spaces; 2-car attached garage; Driveway
- Utilities: City water; City sewer; Electricity connected; Not in a municipal utility district
- Home design: Single-family residence; One-story; Residential property
- Construction: Built in 1978
- Exterior features: Lot under 0.5 acre (approx. 0.254 acres); Subdivision: Westwood Arms Annex #1
Interior
- Kitchen: Electric cooktop; Electric oven; Pantry
- Bedrooms: Primary bedroom on main level (approx. 12 x 14)
- Bathrooms: 3 full bathrooms
- Heating & cooling: Vaulted ceiling(s) (may indicate higher ceilings in main living areas)
- Interior features: Open floorplan; Pantry; Vaulted ceilings; One living area; One dining area
Neighborhood map
What this means for you Summary
Snapshot
- This is a 3-bed/3.0-bath single-family listed at $110k.
Deal economics
- At list price, monthly cash flow is $251 ($3k/yr) — positive.
- The deal already cash-flows at list — no discount required.
- Meets the 1% rule at list price ($1k rent vs $110k).
- Cap rate 9.0% vs local median 3.9% in Palestine — top-decile yield for the area; either an underpriced asset or a hidden risk that comps aren't pricing in. Stress-test before assuming the spread holds.
Location & tenants
- Location reads 66/100 on livability (#657 in TX) — a middle-class / working-renter tenant base. Strengths: cost of living A+, housing A+; Watch: crime D+, employment D, amenities F.
- Westwood ISD (town): math 28% / reading 29% proficiency, ranked #659 of 826 in TX (top 80%) — low school quality limits family demand, transient renter base, plan for 1-2y turnover.
- Zoned schools: Westwood El (math 24% / reading 25%, grade F, #3,052 of 4,322 statewide, top 74%, 408 students, 74% FRL) — zoned schools average 74% FRL vs 56% district-wide (18 pts higher); higher-poverty schools than district average — tighter screening recommended.
- Market conditions: 134 active listings in the ZIP; 29 units permitted in Anderson County in 2024 (0 in 5+ unit buildings).
Forward outlook
- Local home prices are declining (-3.0%/yr); year-one equity from $761 of loan paydown is wiped out by about $3k of value loss. Plan a longer hold.
- Anderson County population projected at +4% by 2050 — modest demand growth; plan on rents tracking national, not racing it.
Negotiation context
- Only 8 days on market — expect competitive offers; lowballing is unlikely to land.
Risks & watch-outs
- Watch-outs: property tax is 2.9% of price.
- Climate carrying-cost: major wind risk, 74% chance of damaging wind over 30y; extreme-heat days projected 7→26/yr by 2055 (HVAC capex compounding) — expect insurance premiums to compound above CPI over the hold.
Questions for the listing agent
- Built in 1978 — when were the roof, HVAC, electrical panel, plumbing, and water heater last replaced?
- Property tax is high relative to price — has the assessment been appealed recently, and will the sale trigger a re-assessment?
- Is there a deadline driving the sale (1031 exchange, divorce, estate, relocation)? That informs how much negotiation room exists.
- Schools are D-rated, which usually means shorter tenancies and higher turnover. Who's the typical renter profile here, and what's been the actual vacancy rate?
- Crime grade is D in this area — have there been break-ins, vandalism, or insurance claims at this property in the last 3 years? What carrier currently insures it and at what premium?
- What's the average days-on-market for RENTAL listings here right now (not sales)? A rising rental-DOM trend means longer vacancies and softer asking-rent achievability than the comps imply.
- What's the recent tenant-quality profile in this submarket — average credit score on applications, eviction rate, late-payment / NSF rate, and stable-employment percentage? A property-management company in the area should have these aggregated.
- How much new for-sale + rental construction is in the pipeline within 1–3 miles? Heavy new supply typically softens prices + rents 12–24 months out; constrained supply supports both.
Investment metrics
- 1% rule
- 1.31% ✓
- Cap rate
- 9.03%
- Cash-on-cash
- 9.78%
- DSCR
- 1.44
- GRM
- 6.3
CMA / ARV
- ARV (median comp)
- $170,345
- List price
- $110,000
- Delta
- -35.43%
- Verdict
- UNDERPRICED
- Comps
- 8 within 1.0 mi
Show comp detail 3 sales within ~0.75 mi
| Address | Dist | Beds/Ba | Sqft | Sold | Price | $/sf | Match |
|---|---|---|---|---|---|---|---|
| 206 Clover Ln | 0.00mi | 3/3.0 | 1,592 (0%) | 1mo | $110,000 | $69 | 99 |
| 307 Palm Dr | 0.23mi | 3/2.0 | 1,707 (+7%) | 17mo | $227,000 | $133 | 60 |
| 302 Blackjack Dr | 0.68mi | 3/2.0 | 1,682 (+6%) | 20mo | $167,000 | $99 | 38 |
Match score weights: distance 35% · size 25% · config 20% · recency 20%. Top-matched comps best support the ARV.
Projected returns pro-forma
-3.0% appreciation · 3.0% rent growth · sell at horizon
- IRR
- -1.5%
- Equity multiple
- 0.94×
- Total profit
- $-1,736
- Equity at exit
- $16,401
- IRR
- 8.3%
- Equity multiple
- 1.63×
- Total profit
- $19,486
- Equity at exit
- $9,511
Cash invested: $30,800 (down + closing). Projections, not guarantees.
Landlord ↔ Tenant lean methodology
- Overall (STATE)
- 87 Strongly Landlord-Friendly
- State Texas
- 87 Strongly Landlord-Friendly · R+5
- County
- — inherits STATE
- City
- — inherits STATE
ZIP-level market 75803
- Home prices YoY
- -34.0%
- Active inventory
- 134
- Price-to-rent
- 6.3×
Monthly cashflow live
- Estimated rent
- $1,444 medium interval (Pro) →
- Mortgage (P&I)
- −$577
- Tax from tax record
- −$267 /mo · $3,204/yr
- Insurance
- −$46
- HOA
- −$0
- Vacancy / Maint / Mgmt
- −$303
- Net cashflow
- $251
Break-even live
UW: 25.0% down · 7.5% · 30yr · 1.5% tax · 5.0% vac · 8.0% maint · 8.0% mgmt
Financing live
Cash to close
- Down payment
- $27,500
- Closing costs
- $3,300
- Reserves months
- —
- Total cash needed
- —
Loan-product check · same deal, 3 products live
Conventional
25% down · 7.5% · 30yr
- Down + closing
- —
- Monthly P&I
- —
- Monthly cashflow
- —
- DSCR
- —
- Eligible?
- —
Personal DTI + credit; lowest rate.
DSCR
20% down · 8.5% · 30yr
- Down + closing
- —
- Monthly P&I
- —
- Monthly cashflow
- —
- DSCR
- —
- Eligible?
- —
No personal income docs; deal must DSCR.
Hard money
10% down · 12.0% · 12mo
- Down + closing
- —
- Monthly P&I
- —
- Monthly cashflow
- —
- DSCR
- —
- Eligible?
- —
Short-term bridge; refi at stabilization.
Listing history 5 events
-
2026-05-12status Pending 470-char remark
-
2026-05-01$110,000 Active 470-char remark
-
2026-02-18soldstatus
-
2026-02-17soldstatus
-
1981-08-28soldstatus
ⓘ Source: listings_history table (triggers on properties + properties_extension) + one-shot
backfill from property_details.listing_events for pre-trigger history.
Tax reassessment forecast TX · Resets to sale price
- Current annual tax
- $3,204 · $267/mo
- Projected year-2 tax
- $3,204 · $267/mo
- Expected delta
- $0/yr ($0/mo · 0.0%)
ⓘ Screening estimate from a state-policy table — verify with the county assessor before closing.
Climate risk First Street
- Flood 1/10 Low FEMA zone X (unshaded) · 0% chance over 30 yrs
- Wildfire 3/10 Moderate
- Heat 7/10 Severe 7 d/yr ≥110°F today · 26 d/yr by 30 yrs out
- Wind 6/10 Major 74% chance of damaging wind over 30 yrs
- Air quality 1/10 Low 0 unhealthy d/yr today · 0 by 30 yrs out
Nearby sold comps map
Loading sold comps map…
Walkable amenities ~0.75 mi
Loading nearby amenities…
Taxation est. · year 1
- Rental income
- $17,327
- − Mortgage interest
- −$6,162
- − Property taxes
- −$3,204
- − Insurance
- −$550
- − Repairs & maintenance
- −$1,386
- − Management
- −$1,386
- − Depreciation
- −$3,200
- Taxable income
- $1,439
- Est. tax owed @ 24.0%
- −$345
- After-tax cash flow
- $2,667/yr
For passive investors: Depreciation is non-cash, so a rental often shows a tax loss while cash-flowing — sheltering income. Rental losses are passive: they offset passive income freely, and up to $25,000/yr can offset ordinary (W-2) income if you actively participate and your MAGI is under $100k (phasing out to $0 by $150k); unused losses carry forward. On sale, claimed depreciation is recaptured at up to 25%, and gains may owe capital-gains tax (a 1031 exchange can defer both). Figures are a year-1 estimate at your 24.0% rate — not tax advice; consult a CPA.
Schools (NCES district)
- District
- Westwood ISD
- NCES district ID
- 4843290
- Math proficiency
- 28% ▼ -8.00%
- Reading proficiency
- 29% ▼ -5.00%
- Median HH income
- $44,200
- Composite
- 24.41/100
- National rank
- #7684
- State rank
- #659 of 826 in TX
Livability — Palestine
- Score
- 66/100
- State rank
- #657
- US rank
- #12357
Category grades
Schools grade is shown separately in the Schools card above.
Census & demographics
- Census place
- Palestine, TX
- City population
- 17,531
- Population (ZIP)
- 21,390
Population outlook (Anderson County) Hauer SSP2
- Today (2025)
- 56,663 people
- By 2030
- 57,373 · +1.3%
- By 2040
- 58,960 · +4.1%
- By 2050
- 59,073 · +4.3%
- By 2075
- 53,737 · -5.2%
- By 2100
- 42,516 · -25.0%
Race, ethnicity, and origin ACS 2023
- Neighborhood character
- Diverse neighborhood (Simpson 0.60)
- Race & ethnicity
- White 57% Hispanic / Latino 24% Two or more races 17% Black 14%
- Hispanic origin (detail)
- Mexican 22%
- Common ancestry
- Romanian 1% Iranian 1% Slovak 1%
- Foreign-born
- 7% · Canada, Vietnam
- Languages at home
- 84% English-only · Spanish 14% German/W. Germanic 1% Other Indo-European 1%
Political lean MEDSL · Anderson
- 2024 margin
- Solid R (+61.8) · D 18.8% · R 80.6%
- 2008→2024 swing
- -18.3pp toward R · 2008: -43.5pp · 2024: -61.8pp
- All cycles
- 2024: R+61.8 2020: R+58.0 2016: R+58.1 2012: R+52.2 2008: R+43.5
Not yet ingested
- Civics
- —
Market trends
- HPI YoY
- ▼ -95.92%
- Current HPI
- 186.4885
- Rent YoY
- —
- Metro
- —
- State GDP YoY
- ▲ 3.95%
- F500 in state
- 110
Industry mix (Fortune 500 HQ in TX)
| Industry | F500 HQs | Revenue |
|---|---|---|
| Energy | 16 | $1,198B |
|
||
| Technology | 5 | $198B |
|
||
| Engineering / Construction | 4 | $72B |
|
||
| Energy Services | 3 | $60B |
|
||
| Utilities | 3 | $41B |
|
||
| Healthcare | 2 | $330B |
|
||
Price history
7 events — show timeline
- 2026-05-27 Sold (Public Records) — Public Records
- 2026-05-22 Sold (MLS) — NTREIS
- 2026-05-12 Pending — NTREIS
- 2026-05-01 Listed $110,000 NTREIS
- 2026-02-18 Sold (Public Records) — Public Records
- 2026-02-17 Sold (Public Records) — Public Records
- 1981-08-28 Sold (Public Records) — Public Records
Property tax history
+3.7%/yrLatest (2025): $3,204 · +1.5% YoY. Source: county tax records.
Cash-flow waterfall
monthlySold comps — $/sqft
last 12 mo · ≤1 miLoading sold comps…