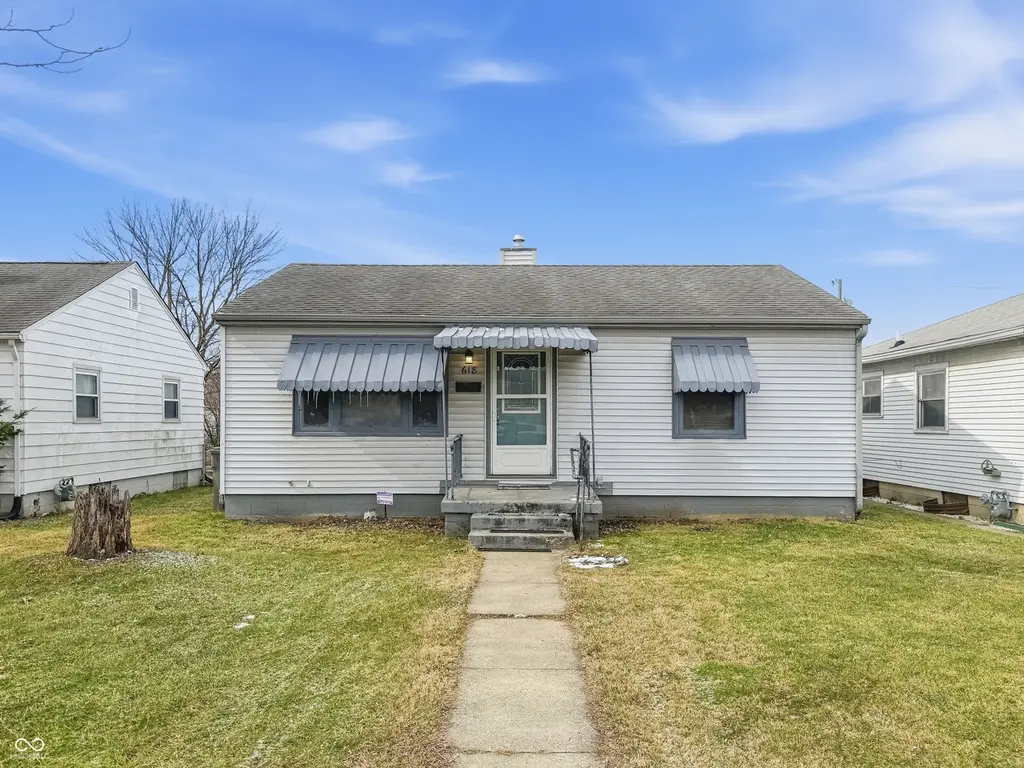
618 S Butler Ave · Indianapolis city (balance), IN
Flood risk 1/10 · Minimal
- FEMA flood zone
- X (unshaded)
- Chance of flooding over 30 yrs
- 0.0%
- Est. flood insurance / yr
- $473 – $860
Fire risk 1/10 · Minimal
- Est. fire insurance / yr
- $717 – $1,331
Heat risk 3/10 · Minor
- Hot days now (above 102°F)
- 7 days/yr
- Hot days in 30 yrs
- 19 days/yr
Wind risk 2/10 · Minimal
- Chance of severe wind over 30 yrs
- 1.0%
Air-quality risk 4/10 · Minor
- Unhealthy air days now
- 5 days/yr
- Unhealthy air days in 30 yrs
- 7 days/yr
Risk factors via First Street. Map © Google.
Why this score? — see what drove the C grade
The composite is a weighted blend of 9 inputs, each scored 0–100. Each bar is that input's sub-score; the figure is the points it added to the 100-point composite (weight × sub-score).
- Cash flow +21.5/30.0
- ARV discount +15.0/15.0
- DSCR +6.9/10.0
- 1% rule +4.5/10.0
- Rent growth +3.2/5.0
- Livability +2.5/5.0
- Condition / age +2.5/5.0
- Schools +1.4/10.0
- Appreciation +0.0/10.0
$109,000
🖨 Deal sheet 📄 Offer letter ✓ Due diligence
Listing remarks MLS
This charming cottage welcomes you with a warm, inviting feel that makes you feel right at home from the start. The easy, single-level layout offers comfortable living with just the right amount of space, perfect for both everyday life and relaxed evenings in. Homes with this kind of character and simplicity are hard to find and best appreciated in person. Built in 1949, this single-family cottage offers 825 square feet per county records and features a low-maintenance vinyl exterior with classic wood windows. Inside, you'll find two bedrooms and one full bathroom, providing a functional and cozy layout. A detached one-car garage along with an additional carport adds flexibility for parking and storage, rounding out this inviting home.
Key facts
- 6,229 sq ft lot
- Garage
- Built 1949
Neighborhood map
What this means for you Summary
Snapshot
- This is a 2-bed/1.0-bath single-family listed at $109k.
Deal economics
- At list price, monthly cash flow is $164 ($2k/yr) — positive.
- The deal already cash-flows at list — no discount required.
- To meet the 1% rule (rent ≥ 1% of price), the offer needs to be $103k (5.3% below list).
- Recommended offer: $99k (9.0% below list) — sets the bar for market timing.
- Cap rate 8.1% vs local median 4.4% in Indianapolis city (balance) — top-decile yield for the area; either an underpriced asset or a hidden risk that comps aren't pricing in. Stress-test before assuming the spread holds.
Location & tenants
- Location reads: area grade C — affects rentability + tenant quality, not the cash-flow math above.
- Indianapolis Public Schools (urban): math 14% / reading 20% proficiency, ranked #286 of 301 in IN (top 95%) — low school quality limits family demand, transient renter base, plan for 1-2y turnover; 77% free/reduced lunch — lower-income household profile, screen leases tightly.
- Market conditions: Rents rising (+2.6%/yr); 140 active listings in the ZIP; 40 comparable units currently listed for rent nearby; rentals at typical pace (median 24d on market — plan ~3-4 weeks tenant-placement turnaround); 40% of comp listings sitting > 30 days — soft ceiling on asking rent; 1,906 units permitted in Marion County in 2024 (621 in 5+ unit buildings).
Forward outlook
- Local home prices are declining (-3.0%/yr); year-one equity from $754 of loan paydown is wiped out by about $3k of value loss. Plan a longer hold.
- Marion County population projected at +18% by 2050 — long-run rental-demand tailwind backs the buy-and-hold thesis.
Negotiation context
- It's been on market 111 days — a 9% lower offer ($99k) is reasonable based on typical stale-listing flexibility.
- 2 sale attempts since 13y ago; this cycle's ask has dropped $20k (16%) from the opening price — seller is motivated, your offer sets the floor, not the list.
- Current owner paid $36k; list at $109k implies a 203% gain — meaningful room to come down on a strong offer.
Risks & watch-outs
- Watch-outs: built in 1949 — expect roof / HVAC / electrical / plumbing capex.
Questions for the listing agent
- It's been on market 111 days. Have you received any prior offers? Is the seller open to a 9% concession, seller financing, or rate buy-down credit?
- Built in 1949 — when were the roof, HVAC, electrical panel, plumbing, and water heater last replaced?
- Why hasn't it sold? Are there any deal-killer items the seller is aware of (foundation, flood, title, zoning, code violations)?
- Is there a deadline driving the sale (1031 exchange, divorce, estate, relocation)? That informs how much negotiation room exists.
- What's the average days-on-market for RENTAL listings here right now (not sales)? A rising rental-DOM trend means longer vacancies and softer asking-rent achievability than the comps imply.
- What's the recent tenant-quality profile in this submarket — average credit score on applications, eviction rate, late-payment / NSF rate, and stable-employment percentage? A property-management company in the area should have these aggregated.
- How much new for-sale + rental construction is in the pipeline within 1–3 miles? Heavy new supply typically softens prices + rents 12–24 months out; constrained supply supports both.
Investment metrics
- 1% rule
- 0.95% ✗
- Cap rate
- 8.09%
- Cash-on-cash
- 6.43%
- DSCR
- 1.29
- GRM
- 8.8
CMA / ARV
- ARV (median comp)
- $139,698
- List price
- $109,000
- Delta
- -21.97%
- Verdict
- UNDERPRICED
- Comps
- 20 within 1.0 mi
Show comp detail 12 sales within ~0.75 mi
| Address | Dist | Beds/Ba | Sqft | Sold | Price | $/sf | Match |
|---|---|---|---|---|---|---|---|
| 515 Clyde Ave | 0.30mi | 2/1.0 | 864 (+5%) | 3mo | $132,000 | $153 | 76 |
| 5502 Rawles Ter | 0.45mi | 2/1.0 | 823 (-0%) | 15mo | $178,000 | $216 | 67 |
| 710 S Bancroft St | 0.32mi | 3/1.0 (+1) | 864 (+5%) | 10mo | $158,000 | $183 | 64 |
| 5721 Shimer Ave | 0.54mi | 2/1.0 | 845 (+2%) | 15mo | $145,000 | $172 | 59 |
| 4721 E Morris St | 0.70mi | 2/1.0 | 840 (+2%) | 9mo | $165,000 | $196 | 57 |
| 4967 Diana Dr | 0.30mi | 3/1.0 (+1) | 896 (+9%) | 12mo | $172,000 | $192 | 57 |
| 5710 Shimer Ave | 0.51mi | 2/1.0 | 835 (+1%) | 21mo | $137,000 | $164 | 57 |
| 5919 Shimer Ave | 0.71mi | 2/1.0 | 894 (+8%) | 1mo | $118,000 | $132 | 52 |
| 5826 Greenfield Ave | 0.62mi | 2/1.0 | 725 (-12%) | 1mo | $155,000 | $214 | 50 |
| 545 Dayton Ave | 0.58mi | 3/1.0 (+1) | 896 (+9%) | 6mo | $101,000 | $113 | 48 |
| 332 Campus Ln | 0.41mi | 3/1.0 (+1) | 925 (+12%) | 11mo | $172,500 | $186 | 46 |
| 4648 Brookville Rd | 0.70mi | 3/2.0 (+1) | 936 (+14%) | 3mo | $189,900 | $203 | 34 |
Match score weights: distance 35% · size 25% · config 20% · recency 20%. Top-matched comps best support the ARV.
Projected returns pro-forma
-3.0% appreciation · 2.63% rent growth · sell at horizon
- IRR
- -6.8%
- Equity multiple
- 0.75×
- Total profit
- $-7,669
- Equity at exit
- $16,252
- IRR
- 2.3%
- Equity multiple
- 1.16×
- Total profit
- $4,994
- Equity at exit
- $9,424
Cash invested: $30,520 (down + closing). Projections, not guarantees.
Landlord ↔ Tenant lean methodology
- Overall (STATE)
- 90 Strongly Landlord-Friendly
- State Indiana
- 90 Strongly Landlord-Friendly · R+11
- County
- — inherits STATE
- City
- — inherits STATE
ZIP-level market 46219
- Rents YoY
- 2.6%
- Active inventory
- 140
- Price-to-rent
- 8.8×
Monthly cashflow live
- Estimated rent
- $1,032 high interval (Pro) →
- Mortgage (P&I)
- −$572
- Tax from tax record
- −$35 /mo · $415/yr
- Insurance
- −$45
- HOA
- −$0
- Vacancy / Maint / Mgmt
- −$217
- Net cashflow
- $164
Break-even live
UW: 25.0% down · 7.5% · 30yr · 1.5% tax · 5.0% vac · 8.0% maint · 8.0% mgmt
Financing live
Cash to close
- Down payment
- $27,250
- Closing costs
- $3,270
- Reserves months
- —
- Total cash needed
- —
Loan-product check · same deal, 3 products live
Conventional
25% down · 7.5% · 30yr
- Down + closing
- —
- Monthly P&I
- —
- Monthly cashflow
- —
- DSCR
- —
- Eligible?
- —
Personal DTI + credit; lowest rate.
DSCR
20% down · 8.5% · 30yr
- Down + closing
- —
- Monthly P&I
- —
- Monthly cashflow
- —
- DSCR
- —
- Eligible?
- —
No personal income docs; deal must DSCR.
Hard money
10% down · 12.0% · 12mo
- Down + closing
- —
- Monthly P&I
- —
- Monthly cashflow
- —
- DSCR
- —
- Eligible?
- —
Short-term bridge; refi at stabilization.
Rent comps 40 comps
| Address | Beds | Baths | Sqft | Rent | $/sqft | DOM | Units | Dist |
|---|---|---|---|---|---|---|---|---|
| 5131 E Burgess Ave Indianapolis, IN | 2.0 | 1.0 | 816 | $1,100 | $1.35 | 43d | 1 | 0.31mi |
| 750 S Dequincy St Indianapolis, IN | 3.0 | 1.5 | 936 | $1,500 | $1.60 | 43d | 1 | 0.45mi |
| 4919 Orion Ave Indianapolis, IN | 2.0 | 1.0 | 766 | $875 | $1.14 | 43d | 1 | 0.48mi |
| 528 S Bosart Ave Indianapolis, IN | 3.0 | 1.0 | 720 | $1,305 | $1.81 | 43d | 1 | 0.54mi |
| 25 S Emerson Ave Indianapolis, IN | 1.0 | 1.0 | 710 | $649 | $0.91 | 43d | 1 | 0.75mi |
| 5143 E Washington St Apt 101 Indianapolis, IN | 1.0 | 1.0 | 600 | $800 | $1.33 | 43d | 1 | 0.77mi |
| 5143 E Washington St Apt 102 Indianapolis, IN | 1.0 | 1.0 | 630 | $850 | $1.35 | 43d | 1 | 0.77mi |
| 4 N Butler Ave Unit 8 Indianapolis, IN | 2.0 | 1.0 | 850 | $800 | $0.94 | 43d | 1 | 0.80mi |
| 4 N Butler Ave Unit 11 Indianapolis, IN | 2.0 | 1.0 | 850 | $750 | $0.88 | 4d | 1 | 0.80mi |
| 5230 E Washington St Indianapolis, IN | 1.0 | 1.0 | 463 | $804 | $1.74 | 2d | 6 | 0.80mi |
| 5230 E Washington St Indianapolis, IN | 1.0 | 1.0 | 463 | $819 | $1.77 | 10d | 6 | 0.80mi |
| 5250 E Market St Unit 5252 Indianapolis, IN | 2.0 | 1.0 | 1000 | $1,350 | $1.35 | 14d | 1 | 0.86mi |
| 4926 E Washington St Apt 5 Indianapolis, IN | 1.0 | 1.0 | 700 | $895 | $1.28 | 43d | 1 | 0.87mi |
| 4831 E Washington St Unit 4 Indianapolis, IN | 2.0 | 2.0 | 1000 | $995 | $0.99 | 23d | 1 | 0.87mi |
| 4815 E Washington St Unit 4815-10 Indianapolis, IN | 1.0 | 1.0 | 600 | $950 | $1.58 | 21d | 1 | 0.88mi |
| 4815 E Washington St Unit 4815-12 Indianapolis, IN | 1.0 | 1.0 | 700 | $950 | $1.36 | 43d | 1 | 0.88mi |
| 4815 E Washington St Unit 4815-04 Indianapolis, IN | 1.0 | 1.0 | 600 | $895 | $1.49 | 43d | 1 | 0.88mi |
| 4741 E Washington St Indianapolis, IN | 1.0 | 1.0 | 700 | $950 | $1.36 | 21d | 1 | 0.91mi |
| 29 S Audubon Rd Indianapolis, IN | 1.0–2.0 | 1.0 | 670 | $989 | $1.48 | 14d | 5 | 0.92mi |
| 5703 E Washington St Indianapolis, IN | 2.0 | 1.0 | 628 | $1,025 | $1.63 | 3d | 3 | 0.93mi |
| 5730 E Washington St Indianapolis, IN | 1.0–2.0 | 1.0 | 556 | $865 | $1.55 | 13d | 4 | 1.00mi |
| 5819 E Washington St #13 Indianapolis, IN | 1.0 | 1.0 | 700 | $795 | $1.14 | 43d | 1 | 1.00mi |
| 5819 E Washington St #10 Indianapolis, IN | 1.0 | 1.0 | 550 | $715 | $1.30 | 43d | 1 | 1.00mi |
| 5901 E Washington St Apt 38 Indianapolis, IN | 1.0 | 1.0 | 670 | $949 | $1.42 | 2d | 1 | 1.07mi |
| 3906 Hoyt Ave Indianapolis, IN | 2.0 | 1.0 | 912 | $1,250 | $1.37 | 7d | 1 | 1.09mi |
| 5914 E Washington St Indianapolis, IN | 1.0 | 1.0 | 700 | $825 | $1.18 | 23d | 1 | 1.14mi |
| 508 Emerson Ave Indianapolis, IN | 3.0 | 1.5 | 1094 | $1,150 | $1.05 | 14d | 1 | 1.14mi |
| 508 N Emerson Ave Unit 506 Indianapolis, IN | 2.0 | 1.0 | 950 | $950 | $1.00 | 14d | 1 | 1.14mi |
| 4214 E Washington St Indianapolis, IN | 3.0 | 2.0 | 961 | $1,195 | $1.24 | 7d | 1 | 1.16mi |
| 137 S Catherwood Ave Indianapolis, IN | 3.0 | 2.0 | 1008 | $1,400 | $1.39 | 20d | 1 | 1.16mi |
| 137 S Catherwood Ave Indianapolis, IN | 3.0 | 1.5 | 1008 | $1,400 | $1.39 | 3d | 1 | 1.16mi |
| 19 S Webster Ave Indianapolis, IN | 1.0 | 1.0 | 700 | $799 | $1.14 | 43d | 1 | 1.19mi |
| 5056 Emerton Pl Unit 5056 Indianapolis, IN | 2.0 | 1.0 | 868 | $1,245 | $1.43 | 23d | 1 | 1.19mi |
| 5056 Emerton Pl Unit 5046 Indianapolis, IN | 2.0 | 1.5 | 1039 | $1,245 | $1.20 | 23d | 1 | 1.19mi |
| 15 S Webster Ave Indianapolis, IN | 1.0 | 1.0 | 650 | $799 | $1.23 | 4d | 1 | 1.19mi |
| 4114 E Washington St Indianapolis, IN | 2.0 | 1.0 | 909 | $1,100 | $1.21 | 44d | 1 | 1.20mi |
| 6052 E Washington St Unit B Indianapolis, IN | 1.0 | 1.0 | 600 | $575 | $0.96 | 23d | 1 | 1.25mi |
| 628 N Riley Ave Indianapolis, IN | 2.0 | 1.5 | 948 | $1,295 | $1.37 | 23d | 1 | 1.27mi |
| 5010 Emerton Pl Indianapolis, IN | 2.0 | 1.5 | 1002 | $1,095 | $1.09 | 43d | 1 | 1.28mi |
| 3706 Hoyt Ave Indianapolis, IN | 3.0 | 1.0 | 960 | $1,500 | $1.56 | 14d | 1 | 1.30mi |
Listing history 18 events
-
2026-06-18days on market $109,000 Active 111 DOM
-
2026-06-17days on market $109,000 Active 110 DOM
-
2026-06-16days on market $109,000 Active 109 DOM
-
2026-06-15days on market $109,000 Active 108 DOM
-
2026-06-13days on market $109,000 Active 106 DOM
-
2026-06-13pricedays on market $109,000 Active 105 DOM
-
2026-06-09days on market $119,000 Active 102 DOM
-
2026-06-08days on market $119,000 Active 101 DOM
-
2026-06-07days on market $119,000 Active 100 DOM
-
2026-06-03days on market $119,000 Active 96 DOM
-
2026-06-02days on market $119,000 Active 95 DOM
-
2026-06-01days on market $119,000 Active 94 DOM
-
2026-05-31days on market $119,000 Active 93 DOM
-
2026-05-08price $119,000 748-char remark
Show marketing remark (748 chars)
This charming cottage welcomes you with a warm, inviting feel that makes you feel right at home from the start. The easy, single-level layout offers comfortable living with just the right amount of space, perfect for both everyday life and relaxed evenings in. Homes with this kind of character and simplicity are hard to find and best appreciated in person. Built in 1949, this single-family cottage offers 825 square feet per county records and features a low-maintenance vinyl exterior with classic wood windows. Inside, you'll find two bedrooms and one full bathroom, providing a functional and cozy layout. A detached one-car garage along with an additional carport adds flexibility for parking and storage, rounding out this inviting home.
-
2026-02-27$129,000 Active 748-char remark
Show marketing remark (748 chars)
This charming cottage welcomes you with a warm, inviting feel that makes you feel right at home from the start. The easy, single-level layout offers comfortable living with just the right amount of space, perfect for both everyday life and relaxed evenings in. Homes with this kind of character and simplicity are hard to find and best appreciated in person. Built in 1949, this single-family cottage offers 825 square feet per county records and features a low-maintenance vinyl exterior with classic wood windows. Inside, you'll find two bedrooms and one full bathroom, providing a functional and cozy layout. A detached one-car garage along with an additional carport adds flexibility for parking and storage, rounding out this inviting home.
-
2013-09-18historical 496-char remark
Show marketing remark (496 chars)
Meticulously maintained bungalow style home in Warren Township. 2 Bedroom 1 Full Bath. You won't believe the space and storage this well maintained home has. Huge covered deck for entertaining and fully fenced backyard. Did I forget to mention the full basement. All rooms have ceiling fans. Home includes many updates, newer HVAC, Roof, H20 Heater, Humidifier on Furnace, New Carpet less than 1 year old, Laminate Flooring in Kitchen and Ceramic Tile in Entry and Updated Bath. Don't miss out!!
-
2013-08-28soldstatus $36,000 496-char remark
Show marketing remark (496 chars)
Meticulously maintained bungalow style home in Warren Township. 2 Bedroom 1 Full Bath. You won't believe the space and storage this well maintained home has. Huge covered deck for entertaining and fully fenced backyard. Did I forget to mention the full basement. All rooms have ceiling fans. Home includes many updates, newer HVAC, Roof, H20 Heater, Humidifier on Furnace, New Carpet less than 1 year old, Laminate Flooring in Kitchen and Ceramic Tile in Entry and Updated Bath. Don't miss out!!
-
2013-07-05$42,499 496-char remark
Show marketing remark (496 chars)
Meticulously maintained bungalow style home in Warren Township. 2 Bedroom 1 Full Bath. You won't believe the space and storage this well maintained home has. Huge covered deck for entertaining and fully fenced backyard. Did I forget to mention the full basement. All rooms have ceiling fans. Home includes many updates, newer HVAC, Roof, H20 Heater, Humidifier on Furnace, New Carpet less than 1 year old, Laminate Flooring in Kitchen and Ceramic Tile in Entry and Updated Bath. Don't miss out!!
ⓘ Source: listings_history table (triggers on properties + properties_extension) + one-shot
backfill from property_details.listing_events for pre-trigger history.
Tax reassessment forecast IN · Partial reset (capped growth)
- Current annual tax
- $415 · $35/mo
- Projected year-2 tax
- $671 · $56/mo
- Expected delta
- +$256/yr (+$21/mo · 61.5%)
ⓘ Screening estimate from a state-policy table — verify with the county assessor before closing.
Climate risk First Street
- Flood 1/10 Low FEMA zone X (unshaded) · 0% chance over 30 yrs
- Wildfire 1/10 Low
- Heat 3/10 Moderate 7 d/yr ≥102°F today · 19 d/yr by 30 yrs out
- Wind 2/10 Low 100% chance of damaging wind over 30 yrs
- Air quality 4/10 Moderate 5 unhealthy d/yr today · 7 by 30 yrs out
Nearby sold comps map
Loading sold comps map…
Walkable amenities ~0.75 mi
Loading nearby amenities…
Taxation est. · year 1
- Rental income
- $12,384
- − Mortgage interest
- −$6,106
- − Property taxes
- −$415
- − Insurance
- −$545
- − Repairs & maintenance
- −$991
- − Management
- −$991
- − Depreciation
- −$3,171
- Taxable income
- $166
- Est. tax owed @ 24.0%
- −$40
- After-tax cash flow
- $1,924/yr
For passive investors: Depreciation is non-cash, so a rental often shows a tax loss while cash-flowing — sheltering income. Rental losses are passive: they offset passive income freely, and up to $25,000/yr can offset ordinary (W-2) income if you actively participate and your MAGI is under $100k (phasing out to $0 by $150k); unused losses carry forward. On sale, claimed depreciation is recaptured at up to 25%, and gains may owe capital-gains tax (a 1031 exchange can defer both). Figures are a year-1 estimate at your 24.0% rate — not tax advice; consult a CPA.
Schools (NCES district)
- District
- Indianapolis Public Schools
- NCES district ID
- 1804770
- Math proficiency
- 14% ▼ -7.00%
- Reading proficiency
- 20% ▼ -3.00%
- Median HH income
- $32,034
- Composite
- 13.69/100
- National rank
- #9499
- State rank
- #286 of 301 in IN
Livability — Indianapolis city (balance)
No livability data for this city. (Only ~50 U.S. cities are tracked.)
Census & demographics
- Census place
- Indianapolis city (balance), IN
- County
- Marion County · 998,460 people
- City population
- 881,119
- Metro
- Indianapolis-Carmel-Anderson, IN
- Population (ZIP)
- 38,855
- Household income
- $60,803
- Rent vs Own
- Severe rent burden
- 2191.0
Population outlook (Marion County) Hauer SSP2
- Today (2025)
- 1,025,572 people
- By 2030
- 1,065,727 · +3.9%
- By 2040
- 1,141,577 · +11.3%
- By 2050
- 1,208,920 · +17.9%
- By 2075
- 1,367,288 · +33.3%
- By 2100
- 1,438,201 · +40.2%
Race, ethnicity, and origin ACS 2023
- Neighborhood character
- Diverse neighborhood (Simpson 0.63)
- Race & ethnicity
- White 54% Black 22% Hispanic / Latino 18% Two or more races 9%
- Hispanic origin (detail)
- Mexican 10% Puerto Rican 1%
- Common ancestry
- Slovak 2% Romanian 2% Lithuanian 2%
- Foreign-born
- 10% · Canada
- Languages at home
- 85% English-only · Spanish 14%
Political lean MEDSL · Marion
- 2024 margin
- Strong D (+27.7) · D 63.0% · R 35.3% · Other 1.7%
- 2008→2024 swing
- -0.7pp no change · 2008: 28.4pp · 2024: 27.7pp
- All cycles
- 2024: D+27.7 2020: D+29.1 2016: D+22.8 2012: D+22.2 2008: D+28.4
Not yet ingested
- Civics
- —
Market trends
- HPI YoY
- ▼ -199.69%
- Current HPI
- 289.8788
- Rent YoY
- ▲ 2.63%
- Metro
- Indianapolis-Carmel-Anderson, IN
- State GDP YoY
- ▲ 2.90%
- F500 in state
- 18
Industry mix (Fortune 500 HQ in IN)
| Industry | F500 HQs | Revenue |
|---|---|---|
| Industrial Machinery | 2 | $37B |
|
||
| Healthcare | 1 | $177B |
|
||
| Pharmaceuticals | 1 | $45B |
|
||
| Metals / Steel | 1 | $18B |
|
||
| Agriculture | 1 | $17B |
|
||
| Packaging | 1 | $12B |
|
||
Price history
+180.0% since first listed5 events — show timeline
- 2026-05-08 Price Changed $119,000 MIBOR as Distributed by MLS Grid
- 2026-02-27 Listed $129,000 MIBOR as Distributed by MLS Grid
- 2013-09-18 Listing Removed — MIBOR as Distributed by MLS Grid
- 2013-08-28 Sold (MLS) $36,000 MIBOR as Distributed by MLS Grid
- 2013-07-05 Listed $42,499 MIBOR as Distributed by MLS Grid
Property tax history
+6.1%/yrLatest (2025): $415 · -10.7% YoY. Source: county tax records.
Cash-flow waterfall
monthlySold comps — $/sqft
last 12 mo · ≤1 miLoading sold comps…