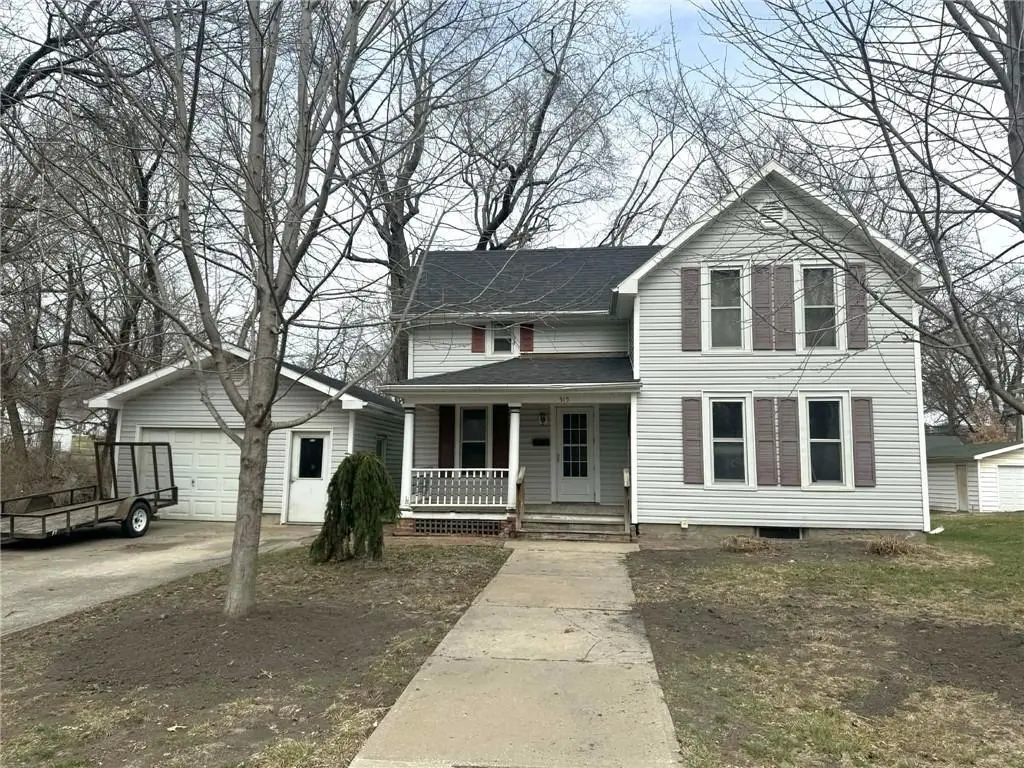
515 W 2nd St · Maryville, MO
Flood risk 1/10 · Minimal
- FEMA flood zone
- X (unshaded)
- Chance of flooding over 30 yrs
- 0.0%
- Est. flood insurance / yr
- $507 – $1,088
Fire risk 2/10 · Minimal
- Est. fire insurance / yr
- $1,054 – $1,958
Heat risk 3/10 · Minor
- Hot days now (above 105°F)
- 7 days/yr
- Hot days in 30 yrs
- 15 days/yr
Wind risk 2/10 · Minimal
- Chance of severe wind over 30 yrs
- —
Air-quality risk 2/10 · Minimal
- Unhealthy air days now
- 1 days/yr
- Unhealthy air days in 30 yrs
- 1 days/yr
Risk factors via First Street. Map © Google.
Why this score? — see what drove the C+ grade
The composite is a weighted blend of 9 inputs, each scored 0–100. Each bar is that input's sub-score; the figure is the points it added to the 100-point composite (weight × sub-score).
- Cash flow +26.8/30.0
- DSCR +9.2/10.0
- ARV discount +7.5/15.0
- 1% rule +6.7/10.0
- Livability +4.0/5.0
- Schools +3.9/10.0
- Rent growth +2.5/5.0
- Condition / age +2.5/5.0
- Appreciation +0.0/10.0
$99,500
🖨 Deal sheet (PDF) 📄 Offer letter ✓ Due diligence
Listing remarks
Charming 4-bedroom, 1.5-bath home perfect for students or first-time buyers! Features a newer furnace, quiet neighborhood, and versatile 1.5-story layout. Enjoy the oversized 1-car garage with concrete floor, providing plenty of storage and workspace. Full of potential—don’t miss this starter home opportunity!
Key facts
- Versatile layout
- Newer furnace
- Plenty of storage
Tags
Property features AI
Finance
- HOA & community: No association fees
Exterior
- Parking: Detached garage with garage door opener (1 car)
- Utilities: Public water; Public sewer
- Home design: Single-family residence; 1.5 stories; Residential property
- Construction: Frame construction with vinyl siding; Composition roof
- Exterior features: Deck; Porch
Interior
- Kitchen: Refrigerator; Electric range
- Bedrooms: 4 bedrooms (some on the first level and some on the second level)
- Flooring: Carpet; Luxury vinyl
- Bathrooms: 1 full bath; 1 half bath
- Heating & cooling: Forced air heating; Electric cooling
- Interior features: Eat-in kitchen
- Laundry & utility: Laundry on the main level
Neighborhood map
What this means for you Summary
Snapshot
- This is a 4-bed/1.5-bath other listed at $100k.
Deal economics
- At list price, monthly cash flow is $273 ($3k/yr) — positive.
- The deal already cash-flows at list — no discount required.
- Meets the 1% rule at list price ($1k rent vs $100k).
- Recommended offer: $97k (3.0% below list) — sets the bar for market timing.
- Cap rate 9.6% vs local median 4.2% in Maryville — top-decile yield for the area; either an underpriced asset or a hidden risk that comps aren't pricing in. Stress-test before assuming the spread holds.
Location & tenants
- Location reads 79/100 on livability (#23 in MO, #2,122 nationally) — a middle-class / working-renter tenant base. Strengths: cost of living A+, health & safety A+, housing B+; Watch: employment D, commute F.
- Maryville R-II (town): math 42% / reading 53% proficiency, ranked #79 of 324 in MO (top 24%) — families likely to look elsewhere, expect single-tenant / working-renter base with shorter leases.
- Zoned schools: Eugene Field Elem. (math 47% / reading 52%, grade D, #284 of 1,115 statewide, top 30%, 318 students, 52% FRL); Maryville Middle (math 41% / reading 50%, grade D+, #105 of 391 statewide, top 27%, 442 students, 40% FRL); Maryville High (math 42% / reading 72%, grade C, #51 of 521 statewide, top 11%, 506 students, 31% FRL) — zoned schools average 41% FRL vs 25% district-wide (16 pts higher); higher-poverty schools than district average — tighter screening recommended.
- Market conditions: 134 active listings in the ZIP; 49 units permitted in Nodaway County in 2024 (0 in 5+ unit buildings).
Forward outlook
- Local home prices are declining (-3.0%/yr); year-one equity from $688 of loan paydown is wiped out by about $3k of value loss. Plan a longer hold.
- Nodaway County population projected at -13% by 2050 — secular population decline; favor cash flow + early exit over multi-decade hold.
- At projected returns (-3.0% appreciation + 3.0% rent growth), your $28k cash investment doubles in ~10 years — after that, you're playing with house money.
Negotiation context
- It's been on market 35 days — a 3% lower offer ($97k) is reasonable based on typical stale-listing flexibility.
- 2 sale attempts with the ask held roughly flat each time — persistent listings suggest the price (not the market) is what's stuck; bring a comps-based counter.
Risks & watch-outs
- Watch-outs: built in 1890 — expect roof / HVAC / electrical / plumbing capex.
Questions for the listing agent
- It's been on market 35 days. Have you received any prior offers? Is the seller open to a 3% concession, seller financing, or rate buy-down credit?
- Built in 1890 — when were the roof, HVAC, electrical panel, plumbing, and water heater last replaced?
- Is there a deadline driving the sale (1031 exchange, divorce, estate, relocation)? That informs how much negotiation room exists.
- Schools are B-rated — typically a magnet for longer-tenancy family renters. What's the average tenant stay here, and is there a school-zone premium baked into asking?
- What's the average days-on-market for RENTAL listings here right now (not sales)? A rising rental-DOM trend means longer vacancies and softer asking-rent achievability than the comps imply.
- What's the recent tenant-quality profile in this submarket — average credit score on applications, eviction rate, late-payment / NSF rate, and stable-employment percentage? A property-management company in the area should have these aggregated.
- How much new for-sale + rental construction is in the pipeline within 1–3 miles? Heavy new supply typically softens prices + rents 12–24 months out; constrained supply supports both.
Investment metrics
- 1% rule
- 1.17% ✓
- Cap rate
- 9.58%
- Cash-on-cash
- 11.74%
- DSCR
- 1.52
- GRM
- 7.1
CMA / ARV
No comps found within radius.
Projected returns pro-forma
-3.0% appreciation · 3.0% rent growth · sell at horizon
- IRR
- 1.2%
- Equity multiple
- 1.04×
- Total profit
- $1,233
- Equity at exit
- $14,836
- IRR
- 10.8%
- Equity multiple
- 1.84×
- Total profit
- $23,404
- Equity at exit
- $8,603
Cash invested: $27,860 (down + closing). Projections, not guarantees.
Landlord ↔ Tenant lean methodology
- Overall (STATE)
- 81 Strongly Landlord-Friendly
- State Missouri
- 81 Strongly Landlord-Friendly · R+10
- County
- — inherits STATE
- City
- — inherits STATE
ZIP-level market 64468
- Home prices YoY
- -25.4%
- Active inventory
- 134
- Price-to-rent
- 7.1×
Monthly cashflow live
- Estimated rent
- $1,166 medium interval (Pro) →
- Mortgage (P&I)
- −$522
- Tax from tax record
- −$85 /mo · $1,023/yr
- Insurance
- −$41
- HOA
- −$0
- Vacancy / Maint / Mgmt
- −$245
- Net cashflow
- $273
Break-even live
Sensitivity live
| Price | -10% $329 | -5% $301 | +0% $273 | +5% $244 | +10% $216 |
|---|---|---|---|---|---|
| Rent | -10% $180 | -5% $227 | +0% $273 | +5% $319 | +10% $365 |
| Rate | -1.0pp $323 | -0.5pp $298 | base $273 | +0.5pp $247 | +1.0pp $221 |
UW: 25.0% down · 7.5% · 30yr · 1.5% tax · 5.0% vac · 8.0% maint · 8.0% mgmt
Financing live
Cash to close
- Down payment
- $24,875
- Closing costs
- $2,985
- Reserves months
- —
- Total cash needed
- —
Loan-product check · same deal, 3 products live
Conventional
25% down · 7.5% · 30yr
- Down + closing
- —
- Monthly P&I
- —
- Monthly cashflow
- —
- DSCR
- —
- Eligible?
- —
Personal DTI + credit; lowest rate.
DSCR
20% down · 8.5% · 30yr
- Down + closing
- —
- Monthly P&I
- —
- Monthly cashflow
- —
- DSCR
- —
- Eligible?
- —
No personal income docs; deal must DSCR.
Hard money
10% down · 12.0% · 12mo
- Down + closing
- —
- Monthly P&I
- —
- Monthly cashflow
- —
- DSCR
- —
- Eligible?
- —
Short-term bridge; refi at stabilization.
Listing history 4 events
-
2026-05-06status Pending
-
2026-04-27status Active
-
2026-04-18status Pending
-
2026-03-23$99,500 Active
ⓘ Source: listings_history table (triggers on properties + properties_extension) + one-shot
backfill from property_details.listing_events for pre-trigger history.
Tax reassessment forecast MO · Resets to sale price
- Current annual tax
- $1,023 · $85/mo
- Projected year-2 tax
- $1,023 · $85/mo
- Expected delta
- $0/yr ($0/mo · 0.0%)
ⓘ Screening estimate from a state-policy table — verify with the county assessor before closing.
Climate risk First Street
- Flood 1/10 Low FEMA zone X (unshaded) · 0% chance over 30 yrs
- Wildfire 2/10 Low
- Heat 3/10 Moderate 7 d/yr ≥105°F today · 15 d/yr by 30 yrs out
- Wind 2/10 Low
- Air quality 2/10 Low 1 unhealthy d/yr today · 1 by 30 yrs out
Nearby sold comps map
Loading sold comps map…
Walkable amenities ~0.75 mi
Loading nearby amenities…
Taxation est. · year 1
- Rental income
- $13,992
- − Mortgage interest
- −$5,574
- − Property taxes
- −$1,023
- − Insurance
- −$498
- − Repairs & maintenance
- −$1,119
- − Management
- −$1,119
- − Depreciation
- −$2,895
- Taxable income
- $1,764
- Est. tax owed @ 24.0%
- −$423
- After-tax cash flow
- $2,848/yr
For passive investors: Depreciation is non-cash, so a rental often shows a tax loss while cash-flowing — sheltering income. Rental losses are passive: they offset passive income freely, and up to $25,000/yr can offset ordinary (W-2) income if you actively participate and your MAGI is under $100k (phasing out to $0 by $150k); unused losses carry forward. On sale, claimed depreciation is recaptured at up to 25%, and gains may owe capital-gains tax (a 1031 exchange can defer both). Figures are a year-1 estimate at your 24.0% rate — not tax advice; consult a CPA.
Schools (NCES district)
- District
- Maryville R-II
- NCES district ID
- 2920490
- Math proficiency
- 42% ▼ -5.00%
- Reading proficiency
- 53% ▼ -2.00%
- Median HH income
- $35,045
- Composite
- 39.24/100
- National rank
- #4005
- State rank
- #79 of 324 in MO
Livability — Maryville
- Score
- 79/100
- State rank
- #23
- US rank
- #2122
Category grades
Schools grade is shown separately in the Schools card above.
Census & demographics
- Census place
- Maryville, MO
- City population
- 14,315
- Population (ZIP)
- 14,315
Population outlook (Nodaway County) Hauer SSP2
- Today (2025)
- 22,010 people
- By 2030
- 21,531 · -2.2%
- By 2040
- 20,360 · -7.5%
- By 2050
- 19,210 · -12.7%
- By 2075
- 17,711 · -19.5%
- By 2100
- 16,796 · -23.7%
Race, ethnicity, and origin ACS 2023
- Neighborhood character
- Predominantly White (90%)
- Race & ethnicity
- White 90% Black 3% Hispanic / Latino 3% Two or more races 2% Asian 2%
- Common ancestry
- Slovak 3% Italian 3% Lithuanian 2%
- Foreign-born
- 3% · Canada
- Languages at home
- 97% English-only · Spanish 1% Other Asian/Pacific 1% German/W. Germanic 0%
Political lean MEDSL · Nodaway
- 2024 margin
- Solid R (+43.7) · D 27.6% · R 71.4% · Other 1.0%
- 2008→2024 swing
- -33.2pp toward R · 2008: -10.5pp · 2024: -43.7pp
- All cycles
- 2024: R+43.7 2020: R+40.5 2016: R+40.8 2012: R+27.0 2008: R+10.5
Not yet ingested
- Civics
- —
Market trends
- HPI YoY
- ▼ -65.91%
- Current HPI
- 193.2735
- Rent YoY
- —
- Metro
- —
- State GDP YoY
- ▲ 1.84%
- F500 in state
- 20
Industry mix (Fortune 500 HQ in MO)
| Industry | F500 HQs | Revenue |
|---|---|---|
| Healthcare | 1 | $163B |
|
||
| Insurance | 1 | $21B |
|
||
| Industrial Technology | 1 | $17B |
|
||
| Retail | 1 | $16B |
|
||
| Industrial Distribution | 1 | $10B |
|
||
| Utilities | 1 | $9B |
|
||
Price history
4 events — show timeline
- 2026-05-06 Pending — Heartland MLS as Distributed by MLS Grid
- 2026-04-27 Relisted — Heartland MLS as Distributed by MLS Grid
- 2026-04-18 Pending — Heartland MLS as Distributed by MLS Grid
- 2026-03-23 Listed $99,500 Heartland MLS as Distributed by MLS Grid
Property tax history
+1.4%/yrLatest (2025): $1,023 · +3.0% YoY. Source: county tax records.
Cash-flow waterfall
monthlySold comps — $/sqft
last 12 mo · ≤1 miLoading sold comps…