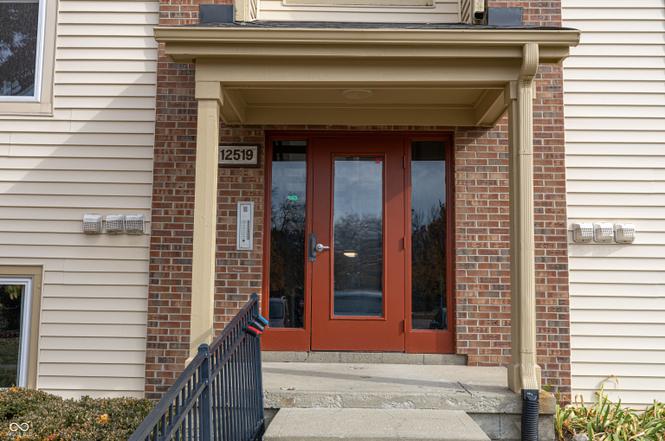
12519 Timber Creek Dr #6 · Carmel, IN
Flood risk 1/10 · Minimal
- FEMA flood zone
- X (unshaded)
- Chance of flooding over 30 yrs
- 0.0%
- Est. flood insurance / yr
- $507 – $1,088
Fire risk 1/10 · Minimal
- Est. fire insurance / yr
- $717 – $1,331
Heat risk 4/10 · Minor
- Hot days now (above 101°F)
- 7 days/yr
- Hot days in 30 yrs
- 18 days/yr
Wind risk 2/10 · Minimal
- Chance of severe wind over 30 yrs
- 0.0%
Air-quality risk 4/10 · Minor
- Unhealthy air days now
- 3 days/yr
- Unhealthy air days in 30 yrs
- 5 days/yr
Risk factors via First Street. Map © Google.
Why this score? — see what drove the D+ grade
The composite is a weighted blend of 9 inputs, each scored 0–100. Each bar is that input's sub-score; the figure is the points it added to the 100-point composite (weight × sub-score).
- Cash flow +15.8/30.0
- ARV discount +7.5/15.0
- Schools +6.4/10.0
- DSCR +4.9/10.0
- 1% rule +4.4/10.0
- Livability +4.2/5.0
- Rent growth +4.1/5.0
- Condition / age +2.5/5.0
- Appreciation +0.0/10.0
$245,000
🖨 Deal sheet 📄 Offer letter ✓ Due diligence
Listing remarks MLS
Move in ready condo in popular Carmel location. Walking distance to Carmel Arts District & Palladium. This second floor unit includes a fantastic deck overlooking the neighborhood pond. Brand new carpet throughout, SS appliances, and two spacious bedrooms with walk-in closets. Neighborhood features pool and tennis courts. Unit includes one car garage, additional parking space and storage room. Come see today!
Key facts
- Kitchen bar
- Serene water view
- Balcony
Tags
Neighborhood map
What this means for you Summary
Snapshot
- This is a 3-bed/2.0-bath condo listed at $245k.
Deal economics
- At list price, monthly cash flow is $110 ($1k/yr) — positive.
- The deal already cash-flows at list — no discount required.
- To meet the 1% rule (rent ≥ 1% of price), the offer needs to be $229k (6.3% below list).
- Recommended offer: $216k (12.0% below list) — sets the bar for market timing.
- Cap rate 6.8% vs local median 2.7% in Carmel — top-decile yield for the area; either an underpriced asset or a hidden risk that comps aren't pricing in. Stress-test before assuming the spread holds.
Location & tenants
- Location reads 84/100 on livability (#7 in IN, #726 nationally) — a professional / high-income tenant draw. Strengths: crime A+, amenities A+, employment A+; Watch: commute F.
- Carmel Clay Schools (urban): math 68% / reading 70% proficiency, ranked #1 of 301 in IN (top 0%) — acceptable for families but not a draw, mixed tenant base, ~2y average lease; only 7% free/reduced lunch — higher-income household profile.
- Zoned schools: Carmel High School (math 77% / reading 90%, grade A, #3 of 369 statewide, top 1%, 5,192 students, 13% FRL).
- Zoned-school proficiency averages 84% at this address vs 69% district-wide (+14 pts) — the actual schools serving this property are materially stronger than the Carmel Clay Schools average implies; a family-tenant draw the district grade alone would hide.
- Market conditions: Rents rising fast (+6.5%/yr); 340 active listings in the ZIP; 35 comparable units currently listed for rent nearby; rentals leasing fast (median 2d on market — plan ~1-2 weeks tenant-placement turnaround); high-income renter base; 4,661 units permitted in Hamilton County in 2024 (1,528 in 5+ unit buildings).
Forward outlook
- Local home prices are declining (-3.0%/yr); year-one equity from $2k of loan paydown is wiped out by about $7k of value loss. Plan a longer hold.
- Hamilton County population projected at +44% by 2050 — long-run rental-demand tailwind backs the buy-and-hold thesis.
Negotiation context
- It's been on market 140 days — a 12% lower offer ($216k) is reasonable based on typical stale-listing flexibility.
- 6 sale attempts since 25y ago; this cycle's ask has dropped $32k (12%) from the opening price — seller is motivated, your offer sets the floor, not the list.
- Current owner paid $190k; 29% above their basis — modest negotiation headroom, anchor on the comps not their cost.
Questions for the listing agent
- It's been on market 140 days. Have you received any prior offers? Is the seller open to a 12% concession, seller financing, or rate buy-down credit?
- What does the HOA fee cover, when was the last increase, and are there any pending special assessments or reserve-fund shortfalls?
- Any open or pending special assessments — roof, HVAC, plumbing, elevator, façade? What's the per-unit balance and payoff schedule, and is the seller paying it off at close or rolling it to the buyer?
- Why hasn't it sold? Are there any deal-killer items the seller is aware of (foundation, flood, title, zoning, code violations)?
- Is there a deadline driving the sale (1031 exchange, divorce, estate, relocation)? That informs how much negotiation room exists.
- Schools are A-rated — typically a magnet for longer-tenancy family renters. What's the average tenant stay here, and is there a school-zone premium baked into asking?
- The area grade is low — what's the realistic commute time and amenity access for the typical tenant pool here? Any planned neighborhood developments (good or bad) we should know about?
- What's the average days-on-market for RENTAL listings here right now (not sales)? A rising rental-DOM trend means longer vacancies and softer asking-rent achievability than the comps imply.
- What's the recent tenant-quality profile in this submarket — average credit score on applications, eviction rate, late-payment / NSF rate, and stable-employment percentage? A property-management company in the area should have these aggregated.
- How much new apartment / multifamily construction is in the pipeline within 1–3 miles? Heavy new supply (>2% of stock underway) typically softens rents 12–24 months out; light construction supports rent growth.
Investment metrics
- 1% rule
- 0.94% ✗
- Cap rate
- 6.83%
- Cash-on-cash
- 1.93%
- DSCR
- 1.09
- GRM
- 8.9
CMA / ARV
No comps found within radius.
Projected returns pro-forma
-3.0% appreciation · 6.47% rent growth · sell at horizon
- IRR
- -9.4%
- Equity multiple
- 0.64×
- Total profit
- $-24,355
- Equity at exit
- $36,530
- IRR
- 4.2%
- Equity multiple
- 1.36×
- Total profit
- $24,526
- Equity at exit
- $21,183
Cash invested: $68,600 (down + closing). Projections, not guarantees.
Landlord ↔ Tenant lean methodology
- Overall (STATE)
- 90 Strongly Landlord-Friendly
- State Indiana
- 90 Strongly Landlord-Friendly · R+11
- County
- — inherits STATE
- City
- — inherits STATE
ZIP-level market 46032
- Rents YoY
- 6.5%
- Active inventory
- 340
- Price-to-rent
- 8.9×
Monthly cashflow live
- Estimated rent
- $2,295 high interval (Pro) →
- Mortgage (P&I)
- −$1,285
- Tax from tax record
- −$116 /mo · $1,387/yr
- Insurance
- −$102
- HOA
- −$200
- Vacancy / Maint / Mgmt
- −$482
- Net cashflow
- $110
Break-even live
UW: 25.0% down · 7.5% · 30yr · 1.5% tax · 5.0% vac · 8.0% maint · 8.0% mgmt
Financing live
Cash to close
- Down payment
- $61,250
- Closing costs
- $7,350
- Reserves months
- —
- Total cash needed
- —
Loan-product check · same deal, 3 products live
Conventional
25% down · 7.5% · 30yr
- Down + closing
- —
- Monthly P&I
- —
- Monthly cashflow
- —
- DSCR
- —
- Eligible?
- —
Personal DTI + credit; lowest rate.
DSCR
20% down · 8.5% · 30yr
- Down + closing
- —
- Monthly P&I
- —
- Monthly cashflow
- —
- DSCR
- —
- Eligible?
- —
No personal income docs; deal must DSCR.
Hard money
10% down · 12.0% · 12mo
- Down + closing
- —
- Monthly P&I
- —
- Monthly cashflow
- —
- DSCR
- —
- Eligible?
- —
Short-term bridge; refi at stabilization.
Rent comps 35 comps
| Address | Beds | Baths | Sqft | Rent | $/sqft | DOM | Units | Dist |
|---|---|---|---|---|---|---|---|---|
| 1059 Timber Creek Dr Carmel, IN | 3.0 | 2.0 | 1379 | $1,850 | $1.34 | 43d | 1 | 0.09mi |
| 12484 Breaklines St Carmel, IN | 1.0–3.0 | 1.0–2.0 | 1045 | $2,044 | $1.96 | 1d | 19 | 0.11mi |
| 675 Beacon St Carmel, IN | 1.0–2.0 | 1.0–2.0 | 991 | $2,395 | $2.42 | 1d | 18 | 0.26mi |
| 358 Dartmouth St Carmel, IN | 2.0 | 2.0 | 1188 | $2,095 | $1.76 | 2d | 1 | 0.31mi |
| 301 American Way N Carmel, IN | 1.0–3.0 | 1.0–2.0 | 1167 | $2,980 | $2.55 | 1d | 1 | 0.44mi |
| 881 3rd Ave SW Carmel, IN | 1.0–2.0 | 1.0–2.0 | 1135 | $1,999 | $1.76 | 1d | 2 | 0.49mi |
| 300 Providence Blvd Carmel, IN | 1.0–2.0 | 1.0–2.5 | 990 | $2,019 | $2.04 | 1d | 35 | 0.52mi |
| 947 Wickham Ct #206 Carmel, IN | 2.0 | 2.0 | 1072 | $1,650 | $1.54 | 2d | 1 | 0.53mi |
| 400 Industrial Dr Carmel, IN | 1.0–2.0 | 1.0–2.5 | 1175 | $3,570 | $3.04 | 1d | 59 | 0.57mi |
| 880 Monon Green Blvd Carmel, IN | 3.0 | 1.0–2.0 | 1044 | $3,235 | $3.10 | 43d | 5 | 0.58mi |
| 750 Veterans Way Carmel, IN | 1.0–3.0 | 1.0–2.5 | 1144 | $4,282 | $3.74 | 1d | 1 | 0.61mi |
| 833 W Main St Carmel, IN | 1.0–2.0 | 1.0–2.0 | 1304 | $3,485 | $2.67 | 7d | 23 | 0.62mi |
| 591 Monon Blvd Carmel, IN | 3.0 | 1.0–2.0 | 791 | $2,951 | $3.73 | 1d | 24 | 0.65mi |
| 720 S Rangeline Rd Carmel, IN | 1.0–2.0 | 1.0–2.0 | 1090 | $3,345 | $3.07 | 1d | 1 | 0.68mi |
| 1111 W Main St Carmel, IN | 1.0–2.0 | 1.0–2.0 | 932 | $3,224 | $3.46 | 1d | 8 | 0.73mi |
| 530 W Main St Carmel, IN | 2.0 | 1.0–1.5 | 875 | $1,412 | $1.61 | 1d | 1 | 0.73mi |
| 760 Walkabout Cir E Carmel, IN | 2.0 | 2.0 | 569 | $2,224 | $3.91 | 1d | 24 | 0.77mi |
| 1225 Veterans Way Carmel, IN | 1.0–2.0 | 1.0–2.0 | 1006 | $2,483 | $2.47 | 1d | 10 | 0.79mi |
| 12415 N Pennsylvania St Carmel, IN | 1.0–2.0 | 1.0–2.0 | 940 | $1,824 | $1.94 | 1d | 21 | 0.79mi |
| 25 Florence St Carmel, IN | 2.0 | 2.5 | 1338 | $2,249 | $1.68 | 10d | 1 | 0.85mi |
| 110 W Main St Carmel, IN | 1.0–3.0 | 1.0–3.0 | 1095 | $3,868 | $3.53 | 1d | 16 | 0.88mi |
| 231 Lark Dr #3 Carmel, IN | 2.0 | 1.0 | 925 | $1,195 | $1.29 | 1d | 1 | 0.92mi |
| 110 Bryn Mawr Ln Unit 221-03 Carmel, IN | 2.0 | 1.5 | 876 | $1,499 | $1.71 | 20d | 1 | 1.01mi |
| 110 Bryn Mawr Ln Unit 221-08 Carmel, IN | 2.0 | 1.5 | 876 | $1,499 | $1.71 | 1d | 1 | 1.01mi |
| 110 Bryn Mawr Ln Unit 220-06 Carmel, IN | 2.0 | 2.0 | 876 | $1,499 | $1.71 | 1d | 1 | 1.01mi |
| 110 Bryn Mawr Ln Unit 220-03 Carmel, IN | 2.0 | 2.0 | 876 | $1,429 | $1.63 | 1d | 1 | 1.01mi |
| 110 Bryn Mawr Ln Unit T-203 Carmel, IN | 3.0 | 1.5 | 1280 | $2,199 | $1.72 | 7d | 1 | 1.01mi |
| 221 E Main St Carmel, IN | 1.0–3.0 | 1.0–2.0 | 1010 | $2,099 | $2.08 | 1d | 8 | 1.04mi |
| 1685 E 116th St Carmel, IN | 2.0 | 1.0–2.0 | 892 | $2,475 | $2.77 | 1d | 28 | 1.11mi |
| 11405 Central Dr W Carmel, IN | 4.0 | 2.0 | 1408 | $2,600 | $1.85 | 1d | 1 | 1.17mi |
| 13415 Highpointe Blvd Carmel, IN | 1.0–2.0 | 1.0–2.0 | 728 | $1,518 | $2.08 | 1d | 14 | 1.21mi |
| 1825 Jefferson Dr W Carmel, IN | 1.0–3.0 | 1.0–2.5 | 1350 | $2,570 | $1.90 | 1d | 24 | 1.23mi |
| 741 N Rangeline Rd Carmel, IN | 2.0 | 1.0 | 850 | $1,275 | $1.50 | 1d | 1 | 1.30mi |
| 525 End DR Carmel, IN | 1.0–2.0 | 1.0–2.0 | 955 | $2,380 | $2.49 | 1d | 13 | 1.33mi |
| 945 Mohawk Hills Dr Carmel, IN | 1.0–3.0 | 1.0–2.5 | 1210 | $1,947 | $1.61 | 1d | 33 | 1.39mi |
HOA detail condo
- Monthly dues
- $200 · $2,400/yr
- Likely covers
- pool
- Assessments
- None detected in remarks — confirm with the listing agent.
Listing history 16 events
-
2026-04-04status Pending
-
2026-03-21price $245,000
-
2026-03-14price $255,000
-
2026-02-16price $265,000
-
2025-11-14$277,000 Active
-
2022-08-08soldstatus $190,000 Closed 421-char remark
Show marketing remark (421 chars)
Move in ready condo in popular Carmel location. Walking distance to Carmel Arts District & Palladium. This second floor unit includes a fantastic deck overlooking the neighborhood pond. Brand new carpet throughout, SS appliances, and two spacious bedrooms with walk-in closets. Neighborhood features pool and tennis courts. Unit includes one car garage, additional parking space and storage room. Come see today!
-
2022-06-14status Pending 421-char remark
Show marketing remark (421 chars)
Move in ready condo in popular Carmel location. Walking distance to Carmel Arts District & Palladium. This second floor unit includes a fantastic deck overlooking the neighborhood pond. Brand new carpet throughout, SS appliances, and two spacious bedrooms with walk-in closets. Neighborhood features pool and tennis courts. Unit includes one car garage, additional parking space and storage room. Come see today!
-
2022-06-11$189,900 Active 421-char remark
Show marketing remark (421 chars)
Move in ready condo in popular Carmel location. Walking distance to Carmel Arts District & Palladium. This second floor unit includes a fantastic deck overlooking the neighborhood pond. Brand new carpet throughout, SS appliances, and two spacious bedrooms with walk-in closets. Neighborhood features pool and tennis courts. Unit includes one car garage, additional parking space and storage room. Come see today!
-
2006-08-18soldstatus $93,000 480-char remark
Show marketing remark (480 chars)
This is a 10! Just move in. Quiet end unit condo w/balcony & tranquil pond view. Detached gar (#7) + assigned parking (#31). Plenty of guest parking. Updates to baths. All appls stay including wtr softener ('03). Newer: wtr htr ('06),dryer ('03),washer ('98). Walk in closets in both BRs. Extra storage unit in hall (10x6). End unit for cross ventilation. Secured entry into bldg. Clubhouse,exercise,pool,tennis,billiards,sauna. Near shopp ing,schools,Monon Trail.HMS warranty
-
2006-06-27$95,000 480-char remark
Show marketing remark (480 chars)
This is a 10! Just move in. Quiet end unit condo w/balcony & tranquil pond view. Detached gar (#7) + assigned parking (#31). Plenty of guest parking. Updates to baths. All appls stay including wtr softener ('03). Newer: wtr htr ('06),dryer ('03),washer ('98). Walk in closets in both BRs. Extra storage unit in hall (10x6). End unit for cross ventilation. Secured entry into bldg. Clubhouse,exercise,pool,tennis,billiards,sauna. Near shopp ing,schools,Monon Trail.HMS warranty
-
2002-09-10soldstatus $82,000
-
2002-07-10historical
-
2002-06-18$85,900
-
2002-02-13$85,900
-
2001-11-01soldstatus $81,000
-
2001-09-06$81,900
ⓘ Source: listings_history table (triggers on properties + properties_extension) + one-shot
backfill from property_details.listing_events for pre-trigger history.
Tax reassessment forecast IN · Partial reset (capped growth)
- Current annual tax
- $1,387 · $116/mo
- Projected year-2 tax
- $1,735 · $145/mo
- Expected delta
- +$348/yr (+$29/mo · 25.0%)
ⓘ Screening estimate from a state-policy table — verify with the county assessor before closing.
Climate risk First Street
- Flood 1/10 Low FEMA zone X (unshaded) · 0% chance over 30 yrs
- Wildfire 1/10 Low
- Heat 4/10 Moderate 7 d/yr ≥101°F today · 18 d/yr by 30 yrs out
- Wind 2/10 Low 0% chance of damaging wind over 30 yrs
- Air quality 4/10 Moderate 3 unhealthy d/yr today · 5 by 30 yrs out
Nearby sold comps map
Loading sold comps map…
Walkable amenities ~0.75 mi
Loading nearby amenities…
Taxation est. · year 1
- Rental income
- $27,534
- − Mortgage interest
- −$13,724
- − Property taxes
- −$1,387
- − Insurance
- −$1,225
- − Repairs & maintenance
- −$2,203
- − Management
- −$2,203
- − HOA
- −$2,400
- − Depreciation
- −$7,127
- Taxable loss
- −$2,735
- Est. tax savings @ 24.0%
- +$656
- After-tax cash flow
- $1,978/yr
For passive investors: Depreciation is non-cash, so a rental often shows a tax loss while cash-flowing — sheltering income. Rental losses are passive: they offset passive income freely, and up to $25,000/yr can offset ordinary (W-2) income if you actively participate and your MAGI is under $100k (phasing out to $0 by $150k); unused losses carry forward. On sale, claimed depreciation is recaptured at up to 25%, and gains may owe capital-gains tax (a 1031 exchange can defer both). Figures are a year-1 estimate at your 24.0% rate — not tax advice; consult a CPA.
Schools (NCES district)
- District
- Carmel Clay Schools
- NCES district ID
- 1801200
- Math proficiency
- 68% ▼ -7.00%
- Reading proficiency
- 70% ▼ -7.00%
- Median HH income
- $102,347
- Composite
- 63.54/100
- National rank
- #608
- State rank
- #1 of 301 in IN
Livability — Carmel
- Score
- 84/100
- State rank
- #7
- US rank
- #726
Category grades
Schools grade is shown separately in the Schools card above.
Census & demographics
- Census place
- Carmel, IN
- County
- Hamilton County · 337,479 people
- City population
- 99,910
- Metro
- Indianapolis-Carmel-Anderson, IN
- Population (ZIP)
- 51,515
- Household income
- $132,085
- Rent vs Own
- Severe rent burden
- 1216.0
Population outlook (Hamilton County) Hauer SSP2
- Today (2025)
- 381,938 people
- By 2030
- 417,496 · +9.3%
- By 2040
- 486,684 · +27.4%
- By 2050
- 549,805 · +44.0%
- By 2075
- 687,078 · +79.9%
- By 2100
- 754,495 · +97.5%
Race, ethnicity, and origin ACS 2023
- Neighborhood character
- Predominantly White (77%)
- Race & ethnicity
- White 77% Asian 10% Two or more races 6% Hispanic / Latino 5% Black 4%
- Hispanic origin (detail)
- Mexican 2%
- Common ancestry
- Romanian 4% Lithuanian 3% Slovak 2%
- Foreign-born
- 13% · Canada, China, South Korea
- Languages at home
- 85% English-only · Other Indo-European 4% Spanish 3% Chinese 2%
Political lean MEDSL · Hamilton
- 2024 margin
- Lean R (+6.1) · D 46.0% · R 52.1% · Other 1.9%
- 2008→2024 swing
- +16.2pp toward D · 2008: -22.2pp · 2024: -6.1pp
- All cycles
- 2024: R+6.1 2020: R+6.8 2016: R+19.6 2012: R+34.3 2008: R+22.2
Not yet ingested
- Civics
- —
Market trends
- HPI YoY
- ▼ -248.06%
- Current HPI
- 221.9087
- Rent YoY
- ▲ 6.47%
- Metro
- Indianapolis-Carmel-Anderson, IN
- State GDP YoY
- ▲ 2.90%
- F500 in state
- 18
Industry mix (Fortune 500 HQ in IN)
| Industry | F500 HQs | Revenue |
|---|---|---|
| Industrial Machinery | 2 | $37B |
|
||
| Healthcare | 1 | $177B |
|
||
| Pharmaceuticals | 1 | $45B |
|
||
| Metals / Steel | 1 | $18B |
|
||
| Agriculture | 1 | $17B |
|
||
| Packaging | 1 | $12B |
|
||
Price history
+199.1% since first listed16 events — show timeline
- 2026-04-04 Pending — MIBOR as Distributed by MLS Grid
- 2026-03-21 Price Changed $245,000 MIBOR as Distributed by MLS Grid
- 2026-03-14 Price Changed $255,000 MIBOR as Distributed by MLS Grid
- 2026-02-16 Price Changed $265,000 MIBOR as Distributed by MLS Grid
- 2025-11-14 Listed $277,000 MIBOR as Distributed by MLS Grid
- 2022-08-08 Sold (MLS) $190,000 MIBOR as Distributed by MLS Grid
- 2022-06-14 Pending — MIBOR as Distributed by MLS Grid
- 2022-06-11 Listed $189,900 MIBOR as Distributed by MLS Grid
- 2006-08-18 Sold (MLS) $93,000 MIBOR as Distributed by MLS Grid
- 2006-06-27 Listed $95,000 MIBOR as Distributed by MLS Grid
- 2002-09-10 Sold (MLS) $82,000 MIBOR as Distributed by MLS Grid
- 2002-07-10 Listing Removed — MIBOR as Distributed by MLS Grid
- 2002-06-18 Listed $85,900 MIBOR as Distributed by MLS Grid
- 2002-02-13 Listed $85,900 MIBOR as Distributed by MLS Grid
- 2001-11-01 Sold (MLS) $81,000 MIBOR as Distributed by MLS Grid
- 2001-09-06 Listed $81,900 MIBOR as Distributed by MLS Grid
Property tax history
+10.2%/yrLatest (2025): $1,387 · +125.9% YoY. Source: county tax records.
Cash-flow waterfall
monthlySold comps — $/sqft
last 12 mo · ≤1 miLoading sold comps…